www.elsevier.comrlocaterlithos
Petrologic and geochemical constraints on the petrogenesis of
Permian–Triassic Emeishan flood basalts in southwestern China
Yigang Xu
a,), Sun-Lin Chung
b, Bor-ming Jahn
c, Genyao Wu
da
Guangzhou Institute of Geochemistry, Chinese Academy of Sciences, 510640 Wushan, Guangzhou, China b
Department of Geology, National Taiwan UniÕersity, Taipei, Taiwan c
Geosciences Rennes-CNRS, UniÕersite de Rennes 1, 35042 Rennes Cedex, France´
d
Institute of Geology and Geophysics, Chinese Academy of Sciences, 100029 Beijing, China
Received 15 December 2000; accepted 19 July 2001
Abstract
The Emeishan flood basalt is a large igneous province erupted during the Permian–Triassic period in southwestern China. Based on petrographic, major and trace element, and Sr–Nd isotope data, the Emeishan basalts can be classified into two
Ž . Ž . Ž . )
Ž . Ž .
major magma types. These are: 1 a low-Ti LT type that exhibits low TirY - 500 , Fe O2 3 - 12% , NbrLa 0.6–1.4 ,
Ž . Ž . Ž . Ž . Ž . Ž .
´Nd t y4.8 to q1.4 and relatively high SiO2 48–53% and Mga 0.52–0.64 ; 2 a high-Ti HT type that has high
Ž .
TirY ) 500 . The HT lavas can be further divided into three subtypes. HT1 lavas exhibit significantly high TiO2
Ž . )
Ž . Ž . Ž . Ž . Ž .
3.65–4.7% , Fe O2 3 12.7–16.4% , NbrLa 0.75–1.1 , coupled with higher ´Ndt 1.1–4.8 and lower SiO2 45–51% ; HT2 lavas are compositionally similar to the HT1 lavas but show conspicuous depletion in U and Th. The HT3 type has
Ž . Ž .
higher Mga 0.51–0.61 than the HT1 and HT2 lavas. It differs from the LT type in having higher TiO2 ; 3% at
comparable Mga. Elemental and isotopic data suggest that the chemical variations of the LT and HT lavas cannot be explained by crystallization from a common parental magma. Instead, they may originate from different mantle sources under various melting conditions and underwent distinct differentiation and contamination processes. REE inversion
Ž .
calculations indicate that the HT magmas were generated by low degrees of partial melting 1.5% of a mantle source that
Ž . 87 86 Ž .
has ´Nd t of ; q5 and Srr Sr t of ; 0.704 within the garnet stability field. These magmas were then subjected to shallow level gabbroic fractionation, which led to larger chemical variations. In contrast, parental magmas of the LT type
Ž . Ž Ž . 87 86 Ž . .
were generated by higher degree of partial melting 16% of a distinct mantle source ´Ndt f q2, Srr Sr t f 0.705
Ž .
around the spinel–garnet transition zone. The chemical evolution of the LT lavas is controlled by an olivine ol q
Ž .
clinopyroxene cpx fractionation. The Emeishan flood basalts may result from a starting mantle plume. The petrogenesis of both the LT and HT magmas was further complicated by contamination of upper crust and lithospheric mantle. While the HT1 lavas have experienced an AFC style of contamination in the upper crust, the HT2 lavas that mark with U–Th depletions may result from additional interaction with melts derived from a gabbroic layer near the crust–mantle boundary. In contrast, a temperature-controlled style of contamination was associated with the LT lavas. Our data show that both temporal and spatial geochemical variations exist in the Emeishan flood basalt province. The occurrence of thick LT lavas in the western part of the province may record the main episode of the flood basalt emplacement. In contrast, the less abundant
)
Corresponding author. Tel.: q86-20-8529-0109; fax: q86-20-8529-0130.
Ž .
E-mail address: yigangxu@gig.ac.cn Y. Xu .
0024-4937r01r$ - see front matter q 2001 Elsevier Science B.V. All rights reserved.
Ž .
overlying HT basalts may imply a waning activity of the plume. In fact, the HT basalts are the dominant magma type in the periphery of the province. The lower degrees of mantle melting of the HT lavas may be a result of relatively thicker lithosphere and lower geotherm. q 2001 Elsevier Science B.V. All rights reserved.
Keywords: Emeishan flood basalts; Geochemistry; Petrogenesis; Mantle plume; SW China
1. Introduction
Not until recently, the Emeishan flood basalt in southwestern China has been recognized as one of
Ž . Ž
the large igneous provinces LIP Coffin and Eld-holm, 1994; Mahoney and Coffin, 1997; Chung and
.
Jahn, 1995; Chung et al., 1998 . Previous studies were focused on the high-Mg magmas or picrites that are generally believed to have occurred in the axis of mantle plumes andror represent the melting
Ž
product of plume tails Campbell and Griffiths,
.
1990 . A general model involving plume–lithosphere interaction has been proposed for geochemical and isotopic variations observed in the Emeishan picrites
ŽChung and Jahn, 1995 . This paper presents an.
extended study on the petrology and geochemistry of dominant basaltic lavas in the Emeishan LIP. New major, trace element and Sr–Nd isotopic data of the basaltic rocks collected from several representative
Ž .
thick sections up to 5 km in Sichuan and Yunnan Provinces are reported. These data allow us to
iden-Ž
tify four magma types i.e., low-Ti type and three
.
subtypes of high-Ti lavas . We will address impor-tant aspects of the petrogenesis of these magma types, such as mantle melting conditions, shallow-level differentiation and relative contribution of the mantle and crust components in magma generation, as well as geodynamic implication of temporal and spatial relationships between the high-Ti and low-Ti magmas.
2. Geological background
The Emeishan LIP is located in the western
mar-Ž .
gin of the Yangtze craton, SW China Fig. 1 . The basement of Emeishan LIP consists mainly of
meta-Ž
morphic rocks of Middle Proterozoic age Zhai and
. Ž
Yang, 1986 . Since the early Permian, thick ) 1
.
km carbonate sequences began to deposit as a
re-sponse to extensive transgression and basin
subsi-Ž .
dence Yunnan, 1990; Sichuan, 1991 . The basement subsidence was probably related to the rifting of the
Ž
Qiangtang Terrane off South China Huang et al.,
.
1992 . Later, rapid basement uplift took place before the main eruption of the Emeishan LIP. This uplift seems to have been a regional event that resulted in a general lack of sedimentary deposition from the up-permost Permian to the lower Triassic in the western
Ž
part of the South China Block Chung et al., 1998
.
and references therein . Consequently, the massive volcanic successions cover uncomfortably on the early Late Permian Maokou formation, which corre-sponds to the CapitanianrKazanian stage. Therefore, the eruption age of the overlying magmas should be nearly coeval to or younger than the Longtainian of
Ž .
253–258 Ma Harland et al., 1989 . Limited Ar–Ar dating results of the basaltic lavas and associated intrusives show that the Emeishan LIP was emplaced
Ž .
at ; 253–250 Ma Chung et al., unpublished data around the Permian–Triassic boundary. The lack of thick sedimentary piles or paleosols within the vol-canic sections implies a short eruption period of the entire sequence. This is consistent with the result of a recent magnetostratigraphic study that suggests a magmatic duration of the Emeishan flood basalt - 2
Ž .
Ma Huang and Opdyke, 1998 . The eruption of the Emeishan basalts is roughly synchronous with that of
Ž .
the Siberian traps 250 " 1 Ma; Renne et al., 1995 . Huge-volume magma eruption over a few million years may have triggered the environmental catastro-phe accompanied by the greatest mass extinction at
Ž .
the Permian–Triassic boundary Chung et al., 1998 . The Emeishan basalts are exposed in a rhombic province of ; 250 000 km2 within Yunnan, Sichuan
Ž .
and Guizhou Provinces Fig. 1 . The Red River shear zone is traditionally considered as its western
bound-Ž .
ary e.g., Zhang et al., 1988 . However, some basalts and mafic complexes exposed in the Simao basin, northern Vietnam and Qiangtang terrain are possibly
Ž
Ž .
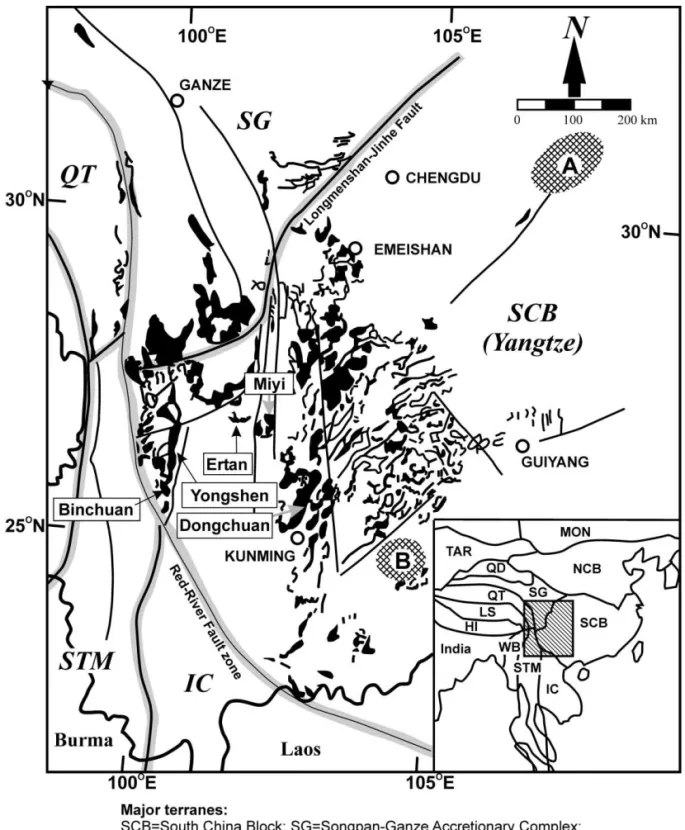
Fig. 1. Schematic map showing the distribution of the Permian–Triassic volcanic successions black areas in the Emeishan basalt province
Ž .
and adjacent regions modified after Chung et al., 1998 . The inset illustrates major tectonic unites in eastern Asia. The shaded areas, marked with A and B, indicate subsurface mafic volcanic succession as revealed by drilling studies. Arrows indicate the sampling localities.
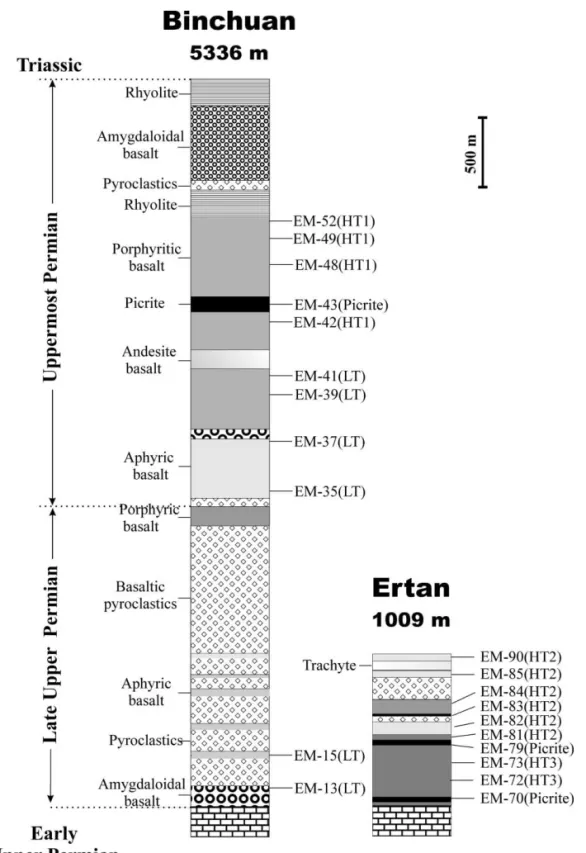
Ž .
Fig. 2. Composite stratigraphic columns at Binchuan and Ertan modified after Huang, 1986 . Relative stratigraphic locations and magma type of studied samples in the volcanic sections are also shown. Each shaded part represents individual lava flow. Analyses of picrites
.
1998 . Some Emeishan-type basalts traced in north-ern Vietnam may be related to the mid-Tertiary continental extrusion of Indochina relative to South China along the Ailao Shan–Red River fault zone
ŽTapponnier et al., 1990; Chung et al., 1997 . It is.
likely that the later tectonic events have resulted in major disruption of the former province. The three dimensional structure of the Emeishan LIP is poorly known, but its east–west thickness variation in
vol-Ž .
canic successions has been reported by Lin 1985
Ž .
and Huang 1986 . The thickness varies from over
Ž .
5000 m in the west i.e., in Yunnan Province to
Ž
several hundred meters in the east i.e., in Guizhou
.
Province . The average lava thickness of the LIP was
Ž .
estimated to be about 700 m Lin, 1985 , thus the entire volume of the Emeishan basalts to be ; 0.3 = 106 km3. This represents a minimum estimate
be-Ž .
cause: 1 complicated tectonic movements in Me-so-Cenozoic eras in this region cut off the
west-Ž .
ern extension of the LIP Chung et al., 1998 ;
Ž .2 erosion must have removed a significant portion
Ž .
of the eruptive sequences; and 3 the associated intrusives are not taken into account.
The lateral variation in lava thickness is accompa-nied by variations in lithology and geochemical
char-Ž .
acteristics Huang, 1986; Zhang et al., 1988 . In the west, the Emeishan lavas show a remarkable diver-sity of rock type including picrite, basalt, basaltic andesite, rhyolite–trachyte and basaltic pyroclastics. Furthermore, tuffs of trachyte and rhyolite
composi-Ž
tion occur in the upper volcanic sequence Fig. 2;
.
Huang, 1986; Chung et al., 1998 . Such a composi-tional bimodality is also revealed by the associated intrusive rocks that comprise syneites and layered gabbros. Some of syneites and gabbros are
associ-Ž
ated with massive V–Ti–Fe ore deposits Sichuan,
.
1991 . In contrast, the lavas emplaced in the east part of the Emeishan LIP are uniformly tholeiitic–alkali basalts. They are characterized by rather high TiO2
Ž3.6–5% and low MgO - 6% contents Lin, 1985;. Ž . Ž .
Huang, 1986 , suggesting an evolved basaltic magma composition.
3. Sampling and analytical techniques
Samples studied in this paper are from a recon-naissance collection of basalts from Binchuan and
Yongshen in western Yunnan Province, and from
Ž
Ertan and Miyi in southern Sichuan Province Fig.
. Ž .
1 . Two additional samples EM-1 and EM-3 were collected from the uppermost lava sequence in
Ž .
Dongchuan area eastern Yunnan . Unfortunately, systematic sampling of volcanic succession with a stratigraphic height control was not possible due to the poor exposure and severe weatheringralteration of the lava flows. This prevents from detail geo-chemical assessment of the temporal evolution of these rocks. The samples collected, nevertheless, show various lithology including picrite, tholeiite, basaltic andesite, rhyolite and trachyte, in the
docu-Ž .
mented stratigraphic columns Fig. 2 .
Twenty-five basalts and one picrite were analyzed
Ž
in this study. These include fresh with loss on
. Ž .
ignition, LOI - 1% to altered LOI of 3–4% sam-ples. The rocks were sawn into slabs and the central portions were handpicked and powered using an agate mill. Whole-rock abundances of major and
Ž
some trace Rb, Ba, Sr, Nb, Ni, Cr, Zr, Co, Y, V,
.
Zn, Cu and Ga elements were determined on glass discs and pressed pellets, respectively, using a Philips PW1400 X-ray fluorescence spectrometer at
Univer-w
site de Rennes I. Additional trace element data e.g.,
´
Ž . x
the rare earth elements REE , Th, U, Hf and Ta were measured by the instrumental neutron
activa-Ž .
tion analysis INAA at National Taiwan University. The analytical uncertainties were estimated to be generally - 1% for the major elements and 5–15% for the trace elements. The Sr–Nd isotopic ratios were obtained by a Finnigan MAT262 mass spec-trometer at Universite de Rennes I. Details of all the
´
analytical methods were described by Chung et al.
Ž1995 ..
4. Results
4.1. Classification of the Emeishan basalts
For the convenience of description and following
Ž .
the studies in other continental flood basalts CFB , we divide the Emeishan flood basalts into two major
Ž .
magma types: high-Ti HT, TirY ) 500 and low-Ti
ŽLT, TirY - 500 basalts. TirY, rather than TiO ,. 2
TiO contents generally increase but TirY does not2 Ž
vary much during fractional crystallization Peate et
.
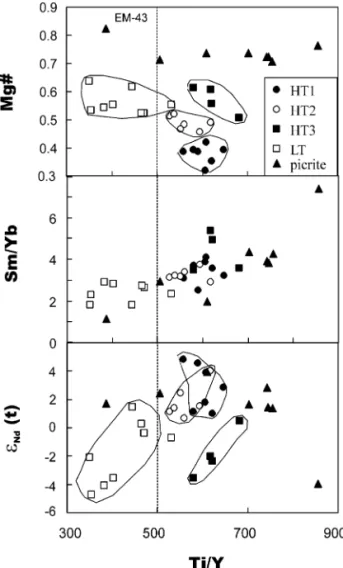
al., 1992 . Fig. 3 shows that TirY in the Emeishan
Ž
basalts is somewhat correlated with Mga indicator
. Ž
of differentiation , SmrYb degree of HREE
frac-.
tionation, hence depth of magma generation and
Ž . Ž
´Nd t nature of source or extent of lithospheric
.
assimilation . In general, the LT lavas have higher
Ž .
Mga, lower SmrYb ratio and ´Nd t compared to
most HT lavas. However, Mga of four HT samples
ŽEM-72, EM-73, EM-93, EM-99 overlap that of the.
LT lavas. These samples, designated as HT3 magma
Ž .
type, also show low ´Nd t compared to the
remain-ing HT lavas. The latter are further subdivided into
Ž .
Fig. 3. Diagram showing variation of Mga, SmrYb and ´Nd t
against TirY for the Emeishan basalts. Data for picrites are from
Ž .
Chung and Jahn 1995 .
Ž . Ž
HT1 TiO ) 3.6%, Mga - 0.45 and HT2 TiO -2 2 .
2.5–3.5%, Mga s 0.45–0.52 . The HT2 magma type
Ž
contains six samples from the Ertan section EM-78,
.
EM-81, EM-82, EM-84, EM-85, EM-90 , which show peculiar petrographic feature and trace element
Ž
composition when compared to the HT1 lavas see
.
next sections . This classification is rather prelimi-nary and could be refined when more data are avail-able. Nevertheless, it will be justified further in later sections because the HT and LT magma types are believed to have originated from different mantle sources under various melting conditions followed by different petrogenetic processes.
Two types of picrites can also be distinguished in terms of this classification. EM-43 from Binchuan has low TirY and SmrYb ratios and plot with the
Ž .
field of LT lavas Fig. 3 . In contrast, other picrites from Yongshen and Ertan show compositional affin-ity to the HT lavas.
4.2. Petrography
Distinct petrographic features are noted for differ-ent magma types in terms of phenocryst and
ground-Ž .
mass compositions Table 1 , although both aphyric and phyric textures are observed in the LT and HT lavas. The dominant phenocryst in the LT samples is
Ž .
clinopyroxene 25–30% with occasionally minor
Ž .
olivine - 10% . Plagioclase phenocryst is generally absent in this magma type. The groundmass is
com-Ž . Ž
posed of plagioclase 35–64% , clinopyroxene 15–
. Ž .
44% , basaltic glasses or microlite 15–18% and
Ž .
minor magnetite 1–4% . A similar petrographic fea-ture is noted for the HT3 lavas. In contrast, plagio-clase is the dominant phenocryst in the HT1 and HT2 samples that also exhibit relatively high
con-Ž .
tents of magnetite 3–8% in groundmass. In detail, the HT1 lavas show relatively lower contents of
Ž .
plagioclase phenocrysts 4–10% than the HT2
Ž .
basalts 13–33% . The latter contain large and
tabu-Ž .
lar plagioclases ) 5 mm which commonly form as aggregates with a Aflower-likeB shape.
Clinopyrox-Ž .
ene phenocryst of variable amount 3–10% is
exclu-Ž
sively observed in HT2 samples EM-82, EM-84,
.
EM-85 . The groundmass in the HT1 lavas
predomi-Ž .
nantly contains plagioclase 50–60% and microlite
Table 1
Petrographic characteristics of the Emeishan flood basalts
Phenocryst Groundmass
Ž . Ž . Ž . Ž .
Low-Ti type LT cpx 25–30% plagioclase 35–64% , cpx 15–44%
Ž . Ž . Ž .
occasionally ol - 10% basaltic glasses 15–18% , magnetite 1–4%
Ž . Ž . Ž .
High-Ti type HT1 plagioclase 4–10% plagioclase 50–60%
Ž .
basaltic glass 32–42%
Ž .
magnetite 3–5%
Ž . Ž . Ž . Ž .
High-Ti type HT2 plagioclase 13–33% plagioclase 21–44% , cpx 14–40%
Ž . Ž . Ž .
cpx 3–10% basaltic glass 16–25% , Ti–Fe biotite 4–10%
Ž .
magnetite 5–8%
Ž . Ž . Ž . Ž .
High-Ti type HT3 cpx 20–30% plagioclase 40–60% , cpx 15–40%
Ž . Ž .
basaltic glasses 15–20% , magnetite 3–6%
Ž3–5% , contrasting with the significant amount of.
Ž . Ž .
clinopyroxene 14–40% and magnetite 5–8% in the groundmass of the HT2 lavas. Another notewor-thy point is that the HT2 samples contain a variable
Ž .
amount of Ti–Fe-rich biotite 4–10% .
4.3. Major and minor elements
The Emeishan basalts display wide variations in
Ž .
major element composition Table 2 . In general, the
Ž .
HT1 lavas Mga s 0.45–0.31 are more evolved
Ž .
than the LT samples Mga s 0.63–0.51 , with the HT2 lavas being compositionally transitional be-tween them. Mga of HT3 lavas overlap with that of LT samples. But HT3 lavas have higher TiO2 and lower Al O contents than the LT basalts at compa-2 3
Ž .
rable Mga Fig. 4b,d . Mga negatively correlates
Ž .
with TiO , and Fe O2 2 3 Fig. 4b,e . However, there is no simple correlation between Mga and CaO, SiO2
Ž .
and Al O2 3 Fig. 4a,c,d . For example, Mga nega-tively correlates with SiO , but the HT1 and HT22
lavas and LT samples define two different trends
ŽFig. 4c . The HT2 lavas have lower SiO than the. 2
LT basalts at comparable Mga. CaO and Al O in2 3 the LT samples increase with decreasing Mga, but reverse trends are noted for the HT1 and HT2 lavas
Ž .
although trends are poorly defined Fig. 4c,d . The picrites are distinguished from the basalts by their high Mga, low SiO , Al O and Na O contents.2 2 3 2
The HT1 and HT2 basalts show a rather low and
Ž .
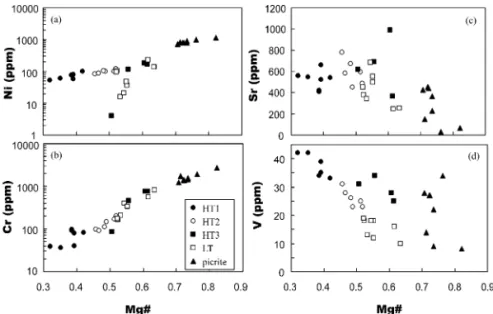
limited range of nickel content 53–102 ppm which
Ž .
correlates positively with Mga Fig. 5a . Some LT and HT3 samples display a distinctive trend with Ni
contents dramatically decreasing from 200 ppm at Mga of 0.63 to - 10 ppm at Mga of 0.50. The
Ž
picrites show significantly higher Ni contents up to
.
1100 ppm , consistent with their abundant olivine
Ž .
phenocrysts Chung and Jahn, 1995 which exhibit
Ž
high-Mg contents Fo f 83–89; Xu and Chung,
.
2001 . Cr also correlates positively with Mga, whereas V, Cu and Zr negatively correlate with
Ž .
Mga Fig. 5 . In the plot of Sr vs. Mga, Sr contents in the LT and the HT2 basalts increases with de-creasing Mga, whereas the HT1 samples are
signifi-Ž .
cantly off the negative correlation Fig. 5e . Consis-tent with the observation in terms of major element composition, the picrites and basalts do not form coherent trends in variation diagram between minor
Ž .
elements except for Cr and Mga.
4.4. Incompatible trace elements
The variation in trace element composition in the Emeishan basalts is correlated with their TiO con-2
Ž .
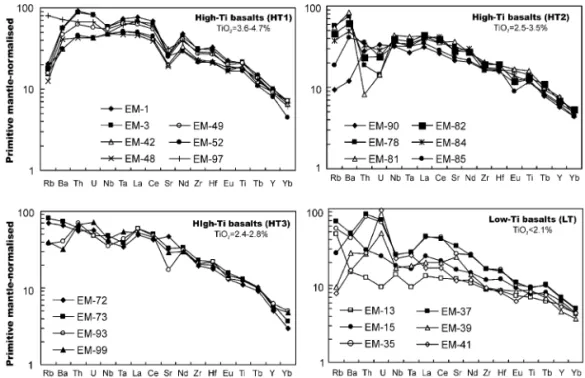
tents and petrographic features Table 2 . In the primitive-mantle normalized spidergrams, the HT1 lavas are characterized by depletion of Rb and Ba
Ž .
relative to Th except for EM-97 and by marked
Ž .
negative Sr anomaly Fig. 6a . Slight negative Nb anomaly is noted in samples of this group. The HT2
Ž .
lavas except for EM-90 display marked positive Ba anomalies that are associated with the formation of significantly negative Th and U anomalies. Unlike the HT1 samples, only weak Sr anomaly is present in
Ž .
the HT2 lavas Fig. 6b . Negative Eu anomaly is observed in some of the samples. Enrichment of Rb
Table 2
Representative major and trace element data for the Emeishan flood basalts
Ž . Ž .
Locality Low-Ti basalts LT High-Ti basalts HT1
EM-13 EM-15 EM-35 EM-37 EM-39 EM-41 EM-43 EM-95 EM-98 EM-01 EM-03 EM-42 EM-48
Binchuan Miyi Dongchuan Binchuan
( ) in percent % SiO2 48.00 53.22 50.76 49.33 49.48 49.13 41.86 49.97 50.06 51.09 49.87 46.96 45.71 TiO2 1.52 1.65 2.08 2.04 1.86 1.78 0.58 2.28 2.33 4.55 4.66 4.00 4.13 Al O2 3 13.50 13.34 13.53 13.53 15.19 13.09 6.99 13.41 13.55 12.80 12.90 12.82 13.05 Fe O2 3 11.93 10.32 11.00 11.19 11.21 11.13 11.08 11.50 11.76 15.11 15.67 15.99 16.40 MgO 10.43 5.93 6.84 6.72 6.96 8.99 25.70 6.38 6.47 3.59 4.29 5.06 5.18 CaO 9.62 8.45 7.96 8.92 7.48 7.80 7.30 9.39 10.03 7.54 7.05 10.68 9.12 Na O2 1.12 3.39 3.79 3.27 4.22 4.16 0.16 3.08 2.22 2.69 2.42 2.23 3.30 K O2 0.67 0.76 1.07 0.77 0.36 0.22 0.09 1.19 0.62 0.92 0.80 0.55 0.60 MnO 0.17 0.15 0.15 0.17 0.15 0.20 0.18 0.17 0.17 0.23 0.25 0.21 0.28 P O2 5 0.16 0.23 0.23 0.22 0.18 0.16 0.12 0.22 0.22 0.52 0.53 0.42 0.43 LOI 2.79 2.47 2.44 3.50 2.93 3.21 5.41 2.10 1.73 0.78 1.28 1.04 1.73 Total 99.91 99.91 99.85 99.66 100.02 99.87 99.47 99.69 99.16 99.82 99.72 99.96 99.93 Mga 0.64 0.53 0.55 0.55 0.55 0.62 0.82 0.53 0.52 0.32 0.35 0.39 0.39 in ppm V 274 240 306 308 273 293 132 354 352 492 513 524 550 Ga 19 17 19 21 17 13 8 20 20 26 27 26 23 Cu 50 20 45 36 59 45 58 154 134 202 211 323 170 Zn 89 84 93 94 88 83 66 97 94 144 153 138 140 Co 53 34 43 43 49 57 95 43 45 40 46 45 45 Ni 137 16 37 21 48 232 1160 104 96 53 61 77 76 Cr 820 204 336 400 335 561 2344 163 173 38.1 36 98 91 Rb 30 17 35 43 6 5 5 27 14 13 11 10 8 Ba 104 330 289 335 183 111 99 340 324 403 388 219 286 Th 1.1 2.5 6.8 7.2 2.2 2.3 0.5 3.4 3.2 7.9 7.5 3.9 3.7 U 0.2 0.5 1.4 1.5 1 2 0.6 0.5 1.7 1.7 0.9 0.9 Nb 10 13 18 18 12 16 8 18 19 42 42 34 34 Ta 0.39 0.68 1.1 1.1 0.75 1 0.3 1.1 1.2 3 2.8 2.1 1.9 Sr 254 342 550 687 496 246 68 380 453 560 549 419 408 Zr 99 131 186 184 104 105 34 184 190 346 348 257 252 Hf 2.6 3.7 5 4.7 2.7 2.5 0.85 5.1 5.2 10.2 9.4 6.8 6.4 Y 26 28 31 32 21 24 9 29 30 45 45 43 42 La 9.2 16.6 29.2 29.7 13.7 11.7 4.41 26.5 27.40 52.2 46.4 33.7 31.7 Ce 22.0 37.3 74.7 72.6 35.3 38.5 10.1 60.9 61.7 122 114 74.4 68.7 Nd 14.5 19.9 34.3 33.4 18.8 15.8 4.9 30.7 30.5 64.2 58.7 45 40.4 Sm 3.79 4.98 6.91 7.21 4.19 3.93 1.28 6.69 6.64 13.1 12.6 9.79 8.89 Eu 1.24 1.56 1.73 1.86 1.43 1.05 0.43 2.04 2.06 3.74 3.61 3.1 2.81 Tb 0.67 0.87 1.08 1.11 0.73 0.81 0.30 0.98 0.96 1.62 1.58 1.36 1.23 Yb 2.09 2.17 2.44 2.50 1.81 2.16 1.12 2.53 2.44 3.40 3.55 3.20 3.52 Lu 0.29 0.33 0.35 0.36 0.27 0.33 0.16 0.29 0.28 0.5 0.47 0.46 0.44 TirY 351 354 403 383 531 445 387 472 466 607 621 558 590 Ž 2q. 3q 2q
EM-43 is a picrite; Mga s Mgr Mg q Fe with Fe rFe s0.15.
and Ba relative to Th and U is observed in the HT3
Ž .
lavas Fig. 6c . They are also characterized by the significant depletion of Ta and Nb relative to La.
Trace element distribution pattern is highly
vari-Ž .
able for the LT samples Fig. 6d . The positive U anomaly in EM-39 and EM-41 could be due to
Ž . Ž .
High-Ti basalts HT2 High-Ti basalts HT3
EM-49 EM-52 EM-97 EM-78 EM-81 EM-82 EM-84 EM-85 EM-90 EM-72 EM-73 EM-93 EM-99
Miyi Ertan Ertan Miyi
46.02 48.61 48.63 43.39 44.51 45.82 46.95 47.21 48.05 48.15 49.13 49.57 50.12 4.53 3.65 3.87 3.08 3.47 2.85 2.55 2.51 2.68 2.37 2.80 2.71 2.84 13.33 12.69 14.99 14.62 13.75 14.99 15.07 14.72 13.95 11.27 11.66 11.61 12.98 16.20 14.89 12.73 15.11 16.37 14.35 13.1 13.11 12.65 12.38 12.15 11.61 12.07 5.26 5.42 4.13 7.11 6.93 6.33 6.96 7.12 6.10 9.57 7.70 9.31 6.24 9.16 10.26 7.99 10.54 10.15 9.76 10.12 11.02 8.82 9.05 8.75 10.35 9.94 2.35 2.03 2.54 2.21 2.4 2.55 2.52 2.38 4.22 2.00 2.77 1.12 1.84 0.81 0.50 2.04 1.20 1.08 1.15 0.85 0.59 0.34 1.79 2.03 1.12 0.93 0.26 0.19 0.16 0.20 0.22 0.2 0.19 0.19 0.19 0.18 0.14 0.17 0.18 0.48 0.36 0.45 0.33 0.35 0.29 0.28 0.26 0.31 0.27 0.34 0.24 0.29 1.44 1.46 2.46 0.99 0.81 0.25 0.68 0.61 2.43 1.78 2.05 2.10 2.23 99.84 100.06 99.99 98.78 99.23 98.55 99.26 99.73 99.74 98.81 99.52 99.91 99.66 0.39 0.42 0.39 0.48 0.46 0.47 0.51 0.52 0.49 0.61 0.56 0.61 0.51 559 486 418 407 438 369 344 348 393 347 333 295 368 27 23 24 25 26 24 23 22 23 17 20 18 20 263 240 168 213 209 159 44 42 42 50 180 50 6 134 124 116 120 121 115 103 96 112 95 90 93 99 43 48 36 54 52 47 49 50 45 54 45 49 41 78 102 57 103 85 86 101 119 101 184 115 163 4 78 82 40 111 98 90 169 196 145 753 457 757 83 10 12 51 36 35 29 24 12 6 45 51 24 25 329 221 501 524 590 424 339 288 84 451 511 286 223 5.4 3.9 5.7 1.6 0.7 2 2.8 3.1 2.4 4.7 5.2 6 5.8 1.2 0.9 1.4 0.3 0.3 0.5 0.6 0.5 0.7 1.2 1 1 1.5 39 33 35 26 31 28 25 23 23 28 34 25 31 2.6 2.1 2.5 1.3 1.7 1.5 1.4 1.3 1.1 1.4 1.6 1.8 2.2 523 541 660 671 780 584 595 488 453 991 688 366 618 304 242 319 178 227 213 196 188 182 219 260 236 230 8.2 6.6 8.7 5.1 5.8 5.9 5.3 5.2 4.8 5.5 6.7 6.7 6.2 42 36 40 33 35 31 29 28 26 23 27 28 25 42.7 34.4 46.5 27.6 29.6 29.8 27.4 24.2 21.7 33.7 40.4 40.3 36.6 97.2 79.1 104.6 62.3 63.8 68.8 74.0 50.9 46.3 75.6 89.4 84.2 81.7 55.1 39.7 53.1 37.2 35.9 36.8 40.7 29.1 27.5 40.9 45.6 41.9 40.3 11.3 9.08 11.2 8.31 8.45 8.34 7.46 6.98 6.29 7.80 8.89 8.53 8.49 3.36 2.82 3.24 2.66 2.78 2.03 2.33 1.50 1.90 2.20 2.61 2.23 2.48 1.47 1.18 1.45 1.00 1.09 1.19 0.92 0.89 0.84 0.99 1.05 1.09 1.11 3.53 2.22 3.02 2.46 2.26 2.64 2.4 2.18 2.16 1.46 1.81 2.46 2.37 0.43 0.34 0.35 0.33 0.34 0.34 0.33 0.33 0.33 0.22 0.25 0.27 0.27 647 608 581 560 595 552 528 538 618 618 622 581 682
surface alteration. Some LT lavas generally show relatively low SmrYb ratios compared to the HT samples. Samples with marked negative anomalies of
Ž .
Nb and Ta EM-35, EM-37 have significantly higher SmrYb ratios than those with enrichment of Nb and
Ž .
Fig. 4. Variation of SiO , TiO , Fe O , CaO, Al O and Na O versus Mga for the Emeishan basalts. The star indicates the composition of2 2 2 3 2 3 2
primary magmas estimated from the composition of olivine phenocrysts in high-TirY picrites and melt inclusions trapped in the olivines
ŽXu and Chung, 2001 ..
4.5. Sr–Nd isotope ratios
The measured and age-corrected 87Srr86Sr and
143
Ndr144Nd ratios are listed in Table 3. The initial
isotopic ratios were all corrected to 250 Ma accord-ing to our unpublished Ar–Ar age data. In the
87 86
Ž . Ž . Ž .
Srr Sr t –´Nd t correlation diagram Fig. 7 , the Emeishan basalts define an array that lies near
Fig. 6. Primitive mantle-normalized trace element concentrations in the Emeishan basalts. Normalizing values are from Sun and
Ž .
McDonough 1989 .
the Amantle correlation lineB but is distinctly dis-placed to the right. In general, the HT1 and HT2
Ž .
basalts have relatively higher ´Nd t and lower
87 86
Ž .
Srr Sr t values than the LT and HT3 basalts. The HT2 samples, compared to the HT1 magmas, show a remarkable limited range in Sr isotopic
com-Ž .
positions Table 3 . In HT and LT magma types, the basalts that show OIB-like trace element patterns
Že.g., samples EM-90, EM-42 and EM-41; Fig. 6. Ž .
commonly have the highest ´Nd t and lowest
87 86
Ž . Ž .
Srr Sr t Table 3 .
5. Discussion
Chemical variation of basaltic lavas in continental settings is essentially controlled by a number of parameters that include mantle temperature,
litho-Ž .
spheric thickness hence degree of partial melting , source composition, and certain shallow level pro-cesses such as crustal contamination and crystal
frac-Ž .
tionation McKenzie and Bickle, 1988 . The relative importance of these different parameters andror pro-cesses is an important issue in the modern petrology but no consensus is reached. For example, the low-Ti and high-Ti basalts associated with the break-up of
Gondwnaland show significant difference in major, trace element composition and isotopic ratios. While
Ž .
Hergt et al. 1991 and Turner and Hawkesworth
Ž1995 favor a model with different mantle sources. Ž
for the two magma types, other authors Fodor,
.
1987; Arndt et al., 1993 interpreted the geochemical discrepancy as a result of distinct melting condition and variable degrees of crustal contamination. We explore the key parametersrprocesses that govern the chemical variation of the Emeishan basalts. Fo-cus will be given on identification of source compo-nents and the genetic relationship between the LT and HT magma types.
5.1. Effect of alteration on magma compositions
The Emeishan flood basalts are ; 250 Ma old and have been altered to various degrees after the eruption, judged from the petrographic observation
Ž .
and relatively high LOI in some samples 3–4% . This process may have changed the concentration of most incompatible elements such as Rb, Ba and K, because these elements are known to be mobile during surface alteration. The sign of element mobil-ity is particularly manifested in the LT lavas which
Table 3
Rb–Sr and Sm–Nd isotopic ratios and abundances for the Emeishan flood basalts
87 86 87 86 143 144 Ž . Ž . Ž . Ž .Ž . Ž . Ž . Ž . Ž . Rb ppm Sr ppm Srr Srme asured Srr Sr t Sm ppm Nd ppm Ndr Ndmeasured ´Ndt ( ) Low-Ti laÕas LT EM-13 30 254 0.707022 " 10 0.705765 3.79 14.5 0.512465 " 5 y2.14 EM-15 17 342 0.706932 " 9 0.706420 4.98 19.9 0.512320 " 6 y4.75 EM-35 35 550 0.706710 " 8 0.706054 6.91 34.3 0.512332 " 5 y3.58 EM-37 43 687 0.706960 " 10 0.706315 7.21 33.4 0.512321 " 6 y4.07 EM-39 6 496 0.705910 " 7 0.705785 4.19 18.8 0.512499 " 6 y0.73 EM-41 5 246 0.705835 " 7 0.705626 3.93 15.8 0.512628 " 12 1.42 EM-43 5 68 0.705378 " 10 0.704621 1.28 4.90 0.512660 " 4 1.70 EM-95 27 380 0.705877 " 9 0.705145 6.69 30.7 0.512511 " 6 y0.40 EM-98 14 453 0.705411 " 8 0.705154 6.64 30.5 0.512544 " 5 0.25 ( ) High-Ti laÕas HT1 EM-01 13 560 0.706177 " 9 0.705938 13.10 64.2 0.512609 " 6 1.78 EM-03 11 549 0.706186 " 7 0.705980 12.60 58.7 0.512580 " 5 1.01 EM-42 10 419 0.704178 " 8 0.703932 9.79 45.0 0.512779 " 5 4.84 EM-48 8 408 0.704565 " 10 0.704363 8.89 40.4 0.512768 " 5 4.57 EM-49 10 523 0.704524 " 8 0.704327 11.30 55.1 0.512663 " 5 2.81 EM-52 12 541 0.704553 " 9 0.704324 9.08 39.7 0.512742 " 10 3.90 EM-97 51 660 0.705950 " 10 0.705154 11.20 53.1 0.512582 " 5 1.12 ( ) High-Ti laÕas HT2 EM-78 36 671 0.705614 " 8 0.705062 8.31 37.2 0.512571 " 5 0.66 EM-81 35 780 0.705623 " 8 0.705261 8.45 35.9 0.512612 " 5 1.50 EM-82 29 584 0.705503 " 10 0.704992 8.34 36.8 0.512617 " 5 2.44 EM-84 24 595 0.705336 " 10 0.704921 7.46 40.7 0.512554 " 3 1.12 EM-85 12 488 0.705178 " 10 0.704925 6.98 29.1 0.512624 " 5 1.38 EM-90 6 453 0.704999 " 8 0.704963 6.29 27.5 0.512746 " 5 4.00 ( ) High-Ti laÕas HT3 EM-72 45 991 0.706764 " 8 0.706297 7.80 40.9 0.512399 " 4 y2.06 EM-73 51 688 0.707222 " 7 0.706459 40.90 45.6 0.512387 " 5 y2.38 EM-93 24 366 0.708263 " 7 0.707587 8.53 41.9 0.512335 " 8 y3.56 EM-99 25 618 0.706795 " 8 0.706378 8.49 40.3 0.512542 " 10 0.48 87 86 Ž . Ž .
Srr Sr t and ´Nd t were calculated for 250 Ma.
show considerable scatter in primitive-mantle nor-malized patterns. It is noted that the LT lavas have
Ž .
relatively higher LOI than most HT lavas Table 2 . For both HT1 and HT2 magma types, one sample is highlighted as being an exception to the overall trace element pattern shown by the majority of samples in
Ž .
each type see Section 4.4 . In both cases, the anomalous sample has markedly higher LOI than
Ž
other samples of that magma types i.e., HT1, EM-97;
.
HT2, EM-90; Table 1 . Clearly, the concentration of most incompatible elements in the Emeishan basalts with LOI ) 2% are affected. The reasonable
posi-Ž .
tive correlation between Na O and LOI not shown2
also suggests the gain of this element during
alter-ation. This casts doubt on the reliability of TAS diagram in identifying the alkalinertholeiitic natures of the Emeishan basalts. On the other hand, age-cor-rection of measured 87Srr86Sr involves Rb concen-trations. For these reasons, emphasis will be placed on immobile elements such as REE, HFSE, Th, Y
Ž .
and Ti, and ´Nd t in the following discussion. The
discussion involving most incompatible elements and
87 86
Ž .
Srr Sr t is limited to those samples with
rela-Ž .
tively low LOI - 2% .
5.2. Magma fractionation
Most basaltic lavas from the Emeishan LIP are not primary mantle melts judged from their low
Ž . 87 86 Ž . Ž .
Fig. 7. Plot of initial ´Nd t and Srr Sr t t s 250 Ma .
Ž . Ž .
MgO mostly - 7% , Mga 0.63–0.33 and Ni
Ž .
contents 4–232 ppm . They are far from the ex-pected composition of melts in equilibrium with
Ž .
mantle peridotites Cox, 1980 . These characteristics suggest that they underwent extensive crystal frac-tionation from parental magmas either in magma chambers or en route to the surface. According to
Ž .
Cox 1980 , primary picritic magmas may have ponded and fractionated near the Moho due to the density contrast between picritic magma and crust. This process produces ultramafic cumulates and residual low MgO basaltic magma. A similar process may have happened at Emeishan. The high seismic
Ž .
velocity layer P wave, 7.1–7.7 kmrs of 26 km in thickness at the base of the crust beneath this province
ŽYuan, 1989. may correspond to the underplated magmas derived from mantle plumes.
The LT lavas may have experienced fractionation
Ž . Ž .
of olivine ol and clinopyroxene cpx from parental magmas. This is supported by the positive correla-tion between Ni and Mga and is also consistent with
Ž .
the presence of cpx "ol as the dominant phe-nocryst in these lavas. Because Sr is compatible in plagioclase, Sr content in the LT lavas increases as
Ž .
Mga decreases Fig. 5 may indicate no significant fractionation of plagioclase in the magma, consistent with the absence of plagioclase phenocryst in the LT lavas. Although the fractionation process is less well constrained for the HT3 lavas due to the limited number of samples, a similar ol q cpx fractionation may apply to the HT3 lavas given the similar petro-graphic feature between HT3 and LT lavas.
The major element variation defined by the HT1 and HT2 lavas is significantly different from that of the LT lavas. Dominant plagioclase phenocrysts, the decreasing Sr with decreasing Mga and the negative
Ž .
Sr anomalies in spidergrams Fig. 6 all suggest the importance of plagioclase over olivine in the crystal fractionation of the HT1 and HT2 basalts. The lack of a large negative Eu anomaly in these evolved lavas must reflect a high Eu3qrEu2q ratio in
mag-Ž .
mas Frey et al., 1993 .
In summary, there are two differentiation trends for the Emeishan basalts, with ol and cpx
fractiona-Ž .
tion in the LT lavas and gabbroic cpx q plag " ol fractionation in the HT basalts. Ti–Fe oxides do not appear to be the major fractionation mineral given the negative correlation between Fe and Ti and Mga
ŽFig. 4b,e . An important question remains as to.
whether the LT and HT lavas represent fractional products of a common parental magma. Using com-position of olivine phenocrysts in high-TirY picrites and melt inclusions trapped in the olivines, Xu and
Ž .
Chung 2001 estimated the composition of parental magma of the picrites, which is plotted in Fig. 4. It is clear that the high-TirY picrites are not parental
Ž
magma to the LT lavas. The low-TirY picrite
EM-.
43 reported in this study provides an alternative for the parental magma to the LT lavas. Although it deserves further assessment, the genetic link between them can be established because this picrite and the least-contaminated LT sample have similar TirY,
Ž . Ž .
NbrLa and ´Nd t Table 4 . The similarity in trace
Ž .
element ratio and ´Nd t between the least-con-taminated HT1–HT2 lavas and high-TirY picrites
ŽTable 4 suggests that the high-Ti picrite may be.
parental magmas to the HT1 and HT2 lavas. This implies no simple fractionation relationship between the LT and HT lavas. It is therefore possible that HT and LT lavas may have evolved from respective Table 4
Comparison of selected trace element ratios and ´Nd between least-contaminated high-Ti picrites and basalts, and low-Ti picrites and basalts Ž . ´Nd t NbrLa TirY ZrrNb High-Ti picrite 4.0 1–1.1 505–610 8 High-Ti basalt 4.6–4.8 1–1.1 560–590 7.3–7.8 Low-Ti picrite 1.7 1.8 387 6.6 Low-Ti basalt 1.4 1.4 445 4.3
parental magmas. Other evidences for this argument
Ž .
include: 1 some HT2 lavas have significantly lower SiO content than the LT lavas at comparable Mga2 ŽFig. 5 ; 2 Field observation reveals that the LT. Ž .
and HT lavas are both temporally and spatially de-coupled. In the west part of the Emeishan LIP, the HT lavas generally overlay the LT lavas. No LT lavas have been documented in east part of province;
Ž .3 The least-contaminated LT and HT show
differ-Ž .
ent isotopic composition Table 4 . The HT3 lavas show compositional variation that is not coherent with other basalts from the Emeishan LIP. They could have been derived from another independent mantle source. It appears, therefore, that there was a variety of parental magmas for the Emeishan basalts. In the next section, melting conditions of dominant HT1, HT2 and LT lavas will be discussed.
5.3. Melting conditions and source characteristics 5.3.1. Major element constraints
In order to evaluate chemical signatures deriving from melt generation in continental LIPs, the effects of fractional crystallization on chemical composition must be removed first. Here we adopted the
ap-Ž .
proach proposed by Klein and Langmuir 1987 to extrapolate the evolved composition back to 8 wt.% MgO using best-fit linear regression. Using this
ap-Ž .
proach, Klein and Langmuir 1987 first identified the global trends of MORB and interpreted them in terms of parameters such as pressurertemperature and degree of partial melting. This approach has been widely applied to the CFB petrogenesis studies and yielded important information about melting
Ž
conditions and source characteristics Hergt et al., 1991; Turner and Hawkesworth, 1995; Garland et
.
al., 1996; Lassiter and Depaolo, 1997 .
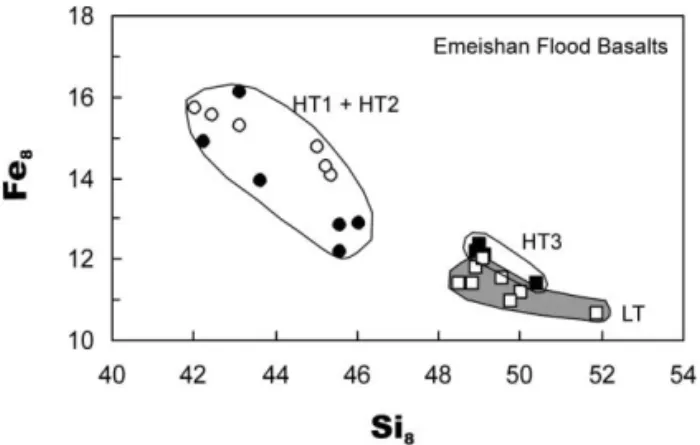
Correction of major element compositions of the Emeishan flood basalts at a constant MgO of 8% has been carried out using the best fitted linear lines for the HT1 and HT2, and LT magmas, respectively. All samples were used to calculate a regression line but only samples with ) 5% MgO were used. The HT and LT magmas define distinct positions in Fig. 8. The LT lavas have higher Si and lower Fe than the8 8
HT1 and HT2 lavas. Si8 abundance in primitive melts is negatively correlated with the pressure of
Fig. 8. Si versus Fe . Si8 8 8 and Fe are the calculated SiO and8 2
Fe O concentrations for a MgO content of 8%.2 3
Ž .
melt generation Garland et al., 1996 . Experimental data shows that Fe content in primitive magmas is strongly influenced by the pressure of melt genera-tion with Fe contents in melt being positively
corre-Ž .
lated with pressure Hirose and Kushiro, 1993 . Ac-cordingly, the HT1 and HT2 lavas may have been generated at a higher pressure than the LT basalts. However, different melting condition is not the unique interpretation for the compositional distinc-tion between the HT1–HT2 lavas and LT samples. Lithospheric mantle is likely to be more refractory on average than the underlying convective mantle. Thus, melt generation from refractory mantle source
Ž .
can lower Fe . The relatively high Fe8 8 12–16% suggests that the HT1 and HT2 lavas from Emeishan were mainly produced from fertile mantle with anomalously high potential temperature. In contrast, the LT and HT3 lavas may result from melting of a
Ž
depleted mantle source e.g., Turner and
Hawkes-.
worth, 1995 . Alternatively, the relatively low Fe8
content may be due to crustal contamination, because crustal contamination in general lowers the Fe con-8
Ž .
tents of a suite of lavas Peng et al., 1994 . The distinction between these alternatives is not straight-forward and will be addressed in next sections.
5.3.2. Constraint from REE composition
REE in basalts have been demonstrated to be very sensitive to the amounts of extension and
litho-Ž
spheric thickness McKenzie and O’Nions, 1991;
.
Ellam, 1992; Kerr, 1994 . Low CerYb ratios in basalts reflect melting regimes dominated by
rela-tively large melting fractions andror spinel as the
Ž .
predominant residual phase thin lithosphere , whereas high CerYb ratios correspond to smaller
Ž
melt fractions andror garnet control thick
litho-.
sphere . Following these reasoning, the variation of light REE enrichments observed in the Emeishan basalts can be explained by the change of litho-spheric thickness. The LT basalts were generated within spinel–garnet stability, at a depth less than 70 km. In contrast, the depth of melting for the HT
Ž
magmas is well within the garnet stability ) 80
.
km . This is qualitatively consistent with the evalua-tion in terms of major element composievalua-tion.
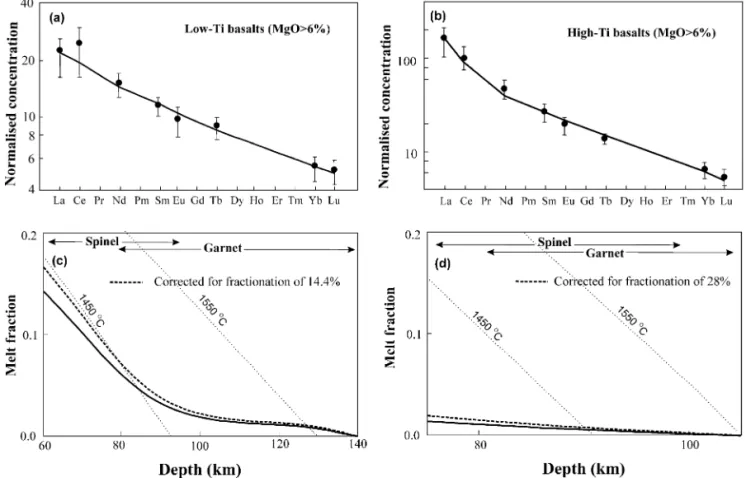
To quantitatively determine the melting condi-tions, we adopt the fractional melting inversion of
Ž .
McKenzie and O’Nions 1991 , incorporating the
Ž .
modification proposed by White et al. 1992 . The
inversion utilizes averaged REE concentrations to estimate the melt distribution as a function of depth, the total integrated melt fraction, and the total melt thickness, equivalent to the thickness of basaltic crust produced. Only samples with MgO ) 6 wt.% were used in REE inversion to minimize the effect of fractionation. Because all HT1 samples have MgO
- 6%, the HT2 lavas were consequently used in
REE inversion for the HT magma type. For the LT magma type, the samples with high SmrYb may have been affected by lithospheric contamination, thus only those with low SmrYb were used. The inversions were run assuming that the garnet–spinel transition occurs between 80 and 100 km, equivalent to a mantle potential temperature of 1500 8C. The source producing the best fit of the LT basalts is MORB mantle source enriched by small melt
frac-Ž .
Fig. 9. a,b Observed and calculated rare-earth element concentrations, normalized to bulk earth for the Emeishan LT and HT basalts with MgO ) 6 wt.%. Mean values for each element are shown by dots. Vertical bars illustrate one standard deviation, estimated from the
Ž .
variance of the data. The heavy line shows the best fit to the data obtained by fractional melting inversion. c,d Melt distribution for the Emeishan basalts estimated from REE inversion. Thin dashed line with labeled temperatures is the predicted melt distribution from
Ž .
tion derived from a depleted mantle. The HT2 lavas
Ž .
show positive ´Nd t suggesting that they were
pri-marily generated within the asthenosphere and was then modeled by simple one-stage melting of mantle. Fig. 9a shows the comparison between observed mean concentration for the LT basalts from the Emeishan LIP, and the best fit to the data obtained by inversion. The fit is rather good for all REE, well within the error bars. Fig. 9c shows the melt distribu-tion required to produce this fit, with dashed line illustrating the inferred original melt distribution af-ter correction for 14.4% fractionation. The compari-son between the melt distributions inferred from the LT lavas and the predicted one from isentropic de-compression of mantle indicates a mantle potential temperature of ) 1550 8C. The melt distributions also show melting starting at a depth of 140 km. The upper limit of melting in the inversion is 60 km, typical of basalts generated beneath stretched and thinned continental lithosphere. The maximum melt fraction estimated from inversion is of about 16% and the total melt thickness after fractionation cor-rection is nearly 5 km. The estimated thickness is significantly greater than the observed thickness of
Ž .
the LT lavas presumably ; 3 km . Neither erosion nor lateral flow can account for this discrepancy. Melt may have been trapped around the Moho or in the lowermost part of crust, as suggested by the high seismic velocity layer below the Moho in this region
ŽYuan, 1989 . In contrast, the maximum melt frac-.
tion estimated from inversion of the HT lavas is
Ž .
significantly low 1.5%, Fig. 9d and the total melt thickness after fractionation correction is only 500 m. The melting starts at ; 100 km and the upper limit of melting in the inversion is 75 km. These results suggest that the HT lavas were generated at a higher depth by a smaller degree of partial melting from mantle than the LT lavas. The potential temper-ature of the mantle involved in melt generation of
Ž .
the HT lavas is also relatively lower - 1500 8C compared to that for the LT lavas. Therefore, any transition from the LT to HT lavas is believed to be associated with change in melting conditions.
5.4. Plume signature in the Emeishan basalts
A starting plume model has been put forward for the generation of the Emeishan basalts by Chung et
Ž . Ž .
al. 1998 mainly based on two arguments. 1 The immense volume of magma produced in a rather short time span requires a large thermal anomaly
Ž . Ž .
within the mantle. 2 Forsterite Fo contents in olivine phenocrysts in picrites vary from 83 to 89
ŽXu and Chung, 2001 . This indicates various.
amounts of accumulated olivines in the Emeishan picrites and primary magmas have MgO of 14–16%. The presence of high magnesian lavas suggests a
Ž
mantle hotter than the ambient mantle McKenzie
.
and Bickle, 1988; Campbell and Griffiths, 1990 .
Ž .
The high potential temperature ) 1550 8C is also revealed by the REE inversion results presented in this study. Here, we reinforce the plume model by providing the compositional evidence, which is not
Ž
equivocal for some important CFBs e.g., Parana,
.
Peate, 1997; Karoo, Ellam and Cox, 1991 .
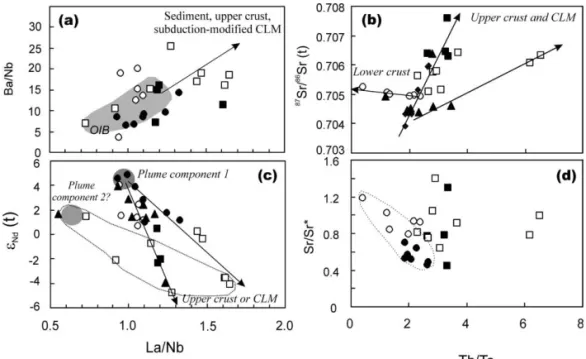
Most HT1 and HT2 samples exhibit the trace element ratios that overlap with the field of oceanic
Ž . Ž .
island basalts OIB Fig. 10a . They show smooth trace element patterns that are very similar to OIB except for weak Nb anomaly in some samples. The pronounced negative Sr anomaly in HT1 lavas sug-gests that they have been affected by extensive frac-tionation of plagioclase. Samples with low trace
Ž .
element abundance e.g., EM-42, EM-48 also
Ž . Ž . 87 86 Ž .
show high ´Nd t 4.6–4.8 and low Srr Sr t
Ž0.7042–0.7046. values, thus likely reflecting the isotopic signature of the least-contaminated Emeis-han plume head. A similar Sr–Nd isotopic composi-tion of the plume head has also been proposed on the basis of analyses of the high-TirY picritic lavas
ŽChung and Jahn, 1995 . This indicates a depleted.
mantle source for the HT1 and HT2 lavas, consistent with the relative depletion of Rb and Ba compared
Ž .
with Th, Ta and La in the HT1 samples Fig. 6a . As
Ž .
was shown by Hofmann 1988 , the Ahump-shapeB in the trace element pattern is a source feature and can be explained by remelting of source that had been depleted in highly incompatible elements through earlier melt extraction.
Although isotopic composition of most LT lavas can be accounted for by contamination of this same
w Ž . 87 86 Ž .
plume component ´Nd t ; q5 and Srr Sr t
x Ž
; 0.704 by upper crust or CLM continental litho-.
spheric mantle components, several lines of evi-dence suggest the possible involvement of another plume component in the generation of the LT lavas.
Ž . Ž .87 86 Ž . Ž . Ž . Ž . )
Fig. 10. a BarNb vs. LarNb; b Srr Sr t vs. ThrTa; c ´Nd t vs. LarNb and d Sr rSrN N vs. ThrTa diagrams for the Emeishan
)
Ž . Ž .
flood basalts. Sr s Ce q NdN N Nr2. N stands for chondrite normalization. The field of OIB is after Weaver 1991 and Sun and
Ž .
McDonough 1989 .
Ž .
The least-contaminated LT lava EM-41 shows a smooth trace element pattern and OIB-like trace
Ž .
element ratios. Its ´Nd t value of 1.4 is also the highest among the LT lavas. Similar isotopic
compo-Ž . w
sition is observed in low-TirY picrite EM-43 e.g.,
Ž . x
´Nd t s 1.7 . It should be noted that the isotopic
composition of these least-contaminated LT lavas is different from that identified on the basis of
geo-Ž .
chemistry of HT lavas Table 4 . Moreover, Fig. 10c shows that a component with composition similar to that of EM-41 is required to account for the geo-chemical variation of a number of LT samples. Despite the limited data, we propose that the least-contaminated LT magmas probably originated from a mantle source region distinct from that for the HT lavas. Whether this second source is related to the heterogeneity of the Emeishan plume or entrainment of anAexoticB component in the plume head remains to be clarified.
5.5. Lithospheric signature: CLM or crustal contam-ination?
Some LT and HT lavas show negative Nb anomaly suggesting that components other than plume must
have been involved in generation and evolution of the Emeishan basalts. The most likely components are from lithosphere. There is still a hot debate about the way by which the lithosphere contributes to magma generation. Either contamination of plume
Ž
magmas by lithosphere-derived melts Arndt et al.,
.
1993 or whole-scale melting of the subcontinental
Ž
lithospheric mantle CLM, Gallagher and
Hawkes-.
worth, 1992 has been proposed.
As discussed previously, the HT1 and HT2 basalts have undergone the gabbroic fractionation. This pro-cess should buffer SiO with decreasing MgO con-2
Ž .
tents Cox, 1980 . The increasing SiO contents with2
decreasing MgO for both LT and HT lavas are suggestive of input of high Si crustal materials. An
87 86
Ž . Ž .
increase in Srr Sr t and decrease in ´Nd t with
Ž .
increasing SiO for the HT1 samples Fig. 11 indi-2
Ž
cate an AFC assimilation and fractional
crystalliza-.
tion, DePaolo, 1981 style of contamination. The presence of plagioclase phenocrysts in the HT sam-ples suggests that the fractionation took place at
Ž .
pressure less than 10 kbar Stolper, 1980 . Most HT lavas thus may have experienced plagioclase frac-tionation in a crustal magma chamber. This
pre-Ž . 87 86 Ž . Ž .
Fig. 11. Plots of NbrLa, ´Nd t and Srr Sr t against SiO2 and Mga. The trends defined by the HT1 lavas shaded areas are consistent with the AFC style of contamination.
cludes the possibility of lamproitic melts derived from enriched CLM as a contaminant of the HT1
Ž .
and HT2 lavas e.g., Ellam and Cox, 1991 .
HT2 and HT1 lavas may share a similar plume source because the least-contaminated lavas show similar isotopic composition. However, in Figs. 10 and 11, the HT2 basalts forms a distinct trend sug-gesting a different magma plumbing system from the HT1 basalts. These lavas contain abundant plagio-clase phenocrysts. The negative Eu anomaly suggests that they are not plagioclase-rich cumulates, but may have experienced some degree of plagioclase frac-tionation. It is noted that the diagnostic of
plagio-Ž
clase fractionation in the HT2 lavas negative Eu
.
anomaly, no obvious Sr anomaly is different from
Ž
that in the HT1 samples pronounced negative Sr
.
anomaly and no Eu anomaly . Although this discrep-ancy can be accounted for in terms of different oxygen fugacity, it is likely that the HT2 lavas contain a component derived from plagioclase-rich gabbros. This suggestion is supported by negative
Ž .
U–Th anomalies Fig. 6 . Similar U–Th depletion has been documented in Hawaii shield lavas and has been interpreted as evidence for recycled plagio-clase-rich oceanic gabbros in the magma sources
ŽHofmann and Jochum, 1996 . Layered gabbro intru-.
sions are widespread in the Emeishan LIP. Prelimi-nary analyses do reveal characteristic Th deficiency
Ž
relative to Ba and La in these gabbros Chung et al.,
.
unpublished data . We therefore interpret the HT2 lavas as mixtures involving plume-derived magmas and melts derived from gabbros. A possible scenario
is that the plume-derived magmas rose through the crust–mantle boundary and induced the melting of the gabbros that emplaced at a previous time. Mixing with melts derived from gabbros is expected to mitigate the strong Sr depletion in the original HT2 magmas and result in strong Th depletion. This is consistent with the negative correlation between
) w )
Ž . x
ThrTa and Sr rSr Sr s Ce q Nd r2 for
N N N N N
Ž .
the HT2 and HT1 lavas Fig. 10d . For instance, the positive Sr anomaly is observed in the sample with
Ž .
the lowest Th content i.e., EM-81 .
AFC trend is less evident for the LT samples. This has been taken as evidence by many authors against crustal contamination being the primary con-trol on isotopic variation in CFBs. The chemical and isotopic composition of the LT samples may inherit that of the CLM. However, the thickness of the LT lavas in the Emeishan LIP is more than 3000 m. These lavas were emplaced during a relatively short
Ž
time span Chung et al., 1998; Huang and Opdyke,
.
1998 . It is thus difficult to imagine that such a large volume magma was generated by melting of litho-spheric mantle which is stable for a long time period in a nonconvective state. The thermomechanic model suggests that only a small amount of melts can be produced from the lithospheric mantle by conduction
Ž
of heat from mantle plume McKenzie and Bickle,
.
1988; Arndt and Christensen, 1992 . The generation of the large amount of CFB is likely confined to the convective asthenosphere or plume. It has been ar-gued that the melting temperature of the lithosphere may be considerably reduced by the presence of volatile phases and melting of hydrous CLM would
Ž
be more readily than the volatile-free plume
Gal-.
lagher and Hawkesworth, 1992 . If this model ap-plies to the Emeishan LIP, the LT lavas should be hydrous. However, primary biotites are only found in
Ž .
some HT2 lavas but not in the LT samples Table 1 . While one can argue that the presence or absence of hydrous phases is also dependent on temperature of basaltic lavas, the OIB-like signature in some least-contaminated LT lavas strongly suggests that the parental magma of the LT lavas was derived from the convective mantle. The geochemical variation of the LT lavas can therefore be accounted for by mixing between the plume and lithospheric compo-nents. There are many reasons to account for the scattered contamination trajectories of the LT
sam-Ž .
ples. 1 It has been shown that plagioclase crystal-lization, or its absence, has a distinctive impact on
Ž .
AFC trajectories DePaolo, 1981 . The plagioclase fractionation has played an important role in the evolution of the HT lavas, but not in the LT lavas.
Ž .2 The LT samples come from a wide range of stratigraphic positions and are unlikely to represent the products of a single magmatic plumbing system.
Ž .3 The lithosphere crust q CLM in the westernŽ .
Yangtze cration is extremely heterogeneous. The scattered data of LT samples in Fig. 11 may reflect the combined effect of the contamination by the upper crust and by components derived from the
Ž .
heterogeneous CLM Fig. 10c .
The chemical variation of the Emeishan basalts cannot be reconciled with contamination of a com-mon magma, given the incoherent chemical variation between LT and HT lavas in Fig. 11. This again requires various parental magmas. Moreover, the
87 86
Ž . Ž .
high Srr Sr t and low ´Nd t in less fractionated
Ž .
samples Fig. 11 is not consistent with a simple AFC process within a magma chamber. This instead reflects a temperature-controlled style of contamina-tion where hot high-MgO basalts rapidly assimilate crustal rocks without fractionating substantially
ŽHuppert and Sparks, 1985 . It is likely that the LT.
magmas experienced two stages of contamination: the LT lavas assimilated crustal materials during ascent through conduits, and then have undergone an AFC style of contamination within a magma cham-ber prior to eruption.
Contamination appears to have played a more important role in the LT lavas than in the HT lavas. Because the LT lavas are overlain by the HT lavas, it can be inferred that contamination of plume-derived
Ž .
magma decreases with time also see Fig. 12 . This could result from the decreasing assimilation of the wall-rock in conduit systems over time as successive eruptions gradually depleted available contamination material. The earlier magmas would be the most contaminated owing to disruption and erosion of wall-rock during formation of the magmatic cham-ber. As these were erupted and the conduits are coated by replenished fresh magmas, the degree of contamination tends to decrease with time. This is the scenario likely happened in the Emeishan LIP, because the least-contaminated LT lavas are located
Ž .
Ž .
Fig. 12. Variation in TirY, ´Nd t and SmrYb in the Emeishan basalts with stratigraphic height.
evolved rhyolites at the top of lava section typically
Ž . Ž
have high ´Nd t ) 2, Chung et al., unpublished .
data .
6. Remarks on temporal and spatial relationships between the HT and LT lavas
The temporal and spatial relationship between the LT and HT lavas in the Emeishan LIP is necessary
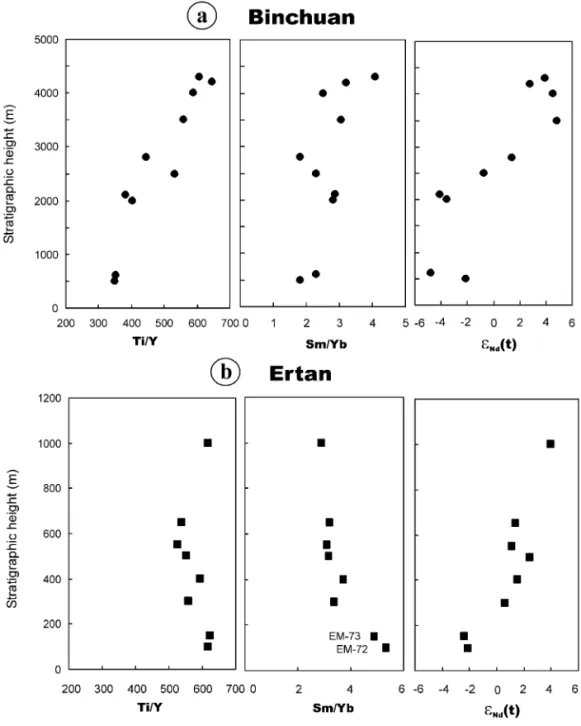
to address, because it is critically important in under-standing the thermal structure of the Emeishan plume and the nature of the plume–lithosphere interaction. Fig. 12 illustrates some general stratigraphic varia-tions for several key geochemical parameters in Binchuan and Ertan. At Binchuan, TirY, SmrYb
Ž .
and ´Nd t increase with increasing stratigraphic height. The lavas from the lower sequence show more lithospheric signature, whereas the samples
from the upper sequence display more astheno-spheric affinity. This temporal shift from lithoastheno-spheric to asthenosphere signature has been documented in
Ž .
many CFBs White and McKenzie, 1995 and is
Ž
commonly attributed to the variation in source e.g.,
.
Garland et al., 1996; Lassiter and Depaolo, 1997 . As shown in the Siberian traps and many other CFBs, the CLM component is commonly encoun-tered in those early erupted voluminously
insignifi-Ž
cant alkali basalts see review of Lassiter and
De-.
paolo, 1997 . However, in the Emeishan LIP, the volume of the LT lavas with lithospheric signature is much greater than that of the HT lavas that are dominated by plume signature. As such, lithospheric signature observed in the Emeishan basalts may be derived from crust andror CLM contamination rather than source characteristics.
The increase in SmrYb with increasing strati-graphic height at Binchuan is the reverse of that observed in other CFBs where SmrYb in basalts
Ž
decreases with time e.g., Wooden et al., 1993; Kerr,
.
1994 . As summarized by Lassiter and Depaolo
Ž1997 , the temporal increase in melt fraction and.
decrease in depth of melting is a common feature of many CFBs, and is expected if melt generation is due to the interaction of a mantle plume with
thin-Ž .
ning lithosphere White and McKenzie, 1995 . The discrepancy between the temporal chemical variation in Emeishan LIP and other CFBs may be due to the lack of systematic sampling, especially of the early phase of volcanism. The recent investigation of lava flows in the Maymecha River basin in the Siberian
Ž .
trap Arndt et al., 1998 sheds light on this problem. The lower part of sequence in the Maymecha River basin shows a transition from volumetrically small alkaline basalts to dominant, monotonous tholeiitic basalts, corresponding to that found in the classic Noril’sk section. The tholeiitic basalt is succeeded by compositionally diverse rocks including trachybasalt,
Ž
nephelinite, picrite and meymechite Arndt et al.,
.
1998 . It is interesting to note that the lithological and chemical variations in the upper part of the Maymecha River section are strikingly similar to what observed at Binchuan. Moreover, two mantle sources and two plumbing systems are suggested by
Ž .
Arndt et al. 1998 to account for the compositional distinction between tholeiitic and alkaline suites from the Maymecha River basin. Similar petrogenesis can
be applied to the HT and LT lavas in the Emeishan
Ž .
LIP see above . Compared to the stratigraphic varia-tion for lavas of the Maymecha River basin, it is likely that the Binchuan section represents the mid-dle to upper part of the entire lava succession of the Emeishan LIP. The geodynamic process associated with the variation from the LT to HT lavas could be related to the transition from the peak to the waning stage of the mantle plume activity.
Ertan is located about 400 km northeast to
Ž . Ž .
Binchuan Fig. 1 . ´Nd t values of the Ertan lavas
show a stratigraphic variation roughly similar to that observed at Binchuan, other two parameters do not
Ž .
show coherent variations Fig. 12b . The relatively high SmrYb ratio is confined to the HT3 samples that may have a CLM origin. There is no overlap in composition in the Ertan and Binchuan sections. The Binchuan section contains HT1 and LT lavas, whereas the Ertan section contains HT2 and HT3
Ž .
lavas Fig. 2 . This may reflect the spatial variation of the Emeishan flood basalts. To further east, the
Ž .
lavas in eastern Yunnan EM-1, EM-3 and Guizhou province are all HT1 lavas and no LT type has been
Ž
documented Huang, 1986; Zhang et al., 1988; Xu et
.
al., in preparation . The Emeishan LIP displays a spatial chemical variation, with the dominant LT lavas in the western province and the HT lavas in the eastern province. As shown previously, the least-con-taminated HT and LT lavas have different REE composition and may reflect different melting depth. The spatial variation between them may reflect a variable lithospheric thickness beneath the Emeishan province and mantle potential temperature during the Permian–Triassic Period.
Given the presence of picritic lavas and thickest
Ž .
preserved lava succession ) 5000 m in the western province, the plume center was likely in the western
Ž .
province Chung et al., 1998 . In this axial area of the plume, the mantle temperature was high enough
Ž
to initiate melting at relatively great depth garnet
. Ž
stability and continue to the shallow level spinel
.
stability . The melts derived from such a large de-gree of melting of mantle peridotites in the absence
Ž
of garnet evolved to form the LT basalts low REE
.
abundance and low SmrYb ratio . Due to upward heat transfer from the mantle, the overlying continen-tal crust was incubated so that it became warmer and favorable for being assimilated into the magma
chambers. This assimilation accounts for the litho-spheric signature observed in most LT lavas. In
Ž
contrast, in the periphery of the LIP i.e., Guizhou
.
Province , the lithospheric thickness was greater and the geotherm was lower than those underneath the axial area. This eventually led the melting column to have confined within the garnet stability field and a relatively low degree of melting. The low degree
Ž .
melts with garnet residue in the source evolved during ascent to form the HT basalts of high SmrYb ratios. Due to the relatively cooler geothermal struc-ture in the lithosphere, the magmas may have arisen more rapidly without pronounced assimilation by crustal materials.
7. Conclusions
Ž .1 Based on geochemical variation, the Emeishan LIP lavas can be classified into two major magma
Ž .
types i.e., LT and HT . The HT lavas can be further
Ž .
divided into three subtypes HT1, HT2 and HT3 .
Ž
The LT lavas display relatively high Mga 0.51–
.
0.63 , low REE concentrations, depletions in Nb and
Ž .
Ta and low ´Nd t values. In contrast, the HT
mag-mas show a more evolved nature, with lower Mga
Ž0.45–0.3 and higher incompatible element abun-.
dance. The variation in major element compositions of the LT and HT3 lavas is ascribed to ol q cpx fractionation in a deep level. In contrast, gabbroic fractionation in a shallow level accounts for the chemical variation of the HT1 and HT2 lavas. How-ever, the chemical variation of HT and LT lavas cannot be described as simple crystal fractionation from a common parental magma. We propose that the parental magmas of the LT lavas were produced
Ž .
by a larger degree 16% of partial melting of mantle
Ž
plume at shallower depth depth to top of melting
. Ž
column - 60 km than those of the HT lavas 1.5%,
. ) 75 km .
Ž .2 The correlation between Sr–Nd isotopic and certain trace element ratios provide evidence for the involvement of various mantle and crustal compo-nents in the petrogenesis of the Emeishan flood basalts. Two distinct mantle components may have been involved in generation of the LT and HT1–HT2 lavas; the HT1 and HT2 basalts originated most
Ž87 86 Ž .
likely from an OIB-like mantle source Srr Sr t
Ž . .
f0.704, ´Nd t f q5 , a slightly enriched mantle
Ž87 86 Ž . Ž . .
component Srr Sr t f 0.705, ´Nd t f q2 is
required for the LT lavas. Different crustal plumbing systems may have operated in the compositional evolution of these magma types. The HT1 lavas have experienced an AFC style of contamination in the upper crust. The HT2 lavas may have been contami-nated by melts derived from a gabbroic layer that was ponded near the crust–mantle boundary, result-ing in the U–Th depletion in the basalts. In contrast, a temperature-controlled style of contamination was associated with the LT lavas. Both CLM and the upper crust may have participated in the contamina-tion process. Origin of the HT3 lavas is less well constrained due to the limited number of samples. This magma type may have a petrogenesis com-pletely different from those for the LT lavas and other HT magma types, and thus deserves further investigation.
Ž .3 The available data provide some preliminary constraints on the temporal and spatial variation of the Emeishan flood basalts. The LT lavas are largely confined to the lower sequence of volcanic succes-sions in the western part of the Emeishan LIP. This magma type represents the main phase of the volcan-ism, and is overlain by the HT lavas. To the east in the Guizhou Province of the LIP’s margin, the lavas consist uniformly of the HT1 magma type. This
Ž
temporal variation in the basalt chemistry i.e., from
.
LT to HT indicates not only a deepening of the melting column, but also the transition from the peak to the waning stage of the mantle plume activity. This transition is apparently the reverse of that ob-served in other major CFBs but is similar to the chemostratigraphic variation observed in the Parana
Ž .
flood basalts Peate et al., 1990 and in the Maymecha River basin in the Siberian flood volcanic province
ŽArndt et al., 1998 . We suggest that the currently.
available samples were mainly from the middle to upper part of the entire lava succession of the Emeis-han LIP. Systematic sampling of the early phases of volcanism is urgently needed. The spatial variation in rock type, on the other hand, is likely controlled by the difference of lithospheric thickness and man-tle geothermal structure. Consequently, the LT lavas were generated probably in the plume axis region where the geotherm was higher and the lithosphere was thinner. In contrast, the HT lavas resulted from