J. Mass. Spectrom. 33, 644È652 (1998)
Structural Analysis of Chromophore-labeled
Disaccharides and Oligosaccharides by
Electrospray Ionization Mass Spectrometry and
High-performance Liquid
Chromatography/Electrospray Ionization Mass
Spectrometry
D. T. Li and G. R. Her*
Department of Chemistry, National Taiwan University, Taipei, Taiwan
Disaccharides and linear oligosaccharides were labeled with p-aminobenzoic ethyl ester (ABEE) chromophore and analyzed by negative ion electrospray ionization mass spectrometry (ESIMS). The formation of glycosylamines rather than reductive amination in the labeling reaction produced many characteristic fragment ions under in-source collision-induced dissociation (CID). These ions provided unambiguous assignment of the position of the glycosidic linkages. This approach was extended to the analysis of linkages and the sequence of the linkages of several linear oligosaccharides. Additionally, the anomeric conÐguration of ABEE-labeled 1–3-, 1–4- and 1–6-linked glucose disaccharides could be di†erentiated according to the relative abundance of characteristic ions. Disaccharides with the same linkage but di†erent monosaccharide compositions could be analyzed by on-line coupling of high-performance liquid chromatography with ESIMS.(1998 John Wiley & Sons, Ltd.
KEYWORDS : disaccharides ; chromophore ; linkage ; anomeric conÐguration ; high-performance liquid chromatography/electrospray ionization mass spectrometry
INTRODUCTION
A considerable part of the biological functions of glyco-proteins and glycolipids depends on their carbohydrate moiety ; for example, cell-to-cell interactions, di†erentia-tion of cells and metastasis are associated with the structure of oligosaccharides present on the cell surface. The structural elucidation of complex carbohydrates requires the determination of the sugar sequence, sugar branching, monosaccharide composition, interglycosidic linkages and anomeric conÐguration. The most common method in linkage analysis is the per-methylation procedure, where the saccharide is methyl-ated at the free hydroxyl groups, total hydrolysis to monosaccharides is brought about, the carbonyl groups are reduced and Ðnally the hydroxyl groups liberated are derivatized. The mixture obtained is usually analyzed by gas chromatography/mass spectrometry (GC/MS).1 This well standardized technique is, in
* Correspondence to : G. R. Her, Department of Chemistry, Nation-al Taiwan University, Taipei, Taiwan
e-mail : grher=mail.ch.ntu.edu.tw
Contract/grant sponsor : National Research Council of the Republic of China.
general, time-consuming, labor extensive and requires larger sample amounts.
Mass spectrometric techniques, especially the com-bination of soft ionization methods such as fast atom bombardment (FAB) with collision-induced dissociation (CID), have been used for linkage determination of underivatized oligosaccharides.2h9 Electrospray ioniza-tion mass spectrometry (ESI-MS) is another technique which has been reported to allow structural analysis of underivatized oligosaccharide. Garozzo et al.10 used negative-ion ESI-MS and in-source fragmentation to di†erentiate the linkage position of reducing disaccha-rides. Traeger and co-workers11 extended the study of Garozzo et al. to anomeric isomer analysis using selec-ted diagnostic peaks and their relative intensities. Fura and Leary12 used ESI-MS/MS to investigate the branching of Ca2`- and Mg2`-coordinated branched trisaccharides. From the CID spectrum of the intact cationized species, the branching point located on the reducing moiety of an oligosaccharide could be deter-mined.
High-performance liquid chromatography (HPLC) has been a fundamental technique for the separation and recovery for oligosaccharides.13 It has been recog-nized that MS may be used as a universal and sensitive detector for HPLC. On-line HPLC/MS and HPLC/ MS/MS have been implemented and shown great potential for the analysis of underivatized
formation of glycosylamine in labeling reactions has demonstrated its great potential in HPLC separations and in linkage analysis.22 Unlike in reductive amina-tion, reducing sugars maintained a closed ring structure in the glycosylamine approach. Based on our previous study,22 closed-ring derivatives (glycosylamines) provid-ed much more linkage information than open-ring pro-ducts under FAB/CID conditions. In this study, disaccharides and linear oligosaccharides were deriva-tized using the glycosylamine approach and were studied by ESI-MS and HPLC/ESI-MS. The merits of this approach are discussed.
EXPERIMENTAL Chemicals
Table 1 lists the sugars analyzed in this study. Panose, sophorose and lactose were purchased from Tokyo Kasei (Tokyo Japan), Serva (Heidelberg, Germany) and Aldrich Chemical (Milwaukee, WI, USA), respectively. All other sugars were obtained from Sigma Chemical (St Louis, MO, USA). p-Aminobenzoic acid ethyl ester was purchased from Aldrich Chemical.
Preparation of chromophore-labeled oligosaccharides Closed-ring (glycosylamine) derivatives were prepared. The procedure of Reinhold and co-workers16 was
Table 1. List of sugars analyzed Sophorose Glcb1–2Glc Nigerose Glca1–3Glc Laminaribiose Glcb1–3Glc Mana1–3Man Maltose Glca1–4Glc Cellobiose Glcb1–4Glc Gala1–4Gal Galb1–4Man Isomaltose Glca1–6Glc Gentiobiose Glcb1–6Glc Melibiose Gala1–6Glc Maltotriose Glcaa–4Glca1–4Glc Isomaltotriose Glca1–6Glca1–6Glc Panose Glca1–6Glca1–4Glc Maltopentaose Glca1–(4Glca1) 3–4Glc
Linear (Reno, NV, USA) UVIS 200 variable-wavelength detector. A Spherisorb 3-NH column (25 cm] 2 mm
2
i.d.) was used for the separation of the chromophore-labeled disaccharide mixture. The Ñow rate on-column was 300 ll min~1 and this Ñow was split post-column. A splitting ratio of 1 : 1 delivered 150 ll min~1 into the electrospray ionization source. Before the mobile phase Ñowed into the ionization source, 2-propanolÈwater (1 : 1) containing 0.5% ammonia was added at a Ñow rate of 20 ll min~1 to increase the negative ion ESI sensitivity. Negative ion ESI mass spectra were col-lected on a Fisons Platform mass spectrometer (VG Bio Tech, Altrincham, UK). The potential of the capillary was set to 2.5 kV and the counter electrode was held at 0 V. The ion source temperature was set to 90 ¡C. In-source CID mass spectra were acquired with the cone voltage set to a speciÐed value. A mass range between m/z 150 and 550 was scanned and the scan time was set to 2 s. The absorbance at 254 nm was monitored as the remaining 150 ll min~1 eluent Ñowed through a UV cell. The amounts of sample used in HPLC/MS and CID analysis were D10 and 1 nmol, respectively. The analytical conditions for the separation are given in the Ðgure captions.
RESULTS AND DISCUSSION
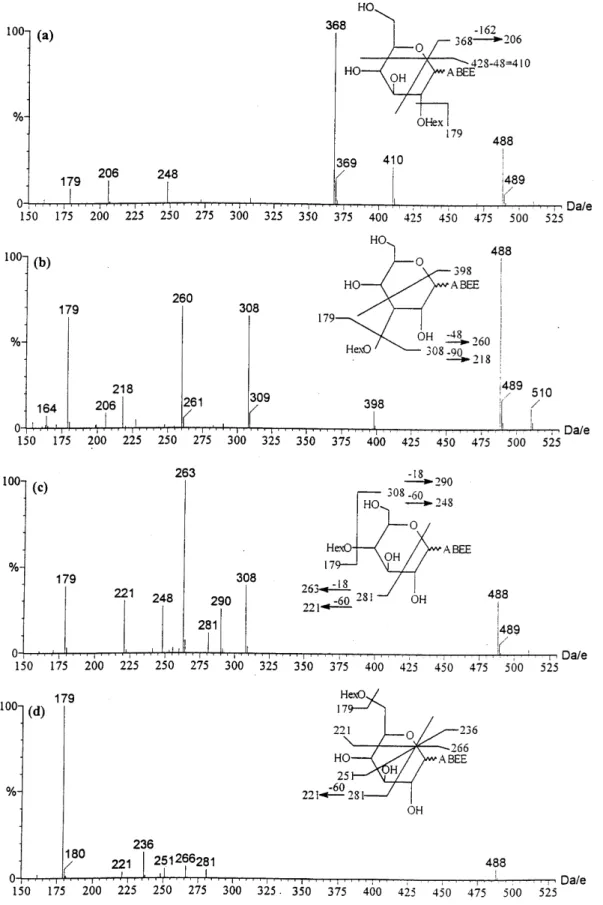
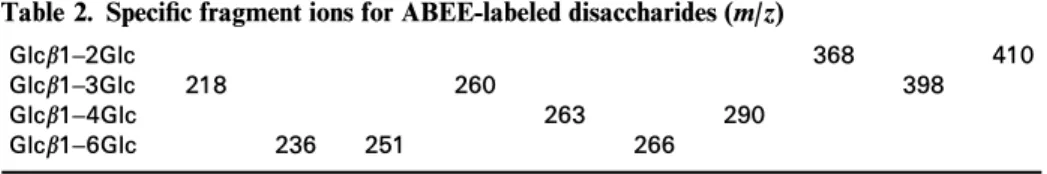
Linkage analysis of di- and linear oligosaccharides Disaccharides with di†erent linkages were derivatized with ABEE and then studied by ESI-MS. Under in-source CID condition, many fragment ions were observed. The most prominent fragments in the positive-ion mode mass spectra resulted from the cleav-age of the glycosidic bond, which made the mass spectra very similar and therefore not useful for the di†erentia-tion of linkages (data not shown). Unlike positive-ion spectra, the negative-ion mode yielded many character-istic fragment ions (Fig. 1). These fragments appeared to be cross-ring cleavage ions on reducing end monosac-charides. Disaccharide isomers can be seen as a mono-saccharide with another monosaccharide as the substituent at di†erent positions, and therefore cross-ring cleavage of the reducing monosaccharide is very helpful for the di†erentiation of these isomers (Fig. 1). The characteristic fragment ions are listed in Table 2. Since the only di†erence among the four disaccharides resided in the glycosidic linkage, the di†erence observed
Figure 1. Negative-ion in-source CID ESI mass spectra of ABEE-labeled (a) sophorose, (b) laminaribiose, (c) cellobiose and (d) gentio-biose.
in the negative-ion ESI mass spectra could be used to establish the linkage position in disaccharides. The FAB technique in combination with high-energy CID has been reported for the linkage determination of ABBE labeled disaccharides.22 Although the di†erence in
colli-sion energies was signiÐcant, the ESI mass spectra recorded at 30 V were in general similar to the FAB/ high-energy CID product ion spectra. A notable di†er-ence was the m/z 281 ion in b-1È4- and b-1È6-linked disaccharides. Except at a lower cone voltage, the
important factor in the selection of labeling reagents. In recent years, attempts have been made not only to achieve sensitive UV or Ñuorescence detection but also improve the ionization efficiency in ESI analysis by labeling oligosaccharides with chromophores of high proton affinity or preformed ions.23h26 The reportedly
able from the ESI mass spectra.
Several derivatives including PA (2-pyridinamine), ABEE and ABBE (p-aminobenzoic acid butyl ester) were labeled with glycosylamine and studied by negative-ion ESI. ABEE and ABBE had similar sensiti-vities which were D5È10 times more sensitive than
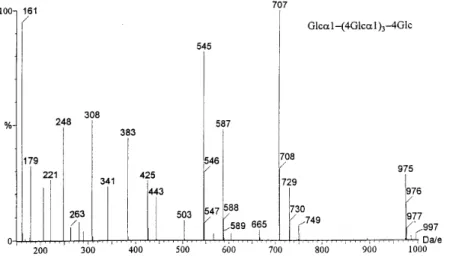
Figure 3. Negative-ion in-source CID ESI mass spectra of ABEE-labeled maltopentaose.
underivatized disaccharides. The resolution of PA sugar was not as good as that of ABEE or ABBE. ABEE was chosen instead of ABBE in this study mainly because it provided better results on anomeric conÐguration for some disaccharides.
The linkage of disaccharides without precolumn deri-vatization could also be determined from the ESI mass spectrum.10,11 However, because of the lack of reducing end fragments, it is often not possible to analyze mix-tures with more than one linkage by direct infusion analysis. For example, the characteristic ions for 1È2-, 1È3- and 1È4-linked disaccharides are at m/z 221, 263, 323 ; 221, 281 ; and 221, 263, 281, respectively ;11 the observation of m/z 221, 263, 281 and 323 ions might represent one of the following three possible com-binations : 1È2] 1È4, 1È2 ] 1È3 and 1È2 ] 1È3 ] 1È4. In contrast, every linkage-isomeric disaccharide had its speciÐc ions (Table 2) in this approach, and therefore
linkage positions in a mixture containing more than one linkage could be unambiguously assigned by direct infu-sion analysis.
The study of several 1È4- and 1È6-linked linear oligo-saccharides suggested that with the cone voltage set at a higher value, this approach could be extended to the analysis of linear oligosaccharides. The in-source CID mass spectra of trisaccharides with the cone voltage set to 40 V are shown in Fig. 2. The m/z 263 ion in Fig. 2(a) indicates that the non-reducing end is a 1È4-linkage ; the ion at m/z 425 (162 u above the m/z 263 ion) and reducing end fragments at m/z 308 and 290 and suggest that the reducing end is also a 1È4-linkage. In Fig. 2(b), the presence of the m/z 251 ion indicates that the non-reducing end is a 1È6-linkage ; the peak at m/z 413 (162 amu above the peak at m/z 251) and non-reducing end fragment at m/z 236 suggest that the reducing end linkage is also a 1È6-linkage. In Fig. 2(c), the presence of
Figure 4. Skimmer cone voltagevs. ion ratio ofm/z 221/248 in ABEE-labeled Glca1–4Glc and Glcb1–4Glc. Error bars represent three standard deviations (3s).
Figure 5. Skimmer cone voltagevs. ion ratio ofm/z 236/221 in ABEE-labeled Glca1–6Glc and Glcb1–6Glc. Error bars represent three standard deviations (3s).
the ion at m/z 251 suggests a 1È6-linkage in the non-reducing end and the peaks at m/z 425, 308 and 290 indicate that the reducing end is a 1È4-linkage. This method was applicable to higher oligomers. The negative-ion ESI mass spectrum of ABEE-labeled mal-topentaose with the cone voltage set to 75 V is shown in Fig. 3. The observation of 1È4-linked diagnostic ions at m/z 263, 425, 587 and 749 and reducing end fragments at m/z 308 and 290 suggested that the Ðve linkages in maltopentaose were all 1È4-linkages.
Analysis of anomeric conÐguration
The determination of anomeric conÐguration by a com-bination of chemical and MS methods has been report-ed by Khoo and Dell.27 The determination of anomeric conÐguration by MS directly is limited, however, mainly because stereoisomers often give very similar mass spectra. Recently, Traeger and co-workers11 di†er-entiated anomeric conÐgurations by the relative
abun-Figure 6. Skimmer cone voltagevs. ion ratio ofm/z 179/260 in ABEE-labeled Glca1–3Glc and Glcb1–3Glc. Error bars represent three standard deviations (3s).
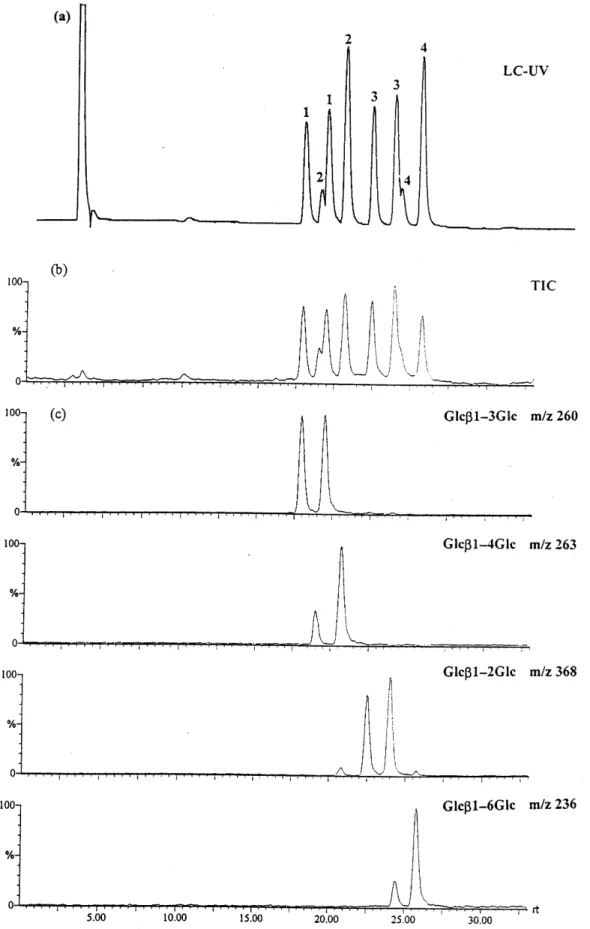
Figure 7. (a) UV, (b) TIC and (c) reconstructed ion chromatograms of four ABEE-labeled disaccharides on an amino column with 5–15% water–acetonitrile as eluent at 300 ml minÉ1 with a 60 min program.
dance of selected ions in a negative-ion ESI mass spectrum.
When we examined the relative abundance of frag-ment ions in the ESI mass spectra of ABEE-labeled
disaccharides, it appeared that the relative abundances of some fragment ions were sensitive to the anomeric conÐgurations. Figure 4 shows the proÐles of skimmer cone voltage vs. ion ratio of m/z 221/248 for Glcb1È
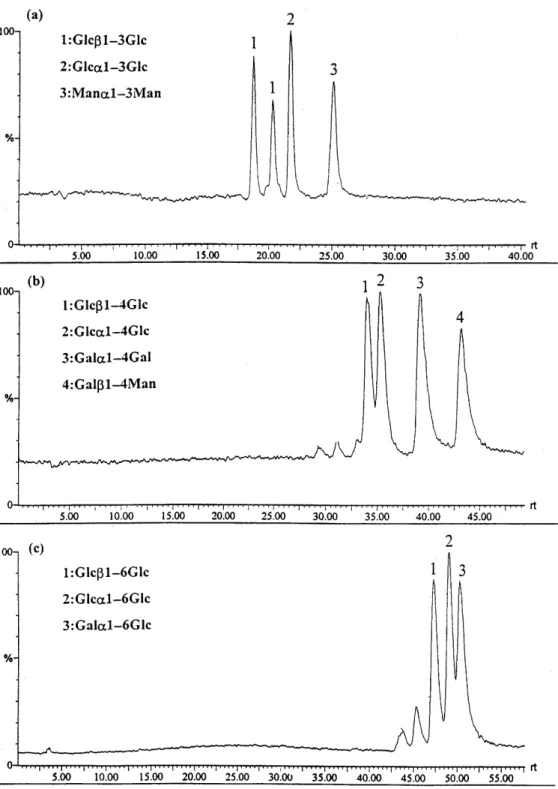
Figure 8. TIC chromatograms of the ABEE-labeled (a) Glca1–3Glc, Glcb1–3Glc and Mana1–3Man, (b) Glca1–4Glc, Gala1–4Gal, Glcb1– 4Glc and Galb1–4Man and (c) Glca1–6Glc, Glcb1–6Glc and Gala1–6Glc mixtures. The HPLC conditions for (a) were the same as in Fig. 7 and for (b) and (c) the eluent was 5–15% water–acetonitrile at 300 ml minÉ1 with a 120 min program.
4Glc and Glca1È4Glc. Variations in fragment ion abun-dance were observed ; the variation within a week is represented by the 3p error bars. As can be seen, the anomeric conÐguration of Glcb1È4Glc and Glca1È4Glc could be unambiguously assigned with the skimmer cone voltage set from 35 up to 75 V. For Glcb1È6Glc and Glca1È6Glc (Fig. 5), although the anomeric con-Ðguration might be determined at both high and low cone voltages, the di†erence was more signiÐcant at lower voltages. The 3p bars overlap at high voltage for Glcb1È3Glc and Glca1È3Glc (Fig. 6), and the anomeric conÐguration was distinguishable only at low voltage.
Owing to the lack of standards, 1È2-linked disaccha-rides were not studied.
In comparison with the FAB/CID technique,22 the di†erences in relative abundance between a- and b-anomers of 1È3- and 1È6-linked disaccharides were much clearer in negative-ion ESIMS.
LC/MS of ABEE-labeled disaccharides
In this study, glycosylamine rather than the popular reductive amination was adopted for labeling the
reducing end of di- and oligosaccharides with an ABEE UV tag. In addition to the fact that the negative-ion in-source CID mass spectrum of a closed-ring (glycosylamine) derivative was more characteristic than that of an open-ring (reductive amination) derivative, closed-ring (glycosylamine) derivatives were reported to show better chromatographic behavior than open-ring derivatives on an amine HPLC column.16,22
The separation of a mixture of four ABEE-labeled glucose disaccharides is shown in Fig. 7. Peaks 1, 2, 3 and 4 correspond to laminaribiose, cellobiose, sopho-rose and gentiobiose, respectively. Disaccharide deriva-tized with the glycosylamine approach resulted in two anomers,16 thus a total of eight peaks were observed. Figure 7(a) and (b) are the UV and total ion current chromatograms. In Fig. 7(c), ions at m/z 368, 260, 263 and 236, which represent 1È2-, 1È3-, 1È4- and 1È6-linked disaccharides, respectively, were selected for the reconstructed ion chromatogram. The linkages of these disaccharides can be unambiguously assigned.
Complete structure information on disaccharide includes linkage, anomeric conÐguration and monosac-charide composition. As discussed above, a direct MS analysis could be used to assign linkages unam-biguously and also to provide the anomeric conÐgu-ration for 1È3-, 1È4- and 1È6-linked glucose disaccharides. Despite the fact that di†erences in ion abundance with high reproducibility were observed for disaccharides with the same linkage, the same anomeric conÐguration but di†erent monosaccharide tions, clear conclusions on monosaccharide composi-tion could not be drawn because of the lack of disaccharide standards with all possible isomeric com-binations (linkage, anomeric conÐguration, monosac-charide composition). On-line coupling of HPLC with ESI-MS might provide a solution to this problem.
HPLC was used to separate disaccharide isomers fol-lowed by MS detection. Disaccharides with the same linkage but di†erent anomeric conÐgurations and monosaccharide compositions could be resolved on an amine HPLC column. The total ion currents of 1È3-, 1È4- and 1È6-linked ABEE-labeled disaccharides are shown in Fig. 8(a), (b) and (c), respectively. The reten-tion times and resolving power achievable with HPLC are helpful in the analysis of disaccharides. Disaccharide isomers can be identiÐed by the combination of reten-tion times and in-source CID mass spectra.
CONCLUSION
Closed-ring (glycosylamine) derivatization of reducing disaccharides and linear oligosaccharides was analyzed by negative-ion ESI-MS. In comparison with unlabeled disaccharides, a much clearer assignment can be made for the linkages of di- and linear oligosaccharide. The anomeric conÐguration of 1È3-, 1È4- and 1È6-linked glucose disaccharides can be assigned based on the rela-tive abundances of speciÐc fragment ions. Although monosaccharide composition did play a role in the frag-ment ion abundance, no clear conclusion could be drawn because of the lack of standard samples. HPLC/ ESI-MS could be used for the di†erentiation of disaccharides with the same linkage but di†erent mono-saccharide compositions.
Acknowledgement
This work was supported by the National Research Council of the Republic of China.
REFERENCES
1. C. G. Hellerqvist,Methods Enzymol. 193, 554 (1990). 2. Z. Zhou, S. Ogden and J. A. Leary,J.Org.Chem. 55, 5444
(1990).
3. G. E. Hofmeister, Z. Zhou and J. A. Leary,J.Am.Chem.Soc. 113, 5964 (1991).
4. D. Garozzo, M. Giffrida, G. Impallomeni, A. Ballistreri and G. Montaudo,Anal.Chem. 62, 279 (1990).
5. R. A. Laine, K. M. Pamidimukkala, A. D. French, R. W. Hall, S. A. Abbas, R. K. Jain and K. L. Matta,J.Am.Chem.Soc. 110, 6931 (1988).
6. R. A. Laine, E. Yoon, T. J. Mahier, S. Abbas, B. de Lappe, R. Jain and K. Matta,Biol.Mass Spectrom. 20, 505 (1991). 7. B. Domon, D. R. Muller and W. J. Richter, Org. Mass
Spectrom. 24, 357 (1989).
8. B. Domon, D. R. Muller and W. J. Richter,Biomed.Environ.
Mass Spectrom. 19, 390 (1990).
9. J. W. Dallinga and W. Heerma, Biomed. Environ. Mass Spectrom. 20, 215 (1991).
10. D. Garozzo, G. Impallomeni and E. Spina, Carbohydr.Res. 221, 253 (1991).
11. B. Mulroney, J. C. Traeger and B. A. Stone, J. Mass Spectrom. 30, 127 (1995).
12. A. Fura and J. A. Leary,Anal.Chem. 65, 2805 (1993). 13. S. C. Churms,J.Chromatogr. 500, 555 (1990).
14. M. Kohler and A. J. Leary,Anal.Chem. 67, 3501 (1995).
15. K. L. Duffin, J. K. Welply, E. Huang and J. D. Henion,Anal.
Chem. 64, 1440 (1992).
16. G. R. Her, S. Santikarn, V. N. Reinhold and J. C. Williams,J.
Carbohydr.Chem. 6, 129 (1987).
17. S. Hase, S. Hara and Y. Matsushima,J.Biochem. 85, 217 (1979).
18. S. Hase, T. Ikenaka and Y. Matsushima,J.Biochem. 90, 407 (1981).
19. W. T. Wang, N. C. LeDonne, B. Ackerman and C. C. Sweeley,
Anal.Biochem. 141, 366 (1984).
20. B. L. Gillece-Castro and A. L. Burlingame, inBiological Mass Spectrometry, edited by A. L. Burlingame and J. A.
McClose-key, p. 411, Elsevier, Amsterdam (1990).
21. L. Poulter, R. Karrer and A. L. Burlingame,Anal.Biochem. 195, 1 (1991).
22. D. T. Li and G. R. Her,Anal.Biochem. 19, 250 (1993). 23. K. Yoshino, T. Takao, H. Murata and Y. Shimonishi,Anal.
Chem. 67, 4028 (1995).
24. J. Gu, T. Hiraga and Y. Wada,Biol.Mass Spectrom. 23, 212 (1994).
25. M. Okamoto, K. Takahashi and T. Doi,Rapid Commun.Mass Spectrom. 9, 641 (1995).
26. S. Suzuki, K. Kakehi and S. Honda,Anal.Chem. 68, 2073 (1996).