Po/y/dmVol. II, No. 13, pp. 1617-1651, 1992 0277-5387/92 $5.00+.00
Printed in Great Britain 0 1992 Pergamon Press Ltd
THE KINETICS OF COMPETITIVE CONSECUTIVE
SECOND-
ORDER REACTIONS: THE TWO-STEP HYDROLYSIS OF
DIMETHOXO(TETRA-p-TOLYLPORPHYRINATO)TIN(IV)
CHING-CHU
TSAI, YAO-JUNG CHEN
and JYH-HORUNG CHEN*Department of Chemistry, National Chunghsing University, Taichung,
Taiwan 40227, R.O.C.
and
LIAN-PIN HWANG
Department of Chemistry, National Taiwan University and Institute of Atomic
and Molecular Science, Academia Sinica, Taipei, Taiwan, R.O.C.
(Received 4 November
1991;
accepted 31
January1992)
Abstract-The
hydrolysis of a new compound, dimethoxo(tetra-p-tolylporphyrinato)tin
(IV), Sn(tptp)(OMe)z, was studied by NMR spectroscopy. The use of a limited amount of
water in CDC13 allowed the hydrolysis intermediate,
hydroxomethoxo(tetra-p-tolyl-
porphyrinato)tin(IV),
to be identified. The results show that the hydrolysis is a two-step
competitive consecutive second-order reaction, with an absolute rate constant of the first
step k, = (6.63 kO.66) x lop3 SK’ M-
’and that of the second step
k2 = (3.55kO.35) x low3SK’
M-’ at 28k2”C.
‘H NMR
spectroscopy
provides a convenient
means of identifying and quantifying reaction inter-
mediates. Previous workers have reported
the
difficulty in detecting dimethoxo(tetraphenylpor-
phyrinato)tin(IV),
Sn(tpp)(OMe)2 (tpp = 5,10,15,
20_tetraphenylporphyrinato),
by ‘H NMR spec-
troscopy due to its rapid hydrolysis to dihydroxo
(tetraphenylporphyrinato)tin(IV),
Sn (tpp)(OMe),,
unless CDCl, is specially dried. ‘,’ Recently, we
reported
the two-step hydrolysis of dimethoxo
(tetraphenylporphyrinato)tin(IV),
Sn(tpp)(OMe),,
by ‘H NMR
spectroscopy.3
In the previous
paper, 3 the absolute values of two consecutive
rate constants
k,and
k2could not be determined
since the precise concentration
of water was not
measured. However, an analysis of data led to
an estimate of 2.3 for the ratio
kl/k2.The new
compound
described in this paper, dimethoxo
(tetra-p-tolylporphyrinato)tin(IV),
Sn(tptp)(OMe),,
was synthesized and used in the hydrolysis invest-
igation. With the aid of ‘19Sn and ‘17Sn couplings,
*Author
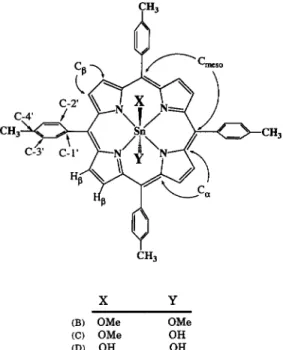
to whom correspondence should be addressed.the stoichiometry of the species Sn(tptp)(OMe), (B),
hydroxomethoxo(tetra-p-tolylporphyrinato)tin(IV),
Sn(tptp)(OMe)(OH)
(C), and dihydroxo(tetra-
p-tolylporphyrinato)tin(IV),
Sn(tptp)(OH),
(D)
(shown in Fig. l), was determined from the relat-
ive intensities of the ‘H signals of the hydroxy and
methoxy groups. The results indicate that there is
a two-step competitive consecutive second-order
process involved in the hydrolysis of Sn(tptp)
(OMe), to Sn(tptp)(OH),.
With the aid of known
water concentration
determined by proton NMR
intensity, the graphical-integration
time-variable
transformtion
method was used to evaluate the
absolute values for both rate constants.
EXPERIMENTAL
Preparation of
Sn(tptp)(OMe),
Sn(tptp)(OMe),
was prepared by substituting
meso-tetraphenylporphyrinato,
tpp, with
meso-tetra-(p-tolyl)porphyrin,
tptp, in the preparation of
Sn(tptp)(OMe), as described elsewhere.‘*3,4
1648 CHING-CHU TSAI et al.
X Y
(B) OMe OMe
CC) OMe OH
CD) OH OH
Fig. 1. Structure of Sn(tptp)XY complexes.
NMR sample preparation
Deuterated
chloroform
(99.8% from Aldrich)
was dried with CaCl,. The trace amount of residual
water in CDC13 was quantified
by an NMR
method after the sample solution was prepared. The
sample was prepared by dissolving Sn(tptp)(OMe),
in CDC13 to give a concentration of 2.53 x lo-’ M.
Immediately after the freshly prepared solution was
poured into a 5 mm NMR tube, the tube was sealed
with a plastic cap, wrapped with parafilm and mea-
sured at 28 f 2°C.
NMR spectra
‘H and 13C NMR spectra were recorded at 300
and 75.46 MHz, respectively, on a Varian VXR-
300 spectrometer.
RESULTS AND DISCUSSION
The hydrolysis of Sn(tptp)(OMe)* may be expre-
ssed as a two-step competitive consecutive second-
order reaction.
LetA = H20, B = Sn(tptp)(OMe)2,
C = Sn(tptp)(OMe)(OH),
D = Sn(tptp)(OH), and
E = MeOH.
The chemical equations
for the
hydrolysis of B are
A+B
-C+E
k’
(step 1)
A+CAD+E
(step2)
(1)
(2)
where k, and k2 are the rate constants for steps 1
and 2, respectively.
For eqs (1) and (2), the pertinent rate equations
are
WI
~
=
-k,[A][B]
dt
g=
k,[A][B] - k,[A][C]
y
= k,[A][C].
From the principle of material balance, they read
Pl+[‘4+[Dl=
Plo+[Clo+Pl,
(6)
and
[Al+Pl+[Cl+Pl+[El
= ~~l,+~~l,+~~l,+~~l,+~~l,
(7)
where the subscripts 0 represent the initial con-
centrations of the respective chemical species.
It is apparent that eqs (3H5) may be readily
converted to equations of first-order type by intro-
duction of the paramete?”
8 = &[H,O]dt.
On
integration, we obtain
[B] = [B]Oe-klB
(8)
[C] = [C], e-*“+A
[B]o(e-kle-e-kzB)
(9)
[D] = [D]o+[C]o(l -e-:2’)
1 -he+(10)
The relationship between 8 and
tis readily estab-
lished by plotting [H,O] against
tand integrating
graphically. The data giving [H,O] as a function of
t
are then converted to the 8 basis and subsequently
handled as a first-order process.
NMR spectra of Sn(tptp)(OMe),
at various
stages of hydrolysis are displayed in Figs 2 and 3.
The proton NMR spectrum from the hydrolysis of
Sn(tptp)(OMe),
at reaction time
I =20 min is
shown in Fig. 2. The peaks corresponding
to the
three compounds ED at various times are shown
in Fig. 3. Figure 3a is the NMR spectrum obtained
3 min after dissolution;
it is dominated by the
Sn(tptp)(OMe), resonance j, with a smaller reson-
ance 1’ for Sn(tptp)(OMe)(OH)
and an almost
negligible Sn(tptp)(OH), resonance m. Figure 3b-
d shows increasing production
of Sn(tptp)(O-
Me)(OH) and Sn(tptp)(OH), with reaction time
t.The time-dependent
concentrations
of the five
species Sn(tptp)(OMe),,
Sn(tptp)(OMe)(OH),
Sn
(tptp)(OH),, MeOH and Hz0 are shown in Fig. 4.
Kinetics of competitive consecutive second-order reactions f g i d a i,l b c e I I h mri A I I I I I I I I 4 6 6 4 2 0 -2 -1 -6 -8 wm
Fig. 2. NMR spectrum for Sn(tptp)(OMe), hydrolysis after a reaction time of 20 mm. The spectral resonances used to measure the concentrations of compounds ED, MeOH and H,O are shown. The proton assignments are : (a) H, (pyrrole) ; (b) phenyl H (ortho) ; (c) phenyl H (me@ ; (d) CHCl, ; (e) methyl group of methanol ; (f) p-CHS ; (g) hydroxy group of water; (h) methanol OH group; (i) tetramethyl silane ; (i) methoxy group of Sn(tptp)(OMe),; (1) methoxy group of Sn(tptp)(OMe)(OH);
(1’) hydroxy group of Sn(tptp)(OMe)(OH) ; (m) hydroxy group of Sn(tptp)(OH),.
The initial build-up and subsequent decay of concentration of 2.53 x lo-’ M. As the reaction
Sn(tptp)(OMe)(OH) are clearly evident for
k2 c kl.
proceeds, the increase of methanol concentrationFurther experiments indicate that more than 95% and the decrease of water concentration as expre-
of the initial concentration of Sn(tptp)(OMe)z is ssed in eqs (1) and (2) were monitored by integration consumed within
3
h. Thus the reactions with water of the peaks e and g shown in Fig. 2 and comparisonare essentially irreversible. The initial water con- with the known Sn(tptp)(OMe), concentration at
centration was quantified by the NMR integration peak j. The result is also shown in Fig. 4. The value
method with respect to the known Sn(tptp)(OMe)r of the new time variable, 8, at any time was
I
(a) t=3 minI’
&#.A
4
(u j (b) t=20 min 1 (e)t=50min 1 kk9Omin _i_Fig. 3. NMR spectra for Sn(tptp)(OMe)r hydrolysis after reaction times of 3 min (a), 20 mm (b), 50 mm (c) and 90 min (d).
1650 . :Sn(tptp)(OMe)Z . :Sn(tptp)(OMe)(OH) % :Sn(tptp)(OH)z +:n30 n :MeOH 3 30 60 100 t (min)
Fig. 4. A plot showing the concentration of compounds A-E with respect to reaction time. The concentrations of these five compounds are obtained by normalizing with eq. (7). The solid curves
are graphed to guide the eye.
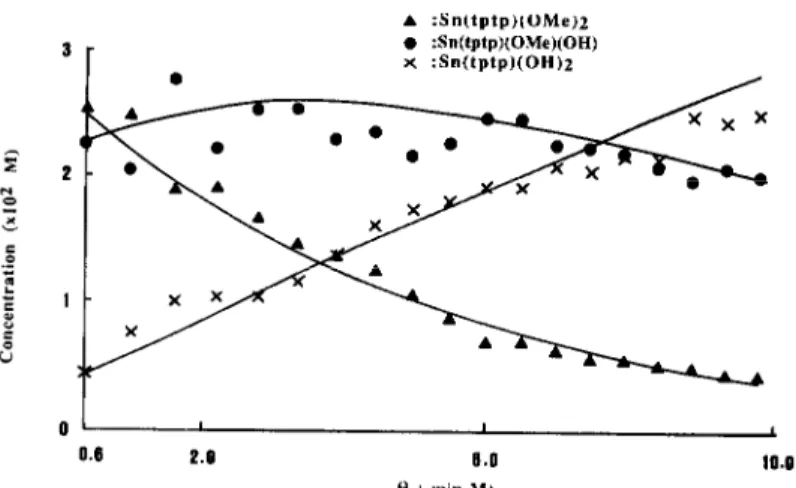
. :Sn(tptp)(OMe)z . :Sn(tptp)(OMe)(OH) x :Sn(tptp)(OH)z 0 I I 0.6 P.0 0.0 16.0 t) ( min MI
Fig. 5. A plot showing the concentration of compounds B-D with respect to 0 (see Fig. 4) at 28 +2”C. The solid curves were obtained by computer-fitting with eqs (8)-(10). This yields k, = (6.63 kO.66) x
1O-3 s-’ M-‘; k, = (3.55f0.35)~ 10-3s-’ M-‘; K= 0.54f0.11.
Table 1. ‘H NMR chemical shifts (6 in ppm>” and ‘H-’ “2’ ” Sn coupling constants (J in Hz) for compounds ED Pyrrole H
Phenyl H Phenyl H
Compound 6 J(Sn-H) (ortho) (meta) p-Me
Sn-OH Sn-OMe 6 J(Sn-H) 6 J(Sn-H) B 9.12 - 8.19 (dd) 7.60 (d) 2.73 - -2.16 70.0 (‘19Sn) 66.8 (’ ’ 'Sn) C D Dh D’ 9.13 - 8.21 7.61 2.73 -7.50 35.6 (’ 19Sn) -2.15 71.4 (‘19Sn) 34.0 (’ ’ 'Sn) 68.2 (’ ’ 'Sn) 9.15 10.6 8.22 (d) 7.62 (d) 2.73 -7.48 37.0 (’ ’ 9Sn) - 35.6 (“‘Sn) 9.13 12.2 8.21 7.62 (d) 2.73 -7.49 36.1 9.14 10.3 8.21 7.61 - - 7.46 (br)
“Chemical shifts in ppm relative to TMS. ’ From ref. 11.
‘From ref. 2. dd = doublet.
Kinetics of competitive consecutive second-order reactions Table 2. 13C NMR chemical shifts (6 in ppm)” for compounds ED
Compound C-a C-8 C-meso c- 1’ c-2 C-3’ c-4 C(p-Me)’ C(OMe)
B 147.3 132.3 121.6 138.6 135.1 127.6 137.8 21.5 44.6
C 147.0 132.4 121.4 138.6 135.0 127.7 137.9 21.5 44.6
D 146.7 132.6 121.2 138.4 135.0 127.7 137.9 21.5
“Chemical shifts relative to the centre line of the CDCl, triplet at 77.0 ppm.
1651
bp-Me is the methyl group at the para position.
determined by graphical integration of & [H,O] dt
and thereby the relationship between [H,O] and 0
established. The t-dependence for compounds B-D
shown in Fig. 4 was then transformed to &depen- dence as shown in Fig. 5. The solid curves were computer-fitted with eqs (8)--(10) at 28 f 2°C. They give k, = (6.63f0.66) x lop3 s-’ M-‘, k2 = (3.55
*0.35)x 10P3 s-’ M-’ and K = k2/k, = 0.54f
0.11. This K value is comparable with K = 0.43
obtained from the hydrolysis of a similar com-
pound, Sn(tpp)(OMe),.3
The ‘H NMR data for compounds ED are dis-
played in Table 1, together with relevant literature data.2.’ ’ ’ 3C chemical shifts for compounds ED are given in Table 2. 13C shifts were assigned with the aid of published data of a similar compound. 3 In this work a controlled trace amount of water has been involved in the study of the hydrolysis
of Sn(tptp)(OMe), to Sn(tptp)(OH),. A two-step
competitive consecutive second-order process with
Sn(tptp)(OMe)(OH) as an intermediate has been
found. The exact solution for the rate constant of the first step is k, = (6.63kO.66) x lop3
s- ’
M-’ and that of the second step is k2 = (3.55 kO.35)x lo- 3 s- ’ M- ’ at 28 f 2°C. The graphical-integra-
tion time-variable transformation method developed
in this work may be applied to the study of the kinetics of general competitive consecutive second- order reactions.
Acknowledgement-Financial support from the National Research Council of the R.O.C. under Grant NSC 80- 0208-M-005-13 is gratefully acknowledged. 1. 2. 3. 4. 5. 6. 7. 8. 9. 10. 11. REFERENCES
D. P. Arnold, J. Chem. Educ. 1988,65, 1111. D. P. Arnold, Polyhedron 1988,7,2225.
H. J. Lin, J. H. Chen and L. P. Hwang, Aust. J. Chem. 1991,44,747.
R. J. Abraham, G. E. Hawkes, M. F. Hudson and K. M. Smith, J. Chem. Sot., Perkin II 1975,204. W. G. McMillan, J. Am. Chem. Sot. 1957,79,4838. D. French, J. Am. Chem. Sot. 1950,72,4806. A. A. Frost and W. C. Schwemer, J. Am. Chem. Sot.
1952,74, 1268.
S. Wideqvist, Acta Chem. Stand. 1950,4, 1216. S. Wideqvist, Acta Chem. Stand. 1962, 16, 1119. J. W. Moore and R. G. Pearson, Kinetics and Mech- anism, 3rd edn, pp. 30&304. John Wiley, New York (1981).
K. M. Kadish, Q. Y. Y. Xu and G. B. Maiya, J. Chem. Sot., Dalton Trans. 1989, 1531.