188
A STUDY OF THE RELATIONS BETWEEN CUSTOMER SATISFACTION, LOYALTY, AND PURCHASE INTENTION–IN THE CASE OF CHUNGHWA
TELECOM’S MOBILE INTERNET
Day, Jen-Der1 and Tsai, Ai-Ling2 1
National Kaohsiung University of Applied Sciences 2
National Kaohsiung University of Applied Sciences
ABSTRACT
This study aims at investigate the decisive factors of purchase intention of mobile internet of Chunghwa Telecom (CHT). This paper applies entity and network questionnaires. Respondents refer to users of CHT’s mobile internet and 184 effective questionnaires are obtained. Validity and reliability analysis are used to confirm the questionnaire items. Pearson's product-moment correlation is applied to analyze the correlations between customer satisfaction, loyalty, and purchase intention. Independent sample T-test and One-Way ANOVA are adopted to investigate if demographic variables impose a significant influence on customer satisfaction, loyalty, and purchase intention.
The results reveal that occupation variable has significant influence on customer satisfaction, respondents work as service industry and student score higher mean. There are positive correlations between customer satisfaction, loyalty, and purchase intention. Respondents are satisfied with the quality but dissatisfied with the price. Respondents tend to be loyal and pay attention to promotions. Finally, respondents have intention to buy, but they require promotions and high capability/price (C/P) value as an inducement. Generally, degree of respondents’ satisfaction and loyalty are between medium to high. If CHT needs to enhance the purchase intention, it is suggested to provide promotions, maintain and improve its quality and modify its price of mobile internet.
KEYWORDS: Customer Satisfaction, Customer Loyalty, Purchase Intention, Mobile
Internet
1 INTRODUCTION
In the past few years, the development of main personal mobile terminal has changed to smart phone from notebook PC (Chen & Lin, 2011). Thus, the phenomenon of replacing the traditional internet into the mobile internet has increased. Such transformation has brought the market of mobile internet service to a highly competitive market.
According to the data provided by Chunghwa Telecom (CHT), it has more than 1.5 million users of mobile internet service. Estimated and expected by CHT, the user number will be continuously grown to 2.2 million by the end of 2012. Mobile internet service refers to a rather
new but potential business, hence, specific and practical studies in this area are strongly required.
Customer satisfaction (CS) is reorganized as a key effect between customers and their suppliers. It is believed that one satisfied customer will probably repurchase from the same supplier and even recommend to others (Yang, et al., 2009). Customer loyalty (CL) has long been regarded as an important goal (Reichheld and Schefter, 2000). Fornell, (1995) pointed that market researchers believe that a group of loyal customers is a competitive advantage of a firm which helps to raise the companies’ sales and benefits. Purchase intention (PI) can measure the possibility of a consumer to buy a product, and the higher the
189 purchase intention is, the higher a consumer’s willingness is to buy a product (Dodds, et al., 1991). Thus, this study assumes PI as an important factor of enterprise’s benefits and advantages. According to the background and motivation above, this study selects CHT’s mobile internet as research subject. Demographic variables are used to define the market segmentation. And three measurement including CS, CL, and PI are applied as the analysis tool.
Objectives of this study are threefold. First, this study aims to investigate the decisive factors of purchase intention of CHT’s mobile internet. Second, this study examines whether the presumed conceptual framework is feasible with the research case. Finally, constructs of this study are tested whether there are correlations or not. The analysis results of this study can be adopted by CHT or other telecom enterprises as the developing references in the future.
2 LITERATURE REVIEW 2.1 Customer satisfaction
CS generally means customer reaction to the state of fulfillment, and customer judgment of the fulfilled state (Oliver, 1997). In the buyer behavior model developed by Howard & Sheth (1969), they define customer satisfaction as the point at which expectation and reality coincide. Engel et al. (1990) suggest customer satisfaction as the outcome of the subjective evaluation that chosen alternative meets or exceeds expectations. These definitions imply satisfaction is the degree of discrepancy between anticipation and realization.
Bowen & Chen (2001) said that having satisfied customers is not enough, there has to be extremely satisfied customers. This is because customer satisfaction must lead to customer loyalty. Fornell (1992) said “high customer satisfaction will result in increased loyalty for the firm and that
customers will be less prone to overtures from competition”.
2.2 Customer Loyalty
Generally speaking, CL means the intention of repurchasing products and services, and this is the goal of industry. Loyalty towards a brand or service often used repeat purchase and re-purchase intentions as indicators (Heskett et al., 1994).
Jones and Sasser (1995) classified the measurement of customer loyalty into three categories: intent to repurchase, primary behaviour (transaction information) and secondary behaviour (the willingness to recommend products and services in public, and give praise). Griffin (1997) held that the customers with loyalty repurchase often, purchase other products and services from the company, build public praise, and have immunity to the promotional activities of competitors.
Satisfied buyers tend to become loyal customers (Sheth, et al., 1999). Keeping customers satisfied is cost effective. Acquiring new customers can cost five times more than the costs involved in satisfying and retaining current customers (Reichheld, 1996a).
2.3 Purchase Intention
Dodds, Grewal & Monroe (1991) defined the purchase intention as a possibility of the consumers trying to buy a product or a brand. Consumers tend to choose the greatest perceived value of the product or service while making purchase decision. PI can measure the possibility of a consumer to buy a product. The higher the purchase intention is, the higher a consumer’s willingness is to buy a product (Dodds, et al., 1991; Schiffman & Kanuk, 1994). Purchase intention indicates that consumers will follow their experience, preference and external environment to collect information, evaluate alternatives, and make purchase decision (Zeithaml, 1988; Dodds et al., 1991; Schiffman & Kanuk, 1994).
190 3 RESEARCH DESIGN AND
METHODOLOGIES 3.1 Conceptual Framework
The conceptual framework of this study presented in figure 1 originates from inference of previous chapters. Every cell stands for a construct and factor(s) of the construct. Arrow headed line represents casual relation between two constructs. Every line with a sign denoted beside it represents a hypothesis statement of this study.
Figure 1. Conceptual Framework of this Study
3.2 Hypotheses
Hypotheses of this study are derived from literature review in chapter 2. Based on presumed relationship in the conceptual framework, hypotheses of this research are listed as followed.
H1: Demographic variables have a significant positive influence on customer satisfaction.
H2: Demographic variables have a significant positive influence on customer loyalty.
H3: Demographic variables have a significant positive influence on purchase intention of mobile internet.
H4: Customer satisfaction has a significant
positive influence on purchase intention.
H5: Customer loyalty has a significant
positive influence on purchase intention. H6: Customer satisfaction is correlated with customer loyalty.
3.3 Definitions of Research Variables
This study adopts customer satisfaction, customer loyalty, purchase intention and demographic variables as four major constructs. Each construct has eight measurement items and presented in the form of five-point Likert scale ranging from “strongly disagree” to “strongly agree”. Every measurement items have supported references. For example, references of measurement items of customer satisfaction are Zeithaml and Bitner (1996) with question 1 “I am satisfied with the quality of mobile internet provided by CHT”, McDougall and Levesque (2000) with question 3 “CHT’s mobile internet offers valuable C/P value”, Hellier et al. (2003) with question 5 “I have good experience in using CHT’s WIFI service”…and so on.
3.4 Sampling Plan
The questionnaire is designed and conducted through online questionnaire website and street survey, in order to maximize the questionnaire coverage. Respondents must be users of CHT’s mobile internet.
3.5 Data Analysis Procedures
Several statistical analyses and multivariate techniques are taken for investigating objectives of this study. These analyses are conducted mainly by the Statistical Package for the Social Sciences (SPSS) version 12.0.
Characteristics of respondents are first summarized. Descriptive statistics are listed in the form of table to show the delineation of the sample. Then, to test the reliability of each factor, the Cronbach coefficient alpha is taken. In addition to confirm the internal consistency among variables, item to total of variables are used as an indicator of examination. Pearson correlation is used to verify correlation between customer satisfaction, customer loyalty, and purchase intention, to see whether they have positive or negative relations. Also, the coefficient of determination (R square) is examined in
191 order to compute the shared variance between variables. Applying Independent Sample T-Test and One-Way Analysis of variance (ANOVA), relations between demographic variables and constructs are examined. Hypotheses of this study are also respectively investigated.
4 ANALYSIS AND RESULTS 4.1 Descriptive Analysis
4.1.1 Characteristics of Respondents
After the survey, questionnaires totaled 217 in the database. By screening out invalid questionnaires, 184 valid ones are left. The response rate is approximately 84.8%. The ratio of male respondents is 44.6% and 55.4% for female. In age distribution, young adult whose ages are between 21 and 25 dominates 44.6% of the sample. In the vocational distribution, student are the largest part; follows by finance and insurance.
4.1.2 Measurement results for relevant research variables
Respondents tend to evaluate CS construct with fair opinions. They show higher satisfaction to CHT’s mobile internet quality whereas lower satisfaction to its price. For CL, respondents all have positive agreement since the mean are above 3. Further, respondents pay attention to new mobile value-added services and preferential offers. For PI, the means are ranging from 3.38 to 4.03, respondents all show positive agreement. The results demonstrate that promotion may cause PI of respondents. Respondents most expect the improvements of CHT's mobile internet are price (29%), speed of mobile internet (23%), and length of contract period (15%). The crucial improvements leading respondents to purchase are price (34%), speed of mobile internet (25%), and quality of mobile internet (15%).
4.2 Reliability and Validity Tests
The questionnaire in this study is based on the theories and takes items of previous studies as measurement items. Hence, this
study is qualified with content validity. In statistics, the most common used method to examine construct validity is factor analysis (Wu, 2007). In this study, the result of factor analysis provides0.884as the KMO (Kaiser-Meyer-Olkin) value which is greater than 0.5. And the P-value shows significant result (P=0.000<0.05). Therefore, the data is qualified to be proceeding through factor analysis and conformed to construct validity.
For CS, variables have viable item-to-total correlation ranging from 0.533 to 0.760; the Cronbach’s alpha is 0.855 which displays high reliability. For CL, variables have feasible item-to-total correlation ranging from 0.525 to 0.809; the Cronbach’s alpha is 0.881 which shows high reliability of the research items. For PI, the item-to-total correlations of its variables range from 0.533 to 0.831; the Cronbach’s alpha is 0.895 which also demonstrates high reliability.
4.3 The Influence of Demographic Variables on CS, CL, and PI
The demographic variables include gender, age, educational level, occupation, and monthly income. In CS construct, there is only occupation variable pass the significant result; other 4 variables fail to achieve it. In other words, significant differences exist in CS among respondents of different occupations. Therefore, hypothesis 1 (H1) is proved partly supported. In CL construct, all the demographic variables fail to pass the significant result. Therefore, hypothesis 2 (H2) is proved unsupported. Finally, in PI construct, all the demographic variables fail to pass the significant result. Thus, hypothesis 3 (H3) is proved unsupported.
4.4 Correlation between CS, CL, and PI
To investigate whether there is a correlation between CS, CL, and PI, product-moment correlation analysis (Pearson correlation analysis) is adapted. Pearson correlation analysis is the most widely used type of correlation coefficient (Hopkins et al.,
192 1978). It simply determines the extent to which values of two variables are proportional.
The finding of Table 1 suggests that CS has a moderate positive correlation (r=.421>.400) with PI. The coefficient of determination (R square) is .177; which represents 17.7 percent shared variance between these two variables. Hence, H4 is supported. Further, there is a highly positive correlation (r=.864 >.700) between CL and PI. The coefficient of determination (R square) is .746 which is equal to 74.6 percent shared variance. As the result, hypothesis 5 (H5) is supported. There is a moderate positive correlation between CS and CL (r=.433>.400). In other words, the results indicate that the higher satisfaction respondents have, the higher loyalty they own. The coefficient of determination (R square) is .187; which represents 18.7 percent shared variance between them. Thus, hypothesis 6 (H6) is supported.
Table 1. Correlation between CS, CL & PI
CS CL PI CS Pearson Correlation 1 .433(**) .421(**) P (Sig.) .000 .000 N R Square 184 184 .187 184 .177 CL Pearson Correlation .433(**) 1 .864(**) P (Sig.) .000 .000 N R Square 184 .187 184 184 .746 PI Pearson Correlation .421(**) .864(**) 1 P (Sig.) .000 .000 N R Square 184 .177 184 .746 184 5 CONCLUSIONS AND SUGGESTIONS 5.1 Conclusions
There are total six hypotheses forming the framework of this study. H3, H4 and H5 are supported; H1 is partly supported. However, H2 and H3 are proved unsupported. Demographic variables generally do not demonstrate significant influences on CL,
PI and most parts of CS. In these constructs, only occupation differences have a significant influence on CS. Respondents whose occupations refer to service industry and student score higher mean. It might be inferred that due to the difference of jobs, the needs and value of respondents are divergent. Therefore, their satisfaction toward CHT’s mobile internet may be dissimilar. Both CS and CL have a significant positive influence on PI. Hence, H4 and H5 are supported. Then, CS has a significant positive influence on CL. Accordingly, H6 is proved.
According to the descriptive analysis of multiple choices items of PI, it can be concluded that price and speed of mobile internet are the most decisive factors of customer’s desire to purchase. Combining with the previous results, it can be inferred that the respondents pay attention to preferential offer and quality of CHT’s mobile internet. The results of different constructs reveal consistency.
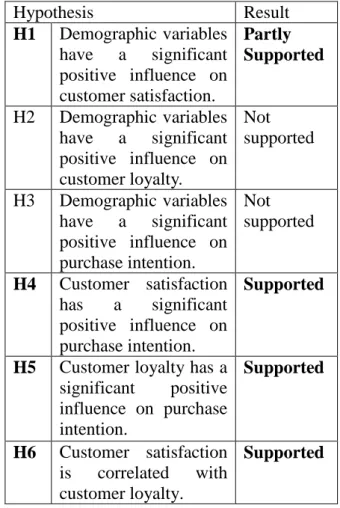
Table 2. Hypotheses Testing Results
Hypothesis Result H1 Demographic variables have a significant positive influence on customer satisfaction. Partly Supported H2 Demographic variables have a significant positive influence on customer loyalty. Not supported H3 Demographic variables have a significant positive influence on purchase intention. Not supported H4 Customer satisfaction has a significant positive influence on purchase intention. Supported
H5 Customer loyalty has a significant positive influence on purchase intention. Supported H6 Customer satisfaction is correlated with customer loyalty. Supported
193 5.2 Suggestions
Anton (1996) addressed “satisfaction is positively associated with repurchase intentions, likelihood of recommending a product or service, loyalty and profitability”. Guiltinan, Paul and Madden (1997) said that satisfied customers are more likely to be repeat (and even become loyal) customers. Loyal customers would purchase from the firm over an extended time (Evans and Berman, 1997). Further, in this study, it is found that both CS and CL have a positive correlation with PI. Moreover, Sivadas and Baker-Prewitt (2000) indicated “there is an increasing recognition that the ultimate objective of customer satisfaction measurement should be customer loyalty”. Fornell (1992) pointed out “high customer satisfaction will result in increased loyalty for the firm and that customers will be less prone to overtures from competition”. Similarly, this study finds that CS is correlated with CL. The results in this study show consistency with former researches.
In sum, for CS construct, CHT’s mobile internet’s quality is satisfied whereas the price is dissatisfied. Thus, CHT needs to modify its pricing. For CL construct, respondents pay attention to new mobile value-added services and preferential offers, but they do not tend to positively recommend CHT’s mobile internet to other people. To reform the issue, CHT may provide more mobile value-added services and promotions and encourage purchasing experience sharing. For PI construct, it is found that respondents will apply CHT’s mobile internet if there is a promotion. Generally, degree of respondents’ CS, CL and PI are between medium to high. If CHT needs to enhance the PI, it is suggested to heighten CS and CL by maintaining and improving its quality and modifying its price of mobile internet; and providing promotions.
6 REFERENCES
[1] Chen, S.J. et al., “A Study of the Smart Phone on Purchase Intention - The Case of Apple iPhone,” Shih Chien
University, Dept. of Business
Administration, Master’s thesis, 2011.
[2] Yang, X.C. et al., “Switching costs between customer satisfaction and loyalty – An empirical evidence from broadband services in Mainland China,” International Joint Conference
on Computational Sciences and Optimization, Vol.1, 2009, pp.768-772.
[3] Reichheld, F. F. et al., “E-loyalty: Your secret weapon on the web,” Harvard
Business Review, Vol.78, No.4, 2000,
pp.105-113.
[4] Fornell, C., "The Quality of Economic Output: Empirical Generalizations about its Distribution and Relationship to Market Share", Marketing Science, Vol.14, No.3, 1995, pp.203-211.
[5] Dodds, W. B. et al., “Effects of Price, Brand and Store Information on Buyers’ Product Evaluations.” Journal
of Marketing Research, Vol.28, No.1,
1991, pp.307-319.
[6] Oliver, R.L., Customer satisfaction: A
behavioral perspective on the consumer, New York: McGraw-Hill,
1997
[7] Howard, J. A. et al., “The Theory of Buyer Behavior,” New York: John
Willey & Sons, 1969.
[8] Engel, J.F. et al., “Consumer Behavior,” The Dryden Press, Chicago,
IL., 1990.
[9] Bowen, J. T. et al., “The Relationship between Customer Loyalty and Customer Satisfaction,” International
Journal of Contemporary Hospitality Management, Vol.13, No.5, 2001, pp.
213-217.
[10] Fornell, C. “A National Customer Satisfaction Barometer: The Swedish
194 Experience,” Journal of Marketing, Vol.56, No.1, 1992, pp.6-21.
[11] Heskett, J. L. et al., “Putting the Service-Profit Chain to Work,”
Harvard Business Review, Vol.72,
No.2, 1994, pp.164-170.
[12] Jones, T. O. et al., “Why Satisfied Customer Defect,” Harvard Business
Review, Vol.73, No.6, 1995, pp.88-99.
[13] Griffin, J., “Customer Loyalty, How to Earn It, How to Keep It?” Lexington
Book, NY., 1997.
[14] Sheth, J. N. et al., Consumer behavior,
Fort Worth: Dryden Press, 1999.
[15] Reichheld, F. F., The Loyalty Effect,
Cambridge, Harvard Business School Press, 1996a.
[16] Schiffman, L.G. et al., Consumer Behavior, Sixth Edition, Englewood
Cliffs, NJ: Prentice Hall, 1994.
[17] Zeithaml, V. A. “Consumer perceptions of price, quality, and value: A means-end model and synthesis of evidence,” Journal of Marketing, Vol.52, 1988, pp.2-22.
[18] Zeithaml, V. A. et al., Service Marketing, McGraw-Hill, NY., 1996. [19] McDougall G.H.C. and L. Levesque,
“Customer Satisfaction with Services: Putting Perceived Value into the Equation,” Journal of Service Marketing, Vol. 14(5), 2000, pp.
392-410.
[20] Hellier, P. K. et al., “Customer repurchase intention: A general structural equation model,” European
Journal of Marketing, Vol.37,
No.11/12, 2003, pp.1762-1800.
[21] Wu, M.R. “SPSS Operation and Application,” pp.279-288, Wu-nan, 2007.
[22] Anton, J. “Customer Relationship Management: Making Hard Decisions with Soft Numbers,” Upper Saddle
River, Prentice-Hall, 1996.
[23] Guiltinan, J. P. et al., “Marketing Management: Strategies and Programs,” 6th ed., New York,
McGraw-Hill, 1997.
[24] Evans, J.R. et al., “Marketing” 7-1h Ed., Upper Saddle River, NJ: Prentice
Hall, 1997.
[25] Fornell, C. “A National Customer Satisfaction Barometer: The Swedish Experience,” Journal of Marketing, Vol.56, No.1, 1992, pp.6-21.