Pergamon
Geochimica et Cosm~himica Acta, Vol. 58, No. 7, pp. 1795-181 I, 1994 Copyright Q 1994 Ekvier Science Ltd
Printed in the USA. All rights reserved 0016-7037/94 $6.00 + .OO
The behavior of scavenged isotopes in marine anoxic environments: *“Pb and
*“PO in the water column of the Black Sea
CHING-LING WEI * and JAMES W. MURRAY
School of Oceanography, University of Washington, Seattle, WA 98 195, USA (Received kiuy 16, 1992; uccepied in revised form December 23, 1993 )
Abstract-Vertical profiles of dissolved and particulate *“Pb and “‘PO were determined at two stations in the Black Sea in June 1988. Vertical fluxes of *‘?‘b and “?o were also measured in the upper 150 m, using floating sediment traps.
The fractionation of *“Pb between dissolved and particulate phases in the Black Sea is strongly influenced by the redox conditions in the water column. Dissolved *“Pb dominates in the oxic zone, while particulate *“Pb is the major form in the deep sulfide-rich anoxic zone. The distribution of *“Pb across the suboxic zone appears to be mainly controlled by redox cycling of manganese and iron. In the sulfide-rich layer copr~ipi~tion of lead with iron sulfide is probably the dominant scavenging mechanism.
A simple scavenging model was used to calculate the residence times of dissolved and particulate *“Pb in the oxic, suboxic, and anoxic zones. The residence times of dissolved “‘Pb relative to scavenging by particles are OS-l, 2-3, and 3.5 years in the oxic, suboxic, and anoxic layers, respectively. The corre- sponding residence times of particulate “‘Pb relative to particle removal processes in the same layers are 0.1, 1 S-2.5, and 8.5 years, respectively. A particle settling velocity of about 40 m y
-’
was derived from the *“Pb/*“Ra disequilibrium in the deep Black Sea. The relatively short residence times of *“Pb support the hypothesis that anoxic basins are important sites for boundary scavenging of “‘Pb.The *“PO profiles indicate that biological rather than inorganic particles are the major carrier phases for polonium in the Black sea. Dissolved “‘PO is deficient relative to dissolved “‘Pb in the euphotic zone, suggesting preferential uptake of “‘PO over 2’oPb by particles residing in that layer. The residence time of dissolved *“PO, with respect to scavenging by particles in the euphotic zone, is about 200 days. Below the mid-depth of the suboxic zone, “‘PO is in excess relative to “*Pb, and is thought to originate from shelf and slope sediments.
Based on the magnitude of distribution coefficients (&), the relative partitioning of lead, polonium, and thorium to particles found in the oxic and anoxic layers of the Black Sea are PO > Th > Pb and PO = Pb > Th, respectively. The dependency of KD on particle concentration suggests that colloidal phases may be important for the scavenging of these radionuclides.
INTRODUff ION
THE GEOCHEMICAL DISTRIBUTIONS Of trace metals have been predicted and shown to vary from oxic to sulfidic environ- ments, depending on their electronic configumtion and re- sulting class A vs. transition metal, vs. class B behavior (EMERSON et al., 1983; JACOBS and EMERSON, 1982). These intrinsic chemical affinities should also apply to the reactivity of metals with particle surfaces. Class A metals are expected to react more strongly with oxide than sulfide particles. Class B metals should react strongly with sulfides. Of elements nor- mally used to study scavenging from seawater, thorium (234Th) should be a tracer for class A behavior while lead ( 2’oPb), and to a lesser extent polonium (*“PO), should tend to display class B behavior. “‘PO may also be a tracer for nutrient like behavior ( KAIXO, 1993 ) .
The Black Sea is an ideal location to study how the dis- tribution and fluxes of 234Th 2’oPb and 2’oPo are influenced by oxic and sulfidic enviroiments: The anoxic interface in the Black Sea has been well defined (MURRAY et al., 1989; MURRAY, 1991; IZDAR and MURRAY, 1991; TLJGRUL~~ al., 1992; SAYDAM et al., 1993; MURRAY et al., in press) and
* Prgsenr Address: Institute of Oceanography, National Taiwan University, P.O. Box 23- 13, Taipei, Taiwan, ROC.
consists of an oxic surface layer, a sub-oxic interface layer and anoxic, sulfide rich deep water ( CODISPOTI et al., 199 1). The distribution and fluxes of 234Th have been presented by WEI and MURRAY ( 1991). Here we present the dissolved and particulate water column profiles and drifting sediment trap fluxes for “?b and *“PO collected during the 1988 Black Sea Expedition.
BACKGROUND
The deviation of the activities of *“PO (t1,2 = 138.4 d) and *“Pb (t 1/2 = 22.2 y) from their secular equilibrium values have been used by marine chemists to determine the removal rates of these radio- nuclides from the ocean. The residence time of 2’oPb, derived from 2’oPb/Z”Ra d&equilibria, ranges from a few years in the surface ocean to 50 y in the deep sea (BACON et al., 1976; CRAIG et al., 1973; NOZAKI and TSUNDGAI, 1976: CHUNG and CRAIG, 1983). The dis- tribution of “‘Pb in the deep ocean appears to be influenced by boundary scavenging processes. The removal rate of *“Pb is higher in coastal ocean areas with high primary productivity and Mn-rich particles. Reducing conditions, found in anoxic water columns and sediments, have also been proposed to be efficient sites of boundary scavenging for “‘Pb (SPENCER et al., 1980, 198 I ).
Although both *“PO and 2’“Pb are particle reactive, the geochemical mechanisms that are responsible for their fate in marine environments are different. Previous measurements of “‘PO and 2’%‘b in oxygenated seawater showed that biological uptake may be more important than inorganic adsorption for z’“Po scavenging (FESHER et al., 1983; 1795
KADKO, 1993), while the opposite is true for 2’0Pb (BACON et al., 1976; SPENCER et al., 1980; SHANNON et al., 1970).
The scavenging mechanisms of *“PO and ““Pb in anoxic basins are further complicated by the particle recycling resulting from the change in redox conditions from oxic to anoxic seawaters. The most dynamic region in the water column of anoxic basins is found at the oxic/suboxic/anoxic interface layer where manganese and iron are rapidly recycled between oxidized solid and reduced soluble forms (SPENCER and BREWER, 197 I; SPENCER et al., 1972; LEWIS and LANDING, 1991). The insoluble iron and manganese oxyhydroxides scavenge particle-reactive elements like lead and thorium, and convey the adsorbed elements downward to the deep layer where they are released back to seawater through reductive dissolution. In addition, Pb( II) can form insoluble solid sulphides, which may result in faster removal of “OPb from anoxic seawater.
BANDOV, 1990; VINCCRADOV, 1991). MURRAY et al. 1994 sum- marized the density values of the main water column features in the 1988 R/V Knorr pump cast dataset and these are given in Table I. Here the distributions of *“Pb and “‘PO will be discussed in terms ofdensity rather than depth. This will make it easier to compare data from different stations and to discuss the distributions in terms of reaction zones. This approach removes the variability due to the natural oscillations in time and space of the depth of different density surfaces.
There have been some studies ofthe distribution of 2’0Po and 2’0Pb in anoxic marine environments. BACON et al. ( 1980) measured the distribution of dissolved and particulate “‘Pb and “‘PO in the anoxic Cariaco Trench. They found the Cariaco Trench to be an effective sink for *‘Fb. Excess *‘% activities were present in the upper 300 m, probably reflecting a source at the boundaries of the basin. TODD et al. ( 1986) presented profiles ofdissolved *“PO, “‘Pb, and 226Ra from the Orca Basin in the Gulf of Mexico. One of their most striking results was the extremely high activity of”‘Po, *“Pb, and 226Ra found at the oxic/anoxic interface. They suggested that recycling of Mn and Fe oxyhydroxides and decomposition of biogenic particles were both responsible for these anomalously high activities. HARADA et al. ( 1989) also observed excess *“PO in sulfide containing groundwater samples. They proposed that polonium cycling was related to the sulfur cycle.
The oxic/suboxic/anoxic interface in the Black Sea can be de- scribed in terms of a sequence of oxidation-reduction reactions in- volving oxygen and species of nitrogen, sulfur, carbon, manganese, and iron (TUGRUL et al., 1992; SAYDAM et al., 1993; MURRAY et al., 1994). While characteristic features in the water column profiles occur at different depths at different locations, they tend to always be associated with rhe same density layer ( VIN~GRADOV and NAL-
Seawater was collected using 30 L Niskin bottles mounted on a CTD rosette during R/V Knorr cruise 134 to the Black Sea in June 1988 (MURRAY and IZDAR, 1989). All of the Niskin bottles had Teflon coated stainless steel springs. The locations of two sampling stations are shown in Fig. 1. Station BS3-2 was near the center of the western gyre, and BS3-6 was in the middle of the Black Sea be- tween the eastern and western gyres. About 18 L of each sample was pressure filtered (at 12 p.s.i.) through preweighed 0.45 pm Nuclepore filters. The manifold of the N2 gas line was connected directly to the Niskin bottle to form a closed system to prevent contact between the sample and air. This prevents oxidation of those samples taken from the H2S containing layer. Filtration was typically completed within one to three hours. The Nuclepore filters were rinsed with 20 mL of deionized water under slight vacuum to remove seasalt and stored in a petri dish for later analyses of particulate *“Pb and “‘?o. Samples for 226Ra analyses were collected using 270 L stainless steel Gerard barrels or 30 L Niskin bottles. Samples were processed on board ship, according to the MnOz coated fiber method of MOORE ( 1976). The MnOz fibers were stored in plastic bags for later analyses and the results were reported by O’NEILL et al. ( 1992).
The filtrate from the 2’0Pb/Z’oPo sample was acidified with about 20 mL concentrated HCI and spiked with 2.2 dpm of *09Po (ORNL P-209). stable lead, and 50 mg of Fe carrier. The samples were bubbled vigorously with compressed air for at least 12 h to achieve isotopic equilibration and to purge H2S(g) from the sulfide-containing sam-
METHODS 46’ N ,_ ._ I E ._ . ._ I ROMAN/IA
2
TURKEY 26-E 28. 30’ 32. 34* 36’ 4iFIG. 1. Map of the Black Sea with the locations of the two sampling stations, BS3-2 and BS3-6, during Leg III of the 1988 Knorr Black Sea Expedition. The nominal station coordinates were BS3-2; 42”50’N, 32”OO’E; BS3-6: 43”04’N, 34”OO’E.
Table 1.
2’0Pb and “‘PO in the Black Sea
Density (or) values of characteristic features in the water column profiles
determined from the 1988 R/V Knorr pump profile data. The density values of all of these features except the shallow PO4 maximum have a range of about 0.05 density tits.
1797
FEATURE DENSITY
P043+ shallow maximum 15.50 (broad density range)
Oz<lOuM 15.65 N03- maximum 15.40 Mm < 2OOnM 15.85 Particulate Mn maximum 15.85 P043- minimum 15.85 Non- maximum 15.85 NO3- < 0.2 pM 15.95 N&+ > 0.2 /.LM 15.95 Fed < 10 rtM 16.00 H#>luM 16.15
PO4 deep maximum 16.20
pies. Concentrated NH40H was then added to raise the pH to about 8 to precipitate Fe( OH )r . The Fe( OH )3 precipitate was centrifuged and stored in polypropelyene bottles for analyses in the lab.
The Fe(OH)r precipitate was dissolved in HCl acid, digested with HNO,, and 2’t’Po and *OgPo were spontaneously plated onto 1 cm2 silver plates following FLYNN ( 1968). The particulate samples col- lected on the Nuclepore filters were dried in a desiccator and weighed to estimate the concentration of total suspended matter (TSM). The filters were then decomposed and digested following the procedures of ANDERSON and FLEER ( 1982 . j. , The *“PO and 2osPo were mated onto silver discs. HARADA et al. ( 1989) have shown that in some types of samples the *09Po tracer does not equilibrate fully with the natural *‘ho, and that some of the natural polonium fails to copre- cipitate with iron. For this reason. our results should be considered Fe-scavengable polonium.
The sample solutions were stored for at least 1 y to let “‘PO grow in from 2’oPb. About 2.5 dnm “‘PO. which was calibrated against the ‘OpPo standard used in the first plating, was added into the solution and all the three polonium isotopes were plated onto a silver disc. The addition of 208Po yield tracer prevents contamination from the residual 209Po and “‘PO activities which were not quantitatively re- moved from the samples during the initial plating. In fact, all the silver discs from the second plating were found to have a significant amount of residual 2’oPo.
The silver discs were counted by alpha spectromett-y (EG&G Ottec 576). The chemical yield of 2’oPb was determined by measuring stable lead using flame atomic absorption spectrophotometry. The ranges of chemical yield for lead are about 80% for dissolved samples and >97% for particulate samples. The procedures used to calculate the activities of 2’oPo and “‘Pb can be found in WEI (1990).
Modified Moss Landing Marine Lab (MLML) pit-type sediment traps (KNAUER et al., 1979; MARTIN et al., 1987) were deployed on a free-floating mooring line at locations near the water column sam- pling stations, BS3-2 and BS3-6. The sediment traps were deployed at three depths (40, 75, and 150 m) to get direct measurements of the vertical fluxes of total mass, “‘Pb and “‘PO in the chemically contrasting oxic, suboxic, and anoxic zones. Each trap had a cross- sectional area of about 50 cm2. The duration of deployment at each station was about three days,
The trap solutions were prepared by adding about 800 g of NaCl and about 60 mL of 37% formaldehyde to 20 L of filtered (0.45 pm Millipore) subsurface seawater taken near the trap deployment lo- cations. The trap solutions used for the deep sediment traps, deployed in the sulfide-containing seawater, were bubbled overnight using NZ gas to remove oxygen. Upon recovery, the upper layer of seawater in the traps was siphoned off and the remaining trap solution was
gravity-drained through a preweighed 47 mm Nuclepore filter (0.45 grn pore size) mounted on the bottom of the trap. The filters were rinsed with about 10 mL of deionized water, under a slight vacuum, to remove sea salt. Zooplankton swimmers were carefully picked by hand. Only the traps deployed in the oxic zone were found to have zooplankton swimmers and there were less than ten per trap. The filters were dried in a desiccator at room temperature and weighed to estimate the total mass flux. Three trap samples from each depth were combined for the analyses of “‘Pb and “‘PO. Total 2’oPo and “OPb activities on the trap filters were determined by the same pro- cedures used for the particulate samples.
RESULTS
The concentrations of total suspended matter and activities of dissolved and particulate *“Pb and 2’oPo at stations BS3- 2 and BS3-6 are given in Table 2. The hydrographic and nutrient data from CTD and pump casts are available in WHITE et al. ( 1989) and CODISPOTI and FRIEDERICH ( 199 1). One of the striking findings from the 1988 Knorr expedition to the Black Sea was the ubiquitous suboxic zone ([O,] < 10 PM). The depth ranges of the suboxic zone observed at BS3-2 and BS3-6 were 50-95 m and 70-120 m, respec- tively. The density range was the same for both stations and extended from sigma-t = 15.65, where O2 decreased to less than 10 PM, to sigma-f = 16.15, where H2S increased to greater than 1 WM (Table 1). Throughout this paper, oxic, and anoxic zones ( HZS zone) are designated to represent the water column above and below the suboxic zone.
Dissolved and Particulate 2’0Pb
Dissolved and particulate *“Pb and *“PO and total sus- pended matter are plotted vs. density in Figs. 2 and 3. The upper and lower boundaries of the suboxic zone are indicated in the figures. Dissolved 2’oPb is enriched in the surface water of both BS3-2 and BS3-6. The activity of dissolved *“Pb decreases from the oxic to the anoxic layer. At BS3-2 dissolved *“Pb decreases continuously across the suboxic zone to a low activity (< 1 dpm 100 L-‘) near the suboxic/anoxic bound- ary, while at BS3-6 it has a small maximum in the middle
Table 2. Depth, cast number, potential density, total suspended matter (TSM). concentration, dissolved (DPb) and particulate (PPbf 21%‘b, and dissolved (DPo) and particulate (PPo) 21oPo collected in June 1988 from the Black Sea. Standard deviation are based on propagated counting error. (* lo).
Depth Cast# Sigma TSM DPb PPb DPO PPO
m Theta mg/l dpmll00 I dpm/lOO I dpm/lOO I dpm/lOO I
BS3-2 10 Ii1 20 Hl 30 Hl 40 H4 45 H4 50 H4 55 H6 60 H6 65 H6 70 HQ 75 i-i9 80 H9 85 Hi2 90 HI2 95 H12 100 H13 105 HI3 110 HI3 115 H16 120 Hi6 130 H16 140 Ht7 170 Hi7 200 H17 400 H18 600 tit8 800 H18 1200 H20 1600 HZ0 2076 HZ0 BS3-6 5 H17 15 H17 30 H17 50 H14 65 H14 70 H14 75 H12 80 H12 85 H12 SO HlO 95 HlO 100 HlO 105 H9 110 H9 115 HQ 120 H7 125 H7 130 H? 150 H5 180 H5 250 H5 500 H3 800 H3 1500 H3 2155 Hl 2165 Hi 2175 HI 13.19 13.71 14.02 14.67 14.91 15.28 15.41 15.45 15.71 15.82 15.95 15.99 16.11 16.13 16.21 16.26 16.28 16.28 16.36 16.39 16.44 16.49 16.60 16.69 16.97 17.10 17.17 17.21 17.22 17.22 12.50 0.19 6.98k 0.39 0.78f 0.05 13.43 0.16 5.51* 0.31 0.741 0.05 14.16 0.21 4.805 0.24 0.50+ 0.04 14.72 0.07 1.49f 0.09 1.17f 0.09 15.38 0.10 0.97f 0.08 0.43f 0.03 15.56 0.07 0.65f 0.05 0.24f0.02 15.62 0.10 1.44f 0.10 0.54f 0.03 15.74 0.18 0.76f 0.06 0.6OjI 0.04 15.86 0.05 1.01* 0.07 0.53f 0.03 15.93 0.04 2.41f 0.14 0.26f 0.02 15.99 0.06 1.49* 0.11 O.lSf 0.02 16.08 0.07 1.28f 0.10 0.93f 0.06 16.08 0.07 1.22f 0.08 0.85rt 0.06 16.14 0.09 0.671t 0.07 1.56f 0.09 16.20 0.07 0.87f 0.06 2.03f 0.13 16.27 0.07 0.831t 0.07 2.66k 0.16 16.31 0.06 0.6Ok 0.06 2.66+ 0.21 16.33 0.07 0.56i 0.05 2.48f 0.15 16.43 0.07 0.73i 0.07 2.48f 0.16 16.55 0.07 0.88i 0.08 2.19f 0.12 16.74 0.06 1.06f 0.09 1.70f 0.12 17.02 0.03 0.86f 0.06 2.54f 0.15 17.16 0.04 1.82f 0.20 2.19f 0.13 17.22 0.04 1.27+ 0.21 2.62+ 0.17 17.221 0.03 1.15+ 0.08 2.25+ 0.14 17.221 0.03 1.50* 0.10 2.38f 0.15 17.221 0.02 1.251+ 0.08 2.575 0.16 0.57 0.25 0.24 0.12 0.13 0.16 0.04 0.06 0.11 0.12 0.17 0.15 0.11 0.10 0.01 0.06 0.03 0.05 0.04 0.09 0.06 0.11 0.06 0.07 0.06 0.08 0.04 0.14 0.05 ll.SOf 0.51 7.74f 0.34 21.88f 1.10 7.74f 0.42 4.412 0.25 2.77f 0.15 4.42f 0.22 3.37f 0.18 3.35t 0.20 2.67k 0.16 1.96f 0.11 2.04f 0.12 0.64k 0.05 0.822 0.05 0.92f 0.05 0.94t 0.05 0.864 0.05 1.13i 0.06 0.554 0.03 0.5ort 0.03 0.581: 0.04 0.82f 0.04 0‘88f 0.05 0.86& 0.04 1.21f 0.06 1.31f 0.08 1.21f 0.06 1.2Ok 0.06 1.27f 0.07 2.97?r 0.15 1.17+ 0.08 0.36+ 0.02 0.52f 0.03 1.29+ 0.07 1.68f 0.08 1.74f 0.09 1.37zt 0.08 1.73io.10 0.651t 0.04 0.73f 0.04 l.Olf 0.06 2.34+ 0.11 2.61i 0.16 3.531 0.19 2.79+ 0.15 2.95f 0.14 3.31* 0.19 3.41-k 0.22 2.611: 0.14 2.741t 0.14 2‘22f 0.10 2.49f 0.13 2.332 0.12 2.34+ 0.13 2.55f 0.13 3.04f 0.17 2.43+ 0.13 2.77i0.15 2.12f 0.11 2.20f 0.12 1.94f 0.09 15.05rt 0.89 2.40+ 0.12 2.53f 0.12 1.50f 0.07 2.18f 0.10 2.06f 0.10 3.895 0.17 2.89f 0.14 l.llf 0.05 4.29+ 0.21 3.90f 0.20 3.771 0.20 3.54+ 0.16 2.79f 0.23 2.99f 0.15 3.44f 0.21 2.58f 0.14 2.36f 0.15 2.91f 0.17 4.102 0.43 2.16f 0.16 2.00f 0.11 2.67f 0.22 2.25zt 0.13 3.30? 0.16 2.21f 0.21 2.35+ 0.19 3.221t 0.29 3.98f 0.31 1.69f0.13 3.06& 0.25 1.03f 0.10 0.61f 0.04 0.60f 0.06 0.61f 0.08 0.38f 0.06 0.56rt 0.06 0.78f 0.08 1.02f 0.10 1.17f 0.12 0.792 0.09 2.06f 0.22 1.92f 0.25 1.59f 0.14 2.265 0.21 1.57f 0.54 2.171t 0.79 1.56f 0.17 2.57i 0.14 2.512 0.18 2.02f 0.20 2.28+ 0.30 2.43f 0.16 2.08f 0.15 2.22f 0.14 1.57+ 0.13 0.31f 0.04 0.57f 0.05 0.62-k 0.06 5.96f 0.29 4.12f 0.25 19.18f 0.91 29.48f 1.53 11.69f 0.67 11.28f 0.62 10.53k 0.62 8.31f 0.52 11.40f 0.54 15.11 f 0.56 13.21f 0.51 25.33k 0.77 12.85f 0.41 20.33f 0.71 6.341t 0.35 7.70f 0.48 5.18f 0.31 7.60f 0.51 4.37f 0.29 7.61F 0.46 5.15f 0.33 5.33k 0.31 3.53rt 0.19 5.15f 0.24 13.06f 0.76 13.47f 0.72 7.33f 0.38 9.08f 0.42 2.09f 0.10 2.24f 0.12 2.69f 0.15 1.70f 0.09 2.68f 0.14 2.00f 0.10 5.77* 0.34 5.092 0.28 7.72f 0.46 3.06k 0.21 4.90+ 0.21 4.75-1 0.21 4.081t 0.22 4.35f 0.22 4.97f 0.32 5.564 0.29 6.261t 0.23 3.982 0.18 4.74f 0.25 5.69* 0.22 5.25+ 0.32 3.621t 0.20 7.4Ort 0.46 10.53-f 0.51
14.5 $ Ii '5'o oxic n h; 15.5 16.0 16.5
““Pb and 2’oPo in the Black Sea 1799
(b)
Pb-210 (dpm/lOO I) (Cl PO-210 (dp&lea I)
.I 1 10 loo 12.5 ‘.’ 853-2 130 .1 1 10 100 12.5 - 853.2 14.5 E p 15.0 2 F; 15.5 16.0
FIG. 2. Vertical distributions vs. density (sigma theta) of (a) total suspended matter (TSM) and (b) dissolved (open circles) and particulate (solid circles) Z’“Pb and (c) dissolved (open circles) and particulate (solid circles) “‘PO at BS3-2. The uncertainties, based on the propagation of counting errors, are smaller than the symbols. The upper and lower bounda~es of the suboxic zone are represented by the horizontal lines.
of the suboxic zone. Dissolved 2’0Pb increases slightly with density in the deep sulfide layer.
Overall, the verticat profiles of particulate “‘Pb show a mirror image to those of dissolved *“Pb. From the surface to the bottom boundary of the suboxic zone, the particulate ?“Pb activities are lower (<2 dpm 100 L-’ ) than the dissolved “‘Pb activities. There are two common features in the dis- tribution of particulate “‘Pb at both stations. There is a min- imum at sigma-t = 16.0 f 0.1, which is about the density where dissolved Mn (a; = 15.85) and Fe (cr, = 16.00) start to increase rapidly. There is a broad maximum, of small magnitude, centered at (J, = 16.30 + 0.05 which is just below the first appearance of sulfide at (T, = 16.15. The crossover
between dissolved and particulate “‘Pb occurs at the bottom of the suboxic zone.
Except for a single point near the seawater-sediment in- terface at BS3-2, all the pa~iculate 2’DPb activities in the deep water exceed the dissolved “‘Pb activities, and the particulate “‘Pb in the deep H2S zone shows a relatively constant activity of about 2.5 dpm 100 Lb’.
Dissolved and Particulate 2roPo
The activities of dissolved “‘PO are less than those of dis- solved 210Pb in the surface euphotic zone at both stations. This deficiency exists to the depth of the upper layer of the
(a)
TSM (mt$Q (b) Pb-210 idpnJlO0 If (Cl PO-210 (dp~l~ 1)12.5 13.0 13.5 oxic 16.5 17.5 ' 17.5 _l
FIG. 3. Vertical distributions vs. density (sigma theta) of (a) total suspended matter (TSM), (b) dissolved (open circles), and particulate (solid circles) “%‘b, and (c) dissolved (open circles) and particulate (sohd circles) *‘*PO at BS3-6. The unce~iRties, based on the propagation of mounting errors, are smaller then the symbols. The upper and lower boundaries of the suboxic zone are represented by the horizontal lines.
suboxic zone and decreases with increasing density (Figs. 2, 3). Below the lower layer of the suboxic zone, the activity of dissolved *“PO is higher than that of dissolved *“Pb.
There are significant differences in the distribution of par- ticulate *“PO in the oxic and suboxic zones of BS3-2 and BS3-6. At BS3-2, a low particulate *“PO activity (t2 dpm 100 L-‘) was observed in the oxic layer and a sharp increase in particulate *“PO was observed at a of of approximately
15.0. Particulate “‘PO activity in the suboxic and upper H2S zones varied from 7 to 30 dpm 100 L-’ , and remained higher than dissolved “‘PO. There is a maximum in particulate *“PO at (TV = 16.30. In contrast, at BS3-6, particulate “‘PO is en- riched in the surface layer (7- 13 dpm 100 L-’ ) then decreases to about 2 dpm 100 L-’ in the upper part of the suboxic zone. A small maximum of particulate *“PO, of about 7.5 dpm 100 L-’ was observed to be centered at uI = 16.15.
At both stations, a relatively constant activity (3-5 dpm 100 L-l) of particulate “‘PO was found in the H2S layer. It should be noted that particulate “‘PO tends to increase in the bottom boundary layer. This feature is especially clear from the three samples taken at 10, 20, and 40 m above the bottom sediments at BS3-6.
Fluxes of “‘Pb and “‘PO in the Upper 150 m
The fluxes of total mass, *“Pb, “‘PO, the specific activities of *“Pb and “‘PO, and the 2’0Po/2’oPb ratio in trap particles are given in Table 3. Vertical variations of the fluxes of total mass, “‘Pb, and “‘PO are shown in Fig. 4. The flux data are plotted vs. depth rather than density because the traps were deployed for three days. Equivalent density values can be estimated by comparison with the data in Table 2. Values of the mass flux were obtained from the 234Th traps ( WEI and
MURRAY, 1992) as well as the 2’oPb/2’oPo traps (Table 3)
and all values are shown in Fig. 4a. The mass fluxes are sys- tematically higher at BS3-2 than at BS3-6 by a factor of about 2. The fluxes at BS3-2 exhibited a maximum at 75 m while those at BS3-6 decreased continuously with depth to 150 m. In general, there is excellent agreement between the mass fluxes obtained from the 234Th and *“Pb traps.
The “‘Pb fluxes decreased from 13 dpm m-* d-’ at 40 m to 9-10 dpm me2 d-’ at 150 m. BS3-2 had almost the same 2’oPb fluxes as BS3-6. 2’oPo fluxes show larger variability than those for *“Pb. At BS3-2, a maximum was found in the sub- oxic zone while the 2’oPo fluxes at BS3-6 are systematically larger and increased monotonically with depth. In contrast to the total mass fluxes, there was a higher *“PO flux at BS3-6 than BS3-2. It should be noted that the *“PO fluxes are lower than the *“Pb fluxes in the oxic layer, while in the suboxic and H2S zones, *“PO fluxes were either equal to or larger than the *“Pb fluxes.
The 234Th fluxes were presented by WEI and MURRAY ( 1992) and have a depth distribution similar to the *“PO flux at BS3-2. BUESSELER ( 199 1) argued that the measured 234Th fluxes using drifting sediment traps were larger than model- predicted 234Th fluxes by a factor of 2-3 because of over- trapping by the drifting traps. This suggests that the fluxes for *“Pb and 2’oPo may be upper limits. The good agreement between the mass fluxes for the 234Th and 2’0Pb traps suggests that if hydrodynamics cause overtrapping, it does not intro- duce much variability.
DISCUSSION
Effect of Redox State on Partitioning of “‘Pb
The fractionation of *“Pb between dissolved and partic- ulate phases in the Black Sea is strongly influenced by the redox condition of the water column (Figs. 2, 3). From the
Table 3.
BS3-2
Vertical fluxes of total mass, 21ePb, and 210Po determined from sediment trap samples collected in the Black Sea in June 1988. Standard deviations of total mass fluxes are based on the three measurements from the same depth. Standard deviations of the 2%‘b and 21oP o activities are calculated as the ratio of 2toPb and 210Po fluxes to total mass fluxes.
Depth Mass Flux Pb210 Flux Po210 Flux Pb210 PO21 0 Po210/Pb210 m mglm2ld dpmlm2ld dpmlm2Id dpmlg dpmlg
36 580 + 133 13.2f 1.2 9.0 f 0.5 22.5f 5.5 15.3f3.6 0.68 71 731 f 262 10.8f 1.0 12.2 * 0.5 14.8f 5.5 16.7f6.0 1.13 146 363f 117 0.7f 1.0 8.0 f 0.4 23.9f a.2 21.9f7.1 0.92
BS3-6
Depth Mass Flux Pb210 Flux Po210 Flux Pb210 PO210 Po2101Pb210 m mglm2ld dpmlm2Id dpmlm2Id dpmlg dpmlg
40 310f 46 13.0f 1.2 11.7f 0.5 42.0f 7.3 37.6f 5.0 0.89 75 240 f 66 10.4f 1.0 13.6 f 0.6 43.3f 12.7 56.7+ 15.0 1.31 150 112f a 9.8f 1.0 16.6 f 0.9 07.lf 10.8 148.5f13.0 1.71
2foPb and 2’oPo in the Black Sea 1801 0 20 40 60
9
3
so 9 Ial 120 14c 16( 181 2a0 2ou 4ca 600 so0 looo 1:
-o- BS3.2PbiPoTrap - BS3-6PLvPoTmp - 813-Z Th Trap - BS3.6ThTrap vb JPPO Flux dpm m-zd -*
z
g$gjg
-o- PO-2lOfJs3-2 - PO-21oBs3.6 200 ’FIG. 4. (,a) Vertical profiles vs. depth of total mass fluxes at BS3-2 (open circles) and 3S3-6 (solid circles). Mass fluxes from Th traps collected on the same array are also shown (from WEI and MURRAY, 1992). Error bars are standard deviation (i 1 u) of the mass fluxes measured by three traps deployed at the same depth. (b) Vertical profiles vs. depth of *rOPb (circles) and *“PO {squares) fluxes at BS3-2 (open symbols) and BS3-6 (solid symbols). Error bars are the uncertainties based on the propagated counting errors (2 lo).
surface to the lower portion ofthe suboxic zone at uL = 16.15, ““Pb is mainly found in the dissolved form, while particulate *‘OPb dominates the total concentration in the suifide-con- taining deep water. This type of distribution was also observed in the Cariaco Trench (BACON et al., I980); however, par- ticulate “*Pb in the H2S zone of the Black Sea generally has higher concentrations.
Dissolved “‘Pb activities in the oxic and suboxic layers show a significant geographic variation. There is about twice as much dissolved 2’0Pb in the oxic and suboxic layers at station BS3-2 than at BS3-6. This may be due to differences in horizontal advective transport from the margins of the Black Sea or differences in the scavenging rate. Based on only two profiles, it is difficult to determine which of these is re- sponsible.
The vertical variation of the fraction of “‘Pb associated with particulate phases is shown in Fig. 5. in the surface Iayer only about 10% or less of the *‘*Pb is filterable. This value is lower than the corresponding value of 20% observed in the Cariaco Trench (BACON et al., 1980). The percentage as par- ticulate *“Pb increases to 20-40% in the upper part of the suboxic zone where the concentrations of particulate man- ganese and iron are higher. This percentage drops to a min- imum at (rl = 15.95, then increases sharply to values of 80% in the anoxic zone.
Dissolved manganese and iron start to increase at (rl = 15.85 and c, = 16.00, respectively (Table I), suggesting that the upward flux of dissolved iron is removed at a deeper layer than that of manganese, Changes in the gradient are the best indicator of reaction zones ( SHOLKOVITZ, 1992) and the removal zones of dissolved manganese and iron are clearly separated. The slightly elevated concentrations ofdis- solved manganese and iron above these reaction zones either reflect less than 100% efficient removal of the vertical flux, a horizontal flux from the boundaries, or internal recycling. Potential oxidation rates of Mn (II) were measured by TEBO et al. ( 199 1) and high values were found at all depths in the suboxic zone. Maximum values were observed at u, = 16.1 and @t = 15.75. Both layers correspond approximately to maxima in particulate manganese (LEWIS and LANDING, 199 I ) . The deeper maximum contains oxidized manganese, however, the shallower maximum does not. TEBO ( 199 1) has shown that manganese oxidation rates are much higher at the margins than in the interior of the basin, but there is no agreement about the relative importance of in situ vs. horizontal transport for creation of either of these maxima (see also KEMPE et al., 199 1; LEWIS and LANDING, 199 1).
The high concentrations of particulate manganese and iron generally coincide with high particulate 2ioPb. The resolution in the dataset is not sufficient to determine whether man-
PPbmPb, % PPblTPb, % 16.0 16.5 - PPbmPb (a) BS?-2 oxic 17.5~‘~““‘~‘~‘~~~“‘~~’ 17.5 y 0 5 IO I5 20 25 30 35 40 45 50 0 5 IO 15 20 25 30 35 40 45 50 12.5 16.0 16.5 (b) BSC-6 - PPbfI’Pb - PMn oxic PMn, nM PMn, nM
FIG. 5. Vertical distributions vs. density of the ratio of particulate "'Pb to total “‘Pb at BS3-2 (a) and BS3-6 (b). The particulate manganese data ( PMn) of LEWIS and LANDING ( 199 I ) is also shown (solid symbols).
ganese or iron oxides are more important, but it does appear that metal oxide scavenging does play a role in removing dissolved “‘Pb. The particulate manganese data (from LEWIS and LANDING, 199 1) is shown in Fig. 5. Particulate iron is not shown, because no recycling signal can be seen super- imposed on the high background levels.
In the upper part of the sulfide-containing deep water (at CT~ = 16.30) about 80% of the *“Pb is associated with partic- ulate matter. Because of the slight increase of dissolved *“Pb with density (Figs. 2, 3), the ratio of particulate to total (PPb/ TPb) decreases from 80% at upper portion of the H2S zone to 60-70% toward the bottom. In the deep, open ocean, the PPb/TPb ratio is usually less than 0.05 (BACON et al., 1976). This large difference in the fractionation reflects the tendency of lead to adsorb on and/or precipitate as sulfide phases in anoxic waters.
Residence Time of 210Pb
The activity of dissolved 2’0Pb in seawater is determined by atmospheric *“Pb input, in situ production from 226Ra, radioactive decay. and scavenging processes. In order to derive residence times of dissolved and particulate *“Pb, the at- mospheric “‘Pb flux and the 226Ra source functions have to be known.
Dissolved *“Pb is enriched in the surface layer and de- creases sharply through the pycnocline (Figs. 2,3). This sur- face enrichment is typically found in the open ocean, and is a result of atmospheric input (BACON et al., 1976). The in- fluence of atmospheric “‘Pb fluxes is limited to the surface layer because of the strong pycnocline, that begins at ap- proximately 40-50 m. There have been no direct measure- ments of the atmospheric flux of *“Pb to the Black Sea; how- ever, an indirect estimate of the upper limit of this input can be made, as follows.
If we assume the standing stock of 2’0Pb in the surface
layer is maintained at a steady-state concentration, and that riverine and horizontal inputs are negligible, then the at- mospheric flux of *“Pb into the Black Sea must be balanced by a flux out of the surface layer. The 2’oPb fluxes measured by the sediment traps deployed at 40 m at BS3-2 and BS3-6 were about 13 dpm m-* d-’ (0.47 dpm cm-* y-‘) (Table 3). This value is comparable to the atmospheric *“Pb flux in other regions at the same latitude ( TUREKIAN et al., 1977). Hence, for calculation of the residence times of dissolved and particulate *“Pb in the surface layer, we will assume an at- mospheric “‘Pb flux of 13 dpm mm2 d-‘. This should be considered as a first approximation because of the variable distributions and the assumptions stated above.
The in situ production from decay of 226Ra is an important source of *“Pb in the water column, especially for the deep water. The distribution of 226Ra in the Black Sea was deter- mined from the samples taken from crurses 3 and 4 of the
1988 Knorr Expedition ( O’NEILL et al., 1992). The average activities of 226Ra in the surface, suboxic, and deep layers of the central basin of the Black Sea are 6, 25, and 15 dpm 100 L-’ , respectively.
With the known 226Ra distribution and an estimate of the atmospheric *“Pb flux, a simple, irreversible scavenging model (BACON et al., 1980) was used to calculate the residence times of dissolved and particulate *“Pb in the oxic, suboxic, and anoxic layers using the following equations:
aDPb/& = 0 = /‘t + &&ra - &&,r’, - klIDPb, (1)
dPPb/dt = o = k’& - &&Pb - k&b, (2) k, = (xPb(lR, - IDPb) + A)/IDPb, (3)
k2 = (hzDPb - ~Pbh’b)/~PP,,, (4)
TDPb = l/k,, (5)
“‘Pb and “‘PO in the Black Sea I803
where
zRa> IDPb, zppb = Inventories of 226Ra, dissolved “‘Pb, partic-
ulate *“Pb,
xpb = Decay constant of *“Pb (0.0312 y-‘), A = Atmospheric “‘Pb flux (4745 dpm m-* y-’
for the surface box and 0 for the suboxic and anoxic boxes),
k,, kz = Scavenging and removal rate constants of
dissolved 2’oPb and particulate 2’oPb ( y-‘) TDPb, 7PPb = Residence time of dissolved *“Pb and par-
ticulate “‘Pb ( y).
The inventories of 226Ra, dissolved “‘Pb, particulate 2’%, and calculated residence times of dissolved and particulate “‘Pb are shown in Table 4. These calculations have been made in terms of depth rather than density to coincide with the trap depths. In the surface oxic layer (O-50 m), TDPb is mainly determined by the standing stock of dissolved “‘Pb and atmospheric *“Pb flux. If we have overestimated the atmospheric input, the calculated residence time is too high. Only about 2-4% of dissolved *“Pb in the surface layer is produced from the radioactive decay of 226Ra. Residence times of I .2 and 0.5 y are obtained for dissolved *“Pb in the surface layer of BS3-2 and BS3-6, respectively. The average 7DPb of 0.8 y is shorter than the 7DPb of 2.5 y observed for the open ocean (BACON et al., 1976), and is probably due to the larger particulate loads at this time of year in the Black Sea.
It is interesting that rPPb in the surface layer is short (0.1 y ) relative to 7DPb. This implies that the overall rate of re- moval of 2’0Pb from the surface layer of the Black Sea is determined by adsorption or uptake by particles, rather than particle removal. The short value of TPPb is consistent with the residence times of total suspended matter and particulate 234Th, reported previously ( WEI and MURRAY, I992 ).
The rDPb in the suboxic layers of BS3-2 and BS3-6 are 3.3 and 1.9 y, respectively. The shorter TDPb for BS3-6 may be a result of more scavenging phases in the suboxic layer. This is supported by the observation that particulate Mn in
the suboxic zone is several times larger at BS3-6 than at BS3-2 (Fig. 5) (LEWIS and LANDING, 1991). The residence times of particulate 2’oPb are in the suboxic layer (2.6 and 1.5 y for BS3-2 and BS3-6, respectively) are of the same magnitude as those of dissolved *“Pb. Thus, within the suboxic zone, it takes about equal time for *“Pb to be scavenged onto the particulate phases and for the adsorbed 2’oPb to be removed.
Ventilation of the oxic and suboxic layers is thought to be rapid and occur, at least partially, on a timescale of less than one year ( BUESSELER et al., 1991). The variability in the “‘Pb and 2’oPo profiles in the oxic and suboxic layers is prob- ably due to this process. It is very likely that the steady state assumption used in these calculating residence times is not valid but we lack, at present, the data to evaluate this as- sumption more rigorously.
CRAIG et al. (1973) postulated that the removal of “‘Pb from the oxygenated deep water of the open ocean is limited by the rate of adsorption onto particles. In contrast, TSUNOGAI and NOZAKI ( I97 1) and TSUNOGAI et al. ( 1974) argued that the adsorption rate of “‘Pb onto suspended particles should be a fast process, relative to the residence time of particles. In the deep water of the Black Sea, *“Pb is only about 25% of the secular equilibrium values expected from 226Ra. The residence time of dissolved “‘Pb relative to uptake by particles in the deep anoxic zone of the Black Sea is about 3.6 y. The residence time of particulate “‘Pb in the deep anoxic zone, relative to the particle removal rate, is about 8.5 y. This is a factor of about 2.3 longer than the 7DPb. Hence, the particle settling velocity is the determining process for overall removal of *“Pb in the deep water of the Black Sea.
The residence time of dissolved “‘Pb (3.6 y) in the deep water of the Black Sea is comparable to the value of 2 y in the deep Cariaco Trench (BACON et al., 1980), and 1 y in the anoxic hypersaline layer in the Orca Basin (TODD et al., 1986), but is much shorter than the value for the deep open ocean (20-90 y, BACON et al., 1976). The common feature of short dissolved residence times for “‘Pb in anoxic basins suggests that the formation of an insoluble metal sulfide phase is an efficient mechanism for removing lead. BACON et al.
Table 4. Results of the residence times of dissolved (?~pb) and particulate (~ppv,) 2loPb calculated from the mass balance equations and the standing stocks of “6Ra, dissolved 2%%, and particulate 2Wb.
Station
Depth(m) (dp$mz)
BS3-2 BS3-6
Box 1 Box 2 Box 3 Box 1 Box 2 Box 3
(O-50) (50-95) (95-2000) (O-70) (70-120) (120-2000) 3770 10770 266520 3770 10770 266520 IDPb (dpm/m2) 5617 1001 27816 2600 594 26558 IDPo (dpm/m2) 487 731 50850 513 447 48497 ZDPb (year) QTb (year) 1.2 3.3 3.7 0.5 1.9 3.6 0.1 2.6 8.7 0.1 1.5 8.1
(1980) suggested that iron sulfide serves as the carrier phase for “‘Pb in the Cariaco Trench. Particulate iron concentra- tions are high in the deep water of the Black Sea (LEWIS and LANDING, 199 1) and metal sulfides (including pyrite) form in the water column (MURAMOTO et al., 1991; PILSKALN,
199 1). This supports the hypothesis that iron sulfide also acts as a carrier phase for the “‘Pb in the anoxic layer of the Black Sea.
In contrast to the fate of *“Pb in the oxic layer, particle settling seems to be the limiting factor for the geochemical cycling of “‘Pb in the anoxic layer. It takes about 3.6 y for 2”‘Pb to be scavenged onto particulate matter and longer than 8 yrs for adsorbed ““Pb to settle to the bottom sediments. This requires a 2’0Pb flux of about 16 dpm mm2 d-’ and a particle settling velocity of about 240 m y-l. This flux is slightly higher than the “‘Pb flux measured at the bottom of the euphotic zone ( I3 dpm mm2 d-’ ) which in turn is assumed to be an indirect estimate of the atmospheric “‘Pb flux into the Black Sea. The amount of 2’0Pb conveyed to the sediments by settling particles is large enough to balance the source from the atmosphere. This conclusion is different from the open ocean where the sinking particles do not carry enough *“Pb to balance the removal fluxes calculated from the 2’oPb/ 22hRa disequilibrium (BACON et al., 1976). BACON et al., 1976) suggested that 2’0Pb must be transported to ocean boundary sites and scavenged there. The calculations given above suggest that anoxic basins, like the Black Sea, can serve as such boundary scavenging sites.
“‘PO Scavenging
Polonium is also a particle reactive element, but its geo- chemical pathways appear to be different from lead. IS&AR- KAR et al. ( 1976) measured the activities of a number of radionuclides associated with marine zooplankton and found that the degree ofenrichment follows the order of PO B Pb
DPoIDPb DPo/DPb 0 I 2 3 4 5 6 7 i ~ ‘, s ~ ” + ‘I’ ’ I I I I I I I _. B - 0 , 5 15.0 I oxic z 15.5 - I F; , h 16.5 16.0 - 16.5 _ 17.5 853-2 (a)
= Th > Ra z U. FISHER et al. ( 1983) observed that “‘Pb is associated almost exclusively with exterior cellular structural ~om~nents (cell walls and plasm~emmae), while 2’oPo is associated with interior cellular organic compounds. As a result “‘PO should be recycled more like a nutrient element. KHA~KAR et al. (1976) and FISHER et al. ( 1983) concluded that polonium behaves more like the nutrient elements. Leaching experiments, carried out by MCKEE (1986), sug- gested that ~lonium is preferentially associated with partic- ulate organic carbon, relative to lead. Although polonium has the highest degree of enrichment in zooplankton it also is easily released back to seawater. Field studies by KADKO ( 1993) support a nutrient-like cycling of ““PO. The ease of regenerating *“PO from biological particles typically results in an excess of 2’oPo relative to “‘Pb in the deep ocean. In the Atlantic Ocean, BACON et al. ( 1976) observed a deficiency of dissolved “‘PO, with respect to dissolved “‘Pb in the mixed layer, and an enrichment in the thermocline layer. They at- tributed this to scavenging processes in the surface ocean, followed by regeneration in the subsurface layer.
In the Black Sea the activity of dissolved “‘PO is deficient relative to dissolved 2’oPb in the euphotic zone and the upper portion of the suboxic zone (Fig. 6). The magnitude of the deficiency of dissolved “‘PO in the surface layer is slightly larger at BS3-2 than that at BS3-6. The degree of deviation of dissolved *“PO activity decreases with increasing density at both stations. This indicates preferential scavenging of 2roPo over 2’oPb by the particles residing in the surface layer, which is consistent with previous work showing the preferential up- take of polonium over lead by planktonic organisms ( SHAN- NON et al., 1970; TUREKIAN et al., 1974; NOZAKI et al., 1976; FISHER et al., 1983).
The residence time of dissolved 2’oPo calculated from in- ventories of dissolved “‘PO and dissolved “*Pb in the surface layer is about 150 and 230 days for BS3-2 and BS3-6, re- spectively. A possible explanation for the difference between
sub&c
anoxic 17’* ]
17.5 BU-6 (b)
FIG. 6. Vertical distributions vs. density of the ratio of dissolved *‘*PO to dissoived “‘Pb at (a) BS3-2 and (b) BS3- 6. The upper and lower boundaries of the suboxic zone are indicated by horizontal lines. The vertical dashed line indicates a ratio of 1.
*“Pb and “‘PO in the Black Sea 1805
these two stations is the higher concentration of total sus- pended matter (Figs. 2, 3). Particulate Mn is about 3-5 times higher, and particulate aluminum is about two times higher in the surface layer of BS3-2, relative to BS3-6 (LEWIS and LANDING, 199 1). LEWIS and LANDING ( 199 1) have proposed that these differences are due to the larger influence of fluvial or atmospheric sources at BS3-2, relative to BS3-6.
Particulate 2’oPo is enriched relative to particulate 210Pb in the euphotic zone of BS3-6, while at BS3-2 it appears to be close to secular equilibrium (Fig. 7). The difference may reflect different particle compositions at the two locations. The suspended particles collected in the euphotic zone of BS3-6 contain twice as much organic carbon than at BS3-2 (RADFORD-KNOERY and CUTTER, 1988). Our “‘PO and ““Pb data also suggest that suspended particles from the sur- face layer of BS3-2 may contain larger amounts of terrestrial particles than at BS3-6. If terrestrial particles, like alumino- silicate minerals, dominate the biogenic particles, then the 2’“Po/2’“Pb ratio should be closer to the secular equilibrium value of unity, as observed at BS3-2.
Because 2’oPo is in excess of 2’0Pb below the euphotic zone, we cannot apply the scavenging model to calculate residence times. We can calculate the residence time of particulate 2’oPo, using the trap data. For the upper 150 m the inventories of particulate 2’oPo at BS3-2 and BS3-6 are 13,030 dpm m-2 and 8,058 dpm m-‘, respectively. Using the “‘PO flux values of 8 dpm rn-’ d-’ and 16.6 dpm m-2 d-l, we calculate par- ticulate 2’oPo residence times of 4.5 y and 1.25 y. These values are similar to the particulate 2’0Pb residence times given in Table 4.
The activity of dissolved “‘PO becomes higher than that of dissolved 2’oPb within the suboxic zone at crt = 16.0. This excess dissolved “‘PO activity seems to be a common feature in anoxic basins (Cariaco Trench: BACON et al., 1980; Orca Basin: TODD et al., 1986; Jellyfish Lake, Palau: BURNETT et al., 1989) and is probably due to regeneration from the par-
PPolPPb PPo/PPb 0 5 10 15 20 25 30 12.5 i 1 v1 14.5 _. 1 15.0 ? _ In 13.5 B 16.5 oxic anoxic 853-Z (a)
titles settling from the surface euphotic zone. However, this regeneration can not explain the large amount of excess 2’oPo found in the Black Sea. The amount of excess 2’oPo (about 80 X 10 3 dpm m-‘) requires a source of about 400 dpm my2 d-l. The 2’oPo flux measured in the drifting traps ranged from 8 to 17 dpm mm’ d-‘. No ““PO measurements were made on the moored deep trap samples. Apparently, unsup- ported 2’oPo must be entering into the central Black Sea from other sources. Since there is no systematic trend of the un- supported dissolved 2’oPo with depth, we hypothesize that the large area of shelf and slope sediments around the Black Sea may be the main source of excess 2’oPo in the deep Black Sea.
The value of KD for 2’oPo is much greater than “‘Pb in the euphotic zone, but the values are similar in the anoxic water. The fluff material at the sediment-water interface is extremely enriched in “‘Pb (MOORE and O’NEILL, 199 I), but unfortunately, there have been no “‘PO analyses on these samples.
A maximum of the 2’0Po/2’oPb ratio in particulate samples is evident in the middepth of the suboxic zone of both BS3-2 and BS3-6 (Fig. 7). This peak may be a result of reductive dissolution of particulate Mn in the suboxic zone which re- leases 2’oPb into seawater. Since polonium is preferentially associated with organic phases (MCKEE, 1986), and organic particles are more refractory to reducing conditions than manganese oxyhydroxides, the increase in the 2’oPo/2’oPb particulate ratio in the suboxic zone is due to lower values of particulate 2’oPb, caused by release of lead during reductive dissolution of particulate metal oxides.
Inferences from Sediment Trap Experiments
Total mass fluxes measured at BS3-2 are a factor of 2-4 higher than those at BS3-6 (Fig. 4). Unlike the total mass fluxes, the “‘Pb fluxes show little variation between the two
I
oxic (D 15.5 F; 16.0 16.5 @)FIG. 7. Vertical distributions vs. density of the ratio of particulate *“PO to particulate *“Pb at (a) BS3-2 and (b) BS3-6. The upper and lower boundaries of the suboxic zone are indicated by horizontal lines. The vertical dashed line indicates a ratio of 1.
stations (Fig. 4). This is consistent with the net fluxes esti- mated from the 2’oPb/226Ra disequilibria in the water column, which also showed no difference between the two stations. The correlation between the 234Th flux and total mass flux, reported previously ( WEI and MURRAY, 1992), is not found between the “‘Pb flux and total mass flux. The lack of cor- relation between “‘Pb flux and total mass flux is also observed in the open ocean ( HARADA and TSUNOGAI, 1986). The *“Pb flux decreases monotonically from 13 dpm m-* d-’ at the base of the euphotic zone to about 9 dpm m-* d-’ at 150 m. This decrease implies that settling particles disaggregate into smaller particles, or that the “‘Pb associated with the settling particles is desorbed into seawater because of the presence of dissolved sulfide.
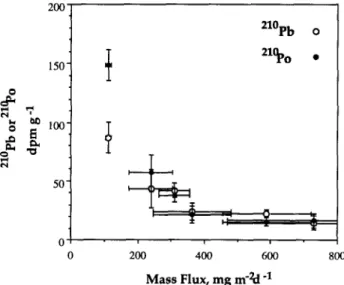
The specific activities of *lo Pb in the settling particles col- lected by the two shallower traps (Table 3) are similar to those of suspended particles. However, the suspended par- ticles in the vicinity of 150 m have substantially higher *“Pb- specific activities than the trap particles (300-400 dpm g-’ vs. 20-90 dpm g -’ ) . This suggests that the particles that settle into the anoxic zone of the Black Sea are formed at shallower depths in the water column.
Even though there is no correlation between the total mass flux and the “‘Pb flux, the specific *“Pb activity decreases exponentially as the mass flux increases (Fig. 8). A similar correlation was also found in the open ocean ( HARADA and TSUNOGAI, 1986). The concentration of *“Pb associated with settling particles may be determined by the residence time of the particles. In other words, the longer the settling particles are in contact with seawater, the more *“Pb can be scavenged. The same argument may also be true for 2’oPo.
The *“PO flux results show some interesting features (Fig. 4). First, the *“PO fluxes measured at all three depths of BS3- 6 are higher than those of BS3-2, while the total mass fluxes have the opposite relationship. Second, the specific 2’oPo ac- tivities of trap particles increase with depth (Table 3). The specific “‘PO activities of trap particles collected at BS3-6 is about 2-7 times higher than those at BS3-2. Third, except
2001 I 2*0Pb o 21%J ’ I 0: I 0 200 4cxJ 600 800 Mass Flux, mg m-h -*
FIG. 8. Correlation between the specific activities (dpm g-‘) of 2“‘Pb (open circles) and *“PO (solid circles) of trap particles and the total mass fluxes.
for the particles collected by the shallowest trap (36 m) at BS3-2, trap particles have a significantly lower specific *“PO activity than suspended particles found at the same depths (Table 3 vs. Table 2). Fourth, the range of 2’0Po/2’oPb ratios in trap particles (0.68-1.71) is much smaller than that of suspended particles (0.5-28) (Table 3 vs. Fig. 7).
Comparative Geochemistries of 2’oPb, *“PO, and *qh Vertical variations of the distribution coefficients of *“Pb, *“PO, and 234Th defined as
K =
[Melpad
D
[Me]diss C, ’ where[ Melpart = activities of particulate *“Pb, *“PO (dpm 100 L-‘), and 234Th (dpm L-l),
[Me]diss = activities of dissolved “‘Pb, *“PO (dpm 100 L-‘), and 234Th (dpm L-‘),
C, = TSM concentration (g mL-‘),
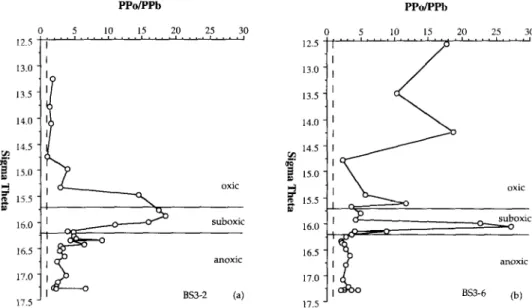
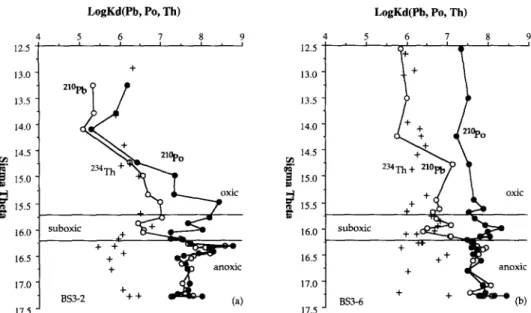
are plotted in Fig. 9. The ratio of distribution coefficients of *“PO and 234Th relative to those of *“Pb are plotted vs. depth in Fig. 10. Since the KD values can serve as a measure of reactivity of a metal with particles, the vertical profiles of KD are useful for describing the interaction of Th, Pb, and PO with particles of different composition.
In general, KD values of 2’0Pb and 2’oPo increase from the oxic euphotic zone to the anoxic deep water. These KD values are smaller in the surface layer of BS3-2 than at BS3-6. The suspended particles in the surface layer at BS3-2, which probably contain more terrestrial particles, are less reactive to both *“Pb and 2’oPo. The ratio of KD values of 2’oPo to 2’0Pb in the surface layer is larger than unity, which implies that *“PO is preferentially scavenged by the particles residing in the euphotic zone.
The KD values of 234Th in the surface euphotic zone ( WEI and MURRAY, 1992) are about lo6 mL g-’ at both stations. The values from thorium do not vary as much as those for lead and polonium, suggesting that thorium scavenging may be less dependent on the composition of particles. Except for a few data points in the euphotic zone of BS3-2, the KD values for *“PO are always lo- 100 times larger than for 234Th. The KD values for 2’oPb are similar to 234Th in the oxic and suboxic zones, and are similar to “‘PO in the anoxic zone.
KD values of both 2’0Pb and 2’oPo (and to a lesser extent 234Th) increase to a maximum at the mid-depth of the suboxic zone ( g1 = 15.5 to 16.0), then decrease to slight minimum in the lower layer of the suboxic zone (of = 16.0 for *“Pb; uI = 16.2 for “‘PO). The redox cycling of manganese and iron metal oxides across the oxic-anoxic transitional layer may be responsible for this variation, because the depth of the maxima coincide with the depth of maximum particulate manganese and iron.
In the deep H2S zone, both *“Pb and “‘PO have similar KD values of about 10’ mL g-‘. The formation of metal sulfide minerals is probably the cause of the high KD of 2’oPb. Lead has well known class B metal tendencies ( STUMM and MORGAN, 198 I ). Higher affinity of B-type metal cations for sulfide particles was confirmed by adsorption experiments
“‘Pb and *“PO in the Black Sea 1807
LogKd(Pb, PO, Th) LogKd(Pb, PO, Tb)
5 6 7 8 9 , f t 12.5 13.0 13.5 14.0 14.5 ~ I. $ 15.0 ? m G 15.5 16.0 16.5 16.0 16.5 17.0 + 853-Z ++ (a) 17.5 17.0 17.5
FIG. 9. Vertical profiles vs. density of the distribution coefficients ( Ko) of “‘Pb (open circles), 2’oPo (solid circles), and 234Th (crosses) at (a) BS3-2 and (b) BS3-6. The upper and lower boundaries of the suboxic zone are indicated by horizontal lines.
total range of TSM concentration is only about 102. Nev- ertheless, good correlations are observed between TSM and the KD values for 234Th, “‘Pb, and “‘PO (Fig. 11). The cor- relation for the anoxic samples (closed symbols) are signifi- cantly different from the oxic/suboxic samples (open sym- bols). The respective regressions and values of r2 are given in the caption for Fig. 11. In all cases, the correlations are worse if the anoxic and oxic/suboxic samples are not distin- guished.
There are interesting patterns in these correlations. The slopes of the TSM correlations for 234Th, “‘Pb, and “‘PO in the anoxic, sulfidic water are the same within the errors of the analysis (- 1.04 + 0.13 for Th, -0.86 + 0.16 for Pb, and using H2S-containing Cariaco Trench sediments (LI et al.,
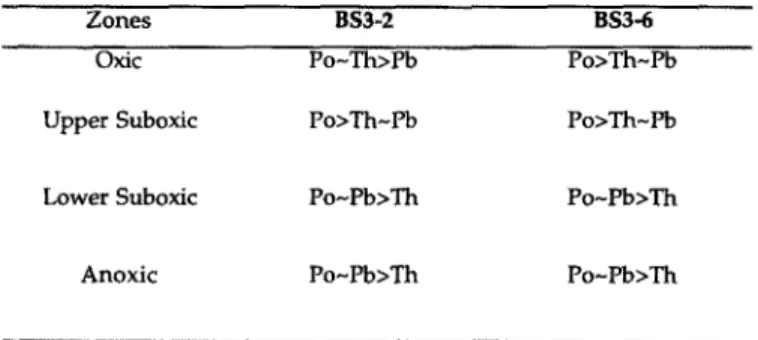
1984). The similarity between the KD values for 2’0Pb and “‘PO suggest that 2’oPo may also form or adsorb on sulfide phases. Polonium is thought to have transition metal char- acteristics, although its chemical properties are less well known (COTTON and WILKINSON, 1966). Thorium is known to be a class A metal ( STUMM and MORGAN, 198 1) and has a lower affinity for sulfidic ligands. As a result 234Th has a lower KD value than “‘Pb and “‘PO. The relative partitioning of “‘Pb, “‘PO, and 234Th to particles residing in different regimes of the water column are shown in Table 5.
While high TSM concentrations tend to be in the oxic zone and low TSM concentrations in the anoxic zone, the
LogKd(Po)/LogKd(Pb) LogKd(Po)lLogKd(Pb) LogKd(Tb)/LogKd(Pb) LogKd(Th)/LogKd(Pb) 0.6 0.7 0.8 0.9 1.0 1.1 1.2 1.3 J 0.6 0.7 0.8 0.9 1.1 t I 1.1 1.2 1.3 I 12.5 16.0 16.5 16.0 16.5 c anoxic (a)
FIG. 10. Vertical profiles vs. density of the ratio of the distribution coefficients of *“PO (open circles) and *)‘Th (crosses) relative to the distribution coefficients of “‘Pb at (a) BS3-2 and (b) BS3-6. The upper and lower boundaries of the suboxic zone are indicated by horizontal lines.
Table 5. Relative affinities of thorium, lead, and polonium to the particles found in different regimes of the Black Sea water column.
Zones BS3-2 BS3-6
oxic Po-Th>Ph Po>Th-Pb
Upper Suboxic Po>Th-Pb Po>Th-Pb
Lower Suboxic Po-Pb>Th Po-Pb>Th
Anoxic Po-Pb>Th Po-Pb>Th
- 1.14 rt 0.16 for PO). The TSM correlations in the oxic / suboxic zones are more variable (-0.50 + 0.11 for Th, - 1.63 +- 0.37 for Pb, and -2.15 + 0.34 for PO).
Negative log K, - log TSM correlations have been pre- viously been observed in laboratory and field data for 234Th, ‘Be, and other elements ( LI et al., 1984; MCKEE, 1986; HONEYMAN et al., 1988; HONEYMAN and SANTSCHI, 1989). Several hypotheses have been proposed for this particle con- centration effect (MOREL and GSCHWEND, 1987) but it ap- pears most likely that coagulation of colloidal size particles plays an important role.
HONEYMAN and SANTSCHI ( 1989) used the correlation of TSM and 234Th in oceanic data to derive a relationship be- tween the mass concentration of colloids ( C,* ) and the mass concentration of filterable particles (C,) expressed as log C,* = 0.7 log C, - 2.6. A similar correlation of TSM and ‘Be in mostly freshwater data led to a relation with a slightly different slope of log C,* = 0.5 log C, - 2.3. The dependency of C: on C, derived from the Black Sea ““Th, “‘Pb, and “‘PO data are summarized in Table 6. The slopes for 234Th, “‘Pb, and 2’oPo in the sulfidic regime are similar, at about
1.0 ;t 0.1. In the oxic/suboxic regimes the slopes are quite different. The Black Sea 234Th data suggest a square root de- pendency (C,* = f( CF’)) similar to the ‘Be-based relation of HONEYMAN and SANTXHI f 1989), but is probably also not statistically different from their slope for 234Th (C,* = f( C’E’)). The oxic/suboxic “‘Pb- and “‘PO-derived re- lations are different from 234Th, but overlap statistically with each other. Their relationships suggest that the concentrations
of colloids increase faster than the concentration of filterable particles (approximately C,* = f( Ci-“) .
According to the Brownian pumping model, the particle coagulation rate and the concent~tion of colloids (C,* ) should be the same for all metals in a given system ( HON- EYMAN and SANTSCHI, 1992). The chemical differences be- tween elements are expressed as the adsorption density (I’,) on colloids, which in turn is a function of the conditional sorption constant on colloids (K,) and the total dissolved metal concentration. The fact that the C,* /C, relations should be the same, but differ for 234Th, “‘Pb, and 2’oPo in the oxic/ suboxic zone, suggests that the values of the conditional sorption constants on colloids (X;) and the filterable particles (K,) vary for these three metals. The relations in Table 6 were derived from the plots of the different elements which means that they reflect the chemical differences ofthese three elements. HONEYMAN and SANTSCHI ( 1989) show that K, is equal to the constant value of KD observed at low concen- trations of C,. The value of Kpc derived in their analysis for Th (about lo’.‘) is consistent with our Black Sea 234Th data. The values of KF for “‘Pb and 2’oPo in the Black Sea must be greater than 108.’ (Fig. 11). The differences in Kpr for these three metals may reflect the roles oxide and sulfide pr~ipitation play in influencing the dist~bution of 2L0Pb and 2’oPo.
These results are intriguing, but are based on a small range in TSM or C,. There have not been the necessary studies needed to quantitatively interpret these results. These include studies of colloidal interaction with metals of different reac-
Table 6 The relationship between the mass off colloidal particles (C”P) and the mass of filterable particles (Cp) derived from the correlations of =Th, 21oPb and 21oPo with TSM (after Honeyman and Santschi, 1989)
2NTh Sulfidic c,* = 1.04(io.13) cp+1.56 fko.97) oxic/suboxic cp* = 0.50(M.l1) cp-2.76 (M.77) 2WJb Sulfidic CP* = 0.86(M.16) CP-1.41 (k1.16) oxic/suboxic c,* = 1.63(&0.37) cp+4.84 (k2.55) 21OPo Sulfidic C,* = 1.14(M.16) CP+O56 (k1.19) oxiclsuboxic CP’ = 2.15(kO.34) Cp+7.57 (k2.38)