Molecular Ecology (2000) 9, 2155 – 2234
Blackwell Science, Ltd
P R I M E R N O T E S
00 00 Graphicraft Limited, Hong Kong
Microsatellite loci for the social wasp
Polistes dominulus
and their application
in other polistine wasps
M I C H A E L T. H E N S H AW *
Department of Ecology and Evolutionary Biology, Rice University, PO Box 1892, Houston, TX 77251–1892, USA
Keywords: Polistinae, social wasps, Vespidae
Received 21 March 2000; revision accepted 29 May 2000
Correspondence: Michael T. Henshaw. *Present address: Department of Entomology, 102 Fernald Hall, University of Massachusetts, Amherst, MA 01003–2410 USA. Fax: (413) 545–0231; E-mail: [email protected]
The social wasps of the genus Polistes are an important model system for understanding the evolution of cooperation. Their relatively simple societies lack the distinct morphological castes which characterize many of the social insects, and newly emerged females possess a variety of reproductive options (Reeve 1991). A female may remain on her natal nest as a helper gaining indirect fitness; usurp a foreign nest and become reproductively dominant; initiate a new nest independently; reproduce on a satellite nest; or initiate a new nest in coopera-tion with other wasps (Strassmann 1981; Reeve 1991; Mead
et al. 1995; Cervo & Lorenzi 1996; Queller et al. 2000). By
characterizing the reproductive payoffs associated with different reproductive strategies, we are better able to under-stand how cooperative societies are maintained.
Recently, microsatellite genetic loci have greatly extended our ability to characterize the reproductive strategies used by social wasps (Hughes 1998; Queller et al. 1993a). Using micro-satellite loci we can reconstruct pedigrees, and estimate relatedness. Using this information, unobserved events such as queen death, nest usurpation or past reproductive domin-ance can be inferred (Queller et al. 1993a,b; Field et al. 1998; Hughes 1998). In this paper, I describe microsatellite loci isolated from the social wasp Polistes dominulus, one of the best studied Polistes species.
We followed published protocols for the isolation of micro-satellite loci (Strassmann et al. 1996) with clarifications and modifications to those protocols as noted below. DNA was extracted from 1 to 1.5 g of pupal thoraces ground in a mortar and pestle which had been chilled in liquid nitrogen. The ground tissue was suspended in grinding buffer (0.1 m NaCl; 0.1 m Tris-HCl, pH 9.1; 0.05 m EDTA; 0.05% SDS), and purified three times with phenol:chloroform:isoamyl alcohol (25:24:1), and then three times with chloroform:isoamyl alcohol (24:1). The purified genomic DNA was then ethanol precipitated, and resuspended in distilled water.
Genomic DNA was digested with Sau3aI, and 300 –1000 bp inserts were ligated into the pZErO –2 plasmid (Zero Back-ground cloning kit, Invitrogen) digested with BamHI. We transformed TOP10 cells (Invitrogen) to obtain approximately
5000 – 6000 clones. Nylon replicates of the genomic library were probed with five oligonucleotides (AAT10, AAG10, AAC10, TAG10, and CAT10) which were end-labelled with [γ-33P]-dATP. Probes of the nylon replicates yielded 151 positives and subsequent probing of plasmid DNA on the southern blot confirmed 34 unique positives. Clones which were positive on the south-ern blot were sequenced on an ABI 377 automated sequencer (Perkin-Elmer), and 19 sets of polymerase chain reaction (PCR) primers were designed from the 28 resulting sequences using Mac Ventor 5.0 (Kodak Scientific Imaging Systems).
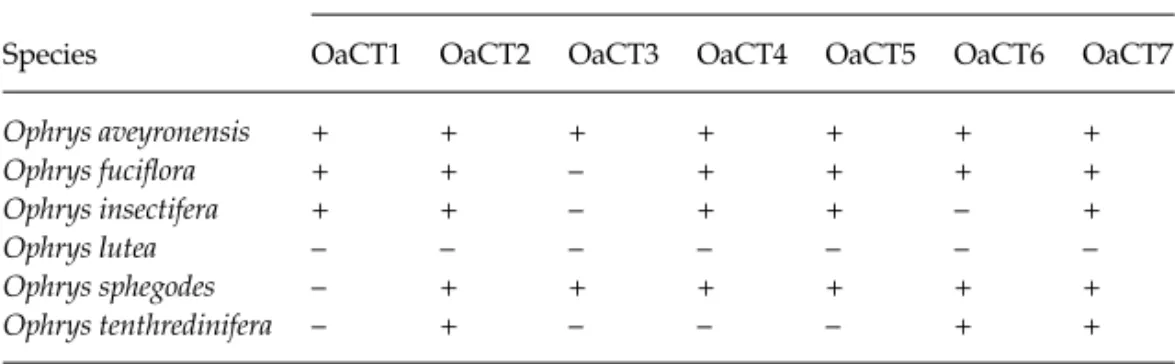
We optimized the PCR primers on an MJ Research PTC-100 thermocycler using 10 µL reactions (Peters et al. 1998), and assessed within-species polymorphisms for eight species of polistine wasps, using from one to eight unrelated females for each species (Table 1). PCR products were visualized on 6% polyacrylamide/8 m Urea sequencing gels.
Twelve of the 19 loci tested were polymorphic within our
P. dominulus population and had a mean observed
hetero-zygosity (HO) of 0.76. Loci with a minimum of five uninterrupted repeats were polymorphic, and heterozygosity increased logarithmically with the number of uninterrupted repeats (Fig. 1; logarithmic regression, R2 = 0.454, P = 0.0016). The loci retained much of their polymorphism in other species
of Polistes with six polymorphic loci for P. fuscatus and
P. apachus which had a mean HO of 0.48. No
polymorph-isms were detected outside of the Polistes genus, however, it is likely that some polymorphisms went undetected due to the small number of individuals screened in the other species (Table 1).
Acknowledgements
This work was supported by a National Science Foundation (NSF) grant DEB-9510126 to Joan Strassmann and David Queller,
Fig. 1 The relationship between the observed heterozygosity and the number of uninterrupted repeats for 19 microsatellite loci isolated from Polistes dominulus.
2156 PRIMER NOTES © 2000 Blackwell Science Ltd, Molecular Ecology , 9, 2155 – 2234
Table 1A description of polymorphic microsatellite loci isolated from Polistes dominulus, including their utility in related polistine taxa. The sample size (n) for each species is given in the column heading with exceptions for certain primers noted in the table. Where n≥ 3, we report the observed heterozygosity for all species, as well as the expected heterozygosity for
P. dominulus. In all cases we report the observed number of alleles in parentheses. The product size and repeat region data are based on the sequenced allele. NP = no scorable product. GenBank accession nos are AF155596 to AF155623 and include 16 additional loci not summarized in the table
Locus Size (bp) Ta (°C) Repeat Polistes dominulus (n = 8) Polistes fuscatus (n = 4) Polistes apachus (n = 4) Protopolybia exigua (n = 2) Brachgastera mellifica (n = 2) Polybia occidentallis (n = 1) Ropalidia excavata (n = 1) Miscocyterus alfkenii (n = 1) Primers (5′– 3′)
Pdom 1 209 55 (CAG)9TAG(CAG)5 HO = 0.38 (3) 0.00 (1) – (2) – (1) – (1) – (1) – (1) – (1) F:GGACGCTCGGCTGATTTGTC
(CAT)5GGCAC(CAG)3 HE = 0.41 n = 1 R:AAGGGATTTTTCCTGAGACTATTCG
Pdom 2 184 51, 48 (AAG)8CG(AAG)2 HO = 0.75 (4) 0.50 (4) 0.33 (3) NP NP NP NP NP F:CGTCTCTCGAAATATGCTAAAC
HE = 0.63 R:AGAACGGTAAACATTCTTCTATC
Pdom 7 160 54 (AAG)CAG(AAG)9 HO = 0.75 (5) – (1) 0.00 (1) – (1) – (1) – (1) NP – (1) F:CACTGTATTGTCCTACGGTGGTCC HE = 0.73 n = 2 n = 1 n = 1 R:GCGAGAACCTGTACTCAAAACAAAC
Pdom 20 236 55, 52 (CAT)18 HO = 0.88 (4) 0.75 (6) 1.00 (5) NP NP NP NP NP F:TTCTCTGGCGAGCTGCACTC
HE = 0.63 R:AGATGGCATCGTTTGAAAGAGC
Pdom 25 157 50, 45 (AAG)11 HO = 0.50 (3) NP NP NP NP NP NP NP F:CATTATAAACGCCGCG
HE = 0.53 R:ACGATGGAAACGTAAGTCC
Pdom 93 131 55 (AAG)2ACG(AAG)2 HO = 0.63 (2) 0.25 (4) 0.50 (5) – (1) – (1) NP – (1) NP F:CCATCAGCTGTCCCATTCGC
ACG(AAG)5 HE = 0.43 R:AATCGGTTTCGCTCGTCCACCTCC
Pdom 117 260 51, 48 (AAG)4AGG(AAG)2 HO = 1.00 (9) 0.25 (2) – (2) – (1) – (1) NP NP NP F:AAGAAAACCTACTACGTTGTGTGAG
AGG(AAG)14 HE = 0.83 n = 2 R:TTTCAACATTCCATAGGGACAG
Pdom 121 218 54, 50 (AAG)8AGGAAC HO = 0.63 (6) 0.00 (1) 0.00 (1) NP NP NP NP – (1) F:GAGTGGGTATGACGAAGATGATGG
(AAG)2AAC(AAG)2 HE = 0.78 R:TGATTATAGCCTGCCGAAACTCTG
Pdom 122 172 46, 48 (AAT)10GAAAAT HO = 1.00 (9) 0.50 (2) – (2) NP NP NP NP – (1) F:CCGAAGAATGATAGTAGGTCC
(AAT)2GAAAAT (AAT)8 HE = 0.85 n = 1 R:AGACCATCTCTCGCACGC
Pdom 127b 119 48 (AAT)13...(AAT)6AA HO = 0.88 (9) 0.00 (1) 0.00 (1) – (1) – (1) – (1) – (1) – (1) F:TCCCCCGTTTTTGGTCCTTG
(AAT)4AAC(AAT) HE = 0.80 R:GGGAGAGAATCGTGCCTTTTC
Pdom 139 186 48, 45 (AAC)7(AAT)2(AAC) HO = 0.88 (6) 0.00 (1) 0.00 (1) NP NP NP NP – (1) F:TGACAAAAGACAACAAAATATG
(AAT)2(AAC)2 HE = 0.72 R:AGCTTCGGTAGGGCTTCG
Pdom 140 192 55 (TAG)9 HO = 0.88 (9) 0.00 (1) 0.00 (1) – (1) – (1) – (1) NP NP F:GCTTTTCCCTTATTTTCCCG
HE = 0.85 R:CGTGTTCGTATATTCCTGTAACG
Pdom 151 115 52, 50 (CAT)2AA(CAT)CAAT HO = 0.00 (1) 0.25 (2) – (1) – (1) – (1) NP – (2) – (1) F:TGATGTTACCACTGCTTTGAGCG
(CAT)3 HE = 0.00 R:TTCAGCACCGTCGTCGTTGTTG
and by a NSF predoctoral fellowship to MT Henshaw. I thank JE Strassmann and DC Queller for comments on the manuscript, Steffano Turillazzi and Rita Cervo for their help collecting wasps in Italy, and Aviva Liebert for help screening the loci in other species.
References
Cervo R, Lorenzi MC (1996) Behavior in usurpers and late joiners of Polistes biglumis bimaculatus (Hymenoptera: Vespidae). Insectes
Sociaux, 43 (3), 255 – 266.
Field J, Solis CR, Queller DC, Strassmann JE (1998) Social and genetic structure of Papers Wasp Cofoundress Associations: tests of reproductive skew models. The American Naturalist, 151 (6), 545 – 563.
Hughes CR (1998) Integrating molecular techniques with field methods in studies of social behavior: a revolution results.
Ecology, 79, 383 – 399.
Mead F, Gabouriaut D, Habersetzer C (1995) Nest-founding behavior induced in the first descendants of Polistes dominulus Christ (Hymenoptera: Vespidae) colonies. Insectes Sociaux, 42 (4), 385 – 396.
Peters JM, Queller DC, Imperatriz Fonseca VL, Strassmann JE (1998) Microsatellite loci for stingless bees. Molecular Ecology, 7, 783 –792.
Queller DC, Strassmann JE, Hughes CR (1993a) Microsatellites and kinship. Trends in Ecology and Evolution, 8 (8), 285 – 288. Queller DC, Strassmann JE, Solís CR, Hughes CR, DeLoach DM
(1993b) A selfish strategy of social insect workers that promotes social cohesion. Nature, 365, 639 – 641.
Queller DC, Zacchi F, Cervo R, et al. (2000) Unrelated helpers in a social insect. Nature, 405, 784 – 787.
Reeve HK (1991) Polistes. In: The Social Biology of Wasps (eds Ross KG, Matthews RW), pp. 99 –148. Cornell University Press, Ithaca.
Strassmann JE (1981) Evolutionary implications of early male and satellite nest production in Polistes exclamans colony cycles.
Behavioral Ecology and Sociobiology, 8, 55 – 64.
Strassmann JE, Solís CR, Peters JM, Queller DC (1996) Strategies for finding and using highly polymorphic DNA microsatellite loci for studies of genetic relatedness and pedigrees. In:
Molecular Zoology: Advances, Strategies and Protocols (eds
Ferraris JD, Palumbi SR), pp. 163 – 180, 528 – 549. Wiley-Liss, Inc., New York.
9 12 2000 1112 PRIMER NOTEs PRIMER NOTEs PRIMER NOTEs 1 00 Graphicraft Limited, Hong Kong
Characterization of nuclear microsatellites
in Pinus halepensis Mill. and their
inheritance in P. halepensis and Pinus
brutia Ten.
R . N . K E Y S , * A . A U T I N O , † K . J . E D WA R D S , ‡ B . FA D Y , * C . P I C H O T * and
G . G . V E N D R A M I N †
*Institut National de la Recherche Agronomique, Unité des Recherches Forestières Méditerranéennes, Avenue Vivaldi, 84000 Avignon, France, †Istituto Miglioramento Genetico Piante Forestali, Consiglio Nazionale delle Ricerche, via Atto Vanucci 13, 50134 Firenze, Italy, ‡IACR-Long Ashton Research Station, University of Bristol, Bristol BS41 9AF, UK
Keywords: microsatellite primers, Pinus brutia, Pinus halepensis Received 25 May 2000; revision received 29 June 2000; accepted 24 July 2000
Correspondence: B. Fady. Fax: +33 4 90 13 59 59; E-mail: [email protected]
Nuclear microsatellites, or single sequence repeats (nSSRs), have been characterized in many tree species and are powerful markers for genetic diversity studies in natural populations (e.g. Echt et al. 1996; Pfeiffer et al. 1997). Although nSSR enrich-ment protocols have successfully been applied to conifers (Edwards et al. 1996), identification of single-locus, reproducible markers is difficult, probably because of their large genome size and complexity (Pfeiffer et al. 1997; Soranzo et al. 1998). In this study, we report the successful isolation of nSSRs in
Pinus halepensis Mill. and their Mendelian segregation in both P. halepensis and P. brutia, two closely related Mediterranean
pines.
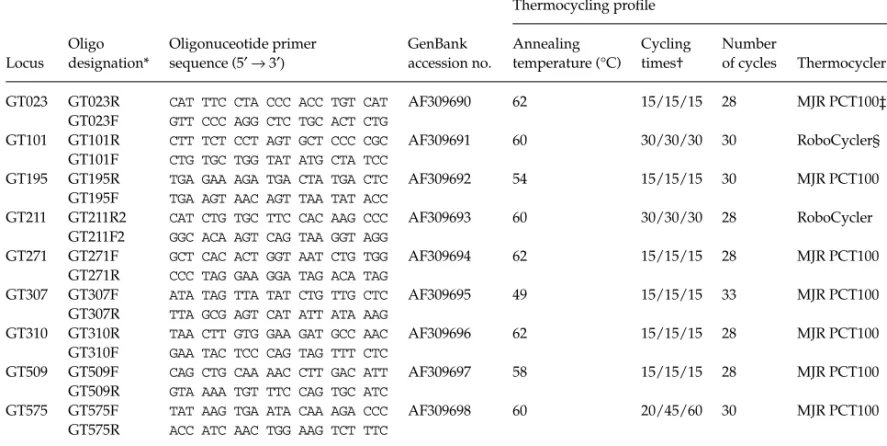
A microsatellite library enriched for di- (GC, CT, CA), tri- (CAA, GCC) and tetra-nucleotide (GATA, CATA) repeats was constructed for Pinus halepensis, following the method described by Edwards et al. (1996). A total of 43 clones containing a microsatellite were detected from 47 clones randomly chosen from the library: 16% were repetitions of a single nucleotide (A/T), 77% were repetitions of dinucleotides (CA, CT or compounds CA–TA, CA–GA) and 7% were repeti-tions of trinucleotides (TAA, GCC). Sequencing reacrepeti-tions were performed using the Pharmacia AutoRead Sequencing Kit, and run on a 6% polyacrylamide gel containing 7 m urea using an ALF Pharmacia automatic sequencer. Primers were designed for the amplification of 25 dinucleotide nSSRs using the computer program Primer (http://www-genome.wi.mit.edu/genome_software/other/primer3.html). Total genomic DNA extracted from leaf and mega-gametophyte tissue was used for testing the primer pairs. The procedure described by Doyle and Doyle (1990) and the Nucleon Phytopur DNA extraction kit were used for leaf tissue and mega-gametophytes, respectively. Polymerase chain reaction (PCR) was carried out using a Gradient 96 Stratagene Robocycler: the reaction solution (25 µL) contained four dNTPs (each 0.2 mm), 0.25 µm of each primer, 2.5 µL reaction buffer (100 mm Tris–HCl pH 9.0, 15 mm MgCl2, 500 mm KCl), 25 ng of template DNA and 1 unit of Taq polymerase (Pharmacia). After a preliminary denaturing step at 95 °C for 1.5 min, PCR amplification was performed for 35 cycles: 1.5 min denaturing at 94 °C, 1.5 min at annealing temperature (Table 1) and 1.5 min extension at 72 °C, with a final 5 min step at 72 °C. After amplification, PCR products were mixed with a loading buffer (98% formamide, 10 mm EDTA pH 8.0, 0.1% bromophenol blue, 0.1% xylene cyanol and 10 mm NaOH), heated for 5 min at 95 °C, and then set on ice. Fragments were electrophoretically separated on a 6% polyacrylamide gel and stained using silver nitrate (Rajora et al. 2000).
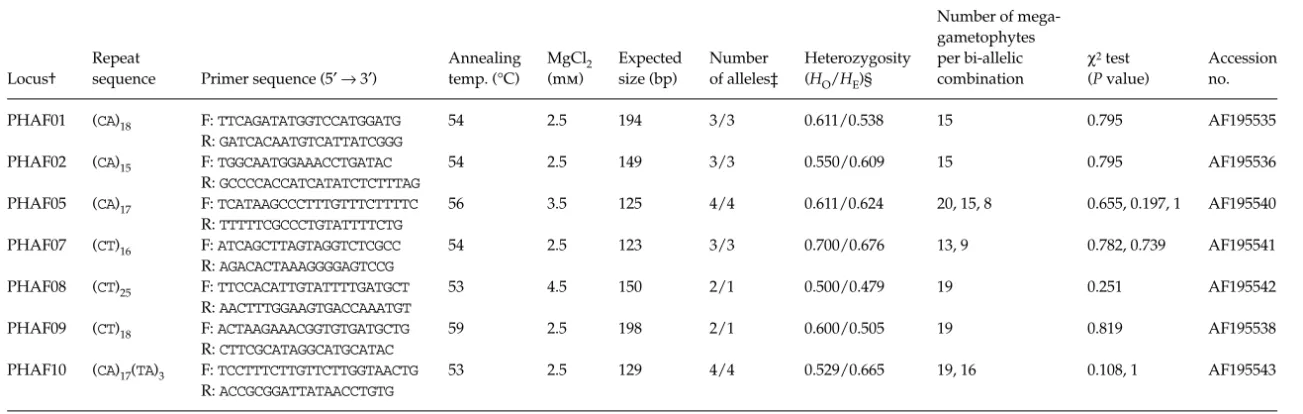
Out of 25 primer pairs, nine (36%) either gave no amplifica-tion (n = 4) or produced multi-band patterns (n = 5). Sixteen produced fragment amplification in the expected size range, of which eight were polymorphic within one or the other species (Table 1). This proportion of functional markers is com-parable to what is generally observed in conifers (e.g. Echt
2158 PRIMER NOTES © 2000 Blackwell Science Ltd, Molecular Ecology , 9, 2155 – 2234
Table 1 Primers and characteristics of seven microsatellite loci that were polymorphic either within Pinus halepensis or within Pinus brutia*
Locus†
Repeat
sequence Primer sequence (5′ → 3′)
Annealing temp. (°C) MgCl2 (mm) Expected size (bp) Number of alleles‡ Heterozygosity (HO/HE)§ Number of mega-gametophytes per bi-allelic combination χ2test (P value) Accession no. PHAF01 (CA)18 F: TTCAGATATGGTCCATGGATG 54 2.5 194 3/3 0.611/0.538 15 0.795 AF195535
R: GATCACAATGTCATTATCGGG
PHAF02 (CA)15 F: TGGCAATGGAAACCTGATAC 54 2.5 149 3/3 0.550/0.609 15 0.795 AF195536
R: GCCCCACCATCATATCTCTTTAG
PHAF05 (CA)17 F: TCATAAGCCCTTTGTTTCTTTTC 56 3.5 125 4/4 0.611/0.624 20, 15, 8 0.655, 0.197, 1 AF195540
R: TTTTTCGCCCTGTATTTTCTG
PHAF07 (CT)16 F: ATCAGCTTAGTAGGTCTCGCC 54 2.5 123 3/3 0.700/0.676 13, 9 0.782, 0.739 AF195541
R: AGACACTAAAGGGGAGTCCG
PHAF08 (CT)25 F: TTCCACATTGTATTTTGATGCT 53 4.5 150 2/1 0.500/0.479 19 0.251 AF195542
R: AACTTTGGAAGTGACCAAATGT
PHAF09 (CT)18 F: ACTAAGAAACGGTGTGATGCTG 59 2.5 198 2/1 0.600/0.505 19 0.819 AF195538
R: CTTCGCATAGGCATGCATAC
PHAF10 (CA)17(TA)3 F: TCCTTTCTTGTTCTTGGTAACTG 53 2.5 129 4/4 0.529/0.665 19, 16 0.108, 1 AF195543
R: ACCGCGGATTATAACCTGTG
*An eighth locus, ITPF4516 (accession AJ012087) tested in P. pinaster (Mariette et al. 2000), is polymorphic in P. halepensis and P. brutia (four common alleles in both species). †PHAF, Pinus halepensis Avignon Firenze. ‡Values are for P. halapensis/P. brutia. In loci PHAF08 and PHAF09, P. halepensis and P. brutia do not share common alleles (sizes 205 and 155 bp respectively). §HO is the frequency of heterozygotes in the sample and HE is the unbiased expected heterozygosity (Nei 1978), where HE = (2n/2n – 1) (1 – Σpi2).
et al. 1996; Pfeiffer et al. 1997). A single marker was found to
be polymorphic in Pinus pinaster when the same 25 primer pairs were tested (Mariette et al. 2000). Transfer of nSSR markers across species of the same genus is generally difficult in conifers (e.g. Echt & May-Marquardt 1997), and the results thus confirm the close taxonomic relatedness between
P. halepensis and P. brutia.
nSSR polymorphism was screened at population level using 50 P. brutia individuals (two populations) and 47 P. halepensis individuals (three populations). The maximum number of alleles per locus was four, and the expected heterozygosity per locus was between 0.479 and 0.676 (Table 1), which is lower than observed for other conifers, e.g. Pinus sylvestris (Soranzo
et al. 1998) or Picea abies (Pfeiffer et al. 1997), but higher than
found using isozymes (Schiller et al. 1986; Teisseire et al. 1995). Mendelian segregation was tested on 1– 3 bi-allelic com-binations in all polymorphic loci (Table 1). No significant deviation from the expected 1:1 ratio was observed. nSSRs are thus potentially helpful markers for studying population diversity in P. halepensis and P. brutia.
Acknowledgements
This study was supported by the European Union, contract FAIR CT95-0097 ‘Mediterranean Pinus and Cedrus’. Many thanks to B. Jouaud for technical assistance.
References
Doyle JJ, Doyle JL (1990) Isolation of plant DNA from fresh tissue. Focus, 12, 13 –15.
Echt CS, May-Marquardt P (1997) Survey of microsatellite DNA in pine. Genome, 40, 9 –17.
Echt CS, May-Marquardt P, Hseih M, Zahorchak R (1996) Characterization of microsatellite markers in eastern white pine. Genome, 39, 1102 –1108.
Edwards KJ, Barker JHA, Daly A, Jones C, Karp A (1996) Micro-satellite libraries enriched for several microMicro-satellite sequences in plants. Biotechniques, 20, 758 – 760.
Mariette S, Chagne D, Decroocq S, Vendramin GG, Lalanne C, Madur D, Plomion C (2000) Microsatellite markers for Pinus
pinaster Ait. Annals of Forest Science, in press.
Nei M (1978) Estimation of average heterozygosity and genetic distance from a small number of individuals. Genetics, 89, 583 – 590.
Pfeiffer A, Olivieri AM, Morgante M (1997) Identification and characterization of microsatellites in Norway spruce (Picea
abies K.). Genome, 40, 411– 419.
Rajora OP, Rahman MH, Buchert GP, Dancik BP (2000) Micro-satellite DNA analysis of genetic effects of harvesting in old-growth eastern white pine (Pinus strobus) in Ontario, Canada. Molecular Ecology, 9, 339 – 348.
Schiller G, Conkle MT, Grunwald C (1986) Local differentiation among Mediterranean populations of Aleppo pine in their isoenzymes. Silvae Genetica, 35, 11–18.
Soranzo N, Provan J, Powell W (1998) Characterisation of micro-satellite loci in Pinus sylvestris L. Molecular Ecology, 7, 1247 –1248. Teisseire H, Fady B, Pichot C (1995) Allozyme variation in five French populations of Aleppo pine (Pinus halepensis Mill.).
Forest Genetics, 2, 225 – 236. 9 12 2000 1113 PRIMER NOTEs PRIMER NOTEs PRIMER NOTEs 1 13 Graphicraft Limited, Hong Kong
Microsatellite markers for behavioural
studies in a semi-fossorial shrew
(Soricidae: Anourosorex squamipes)
H O N - T S E N Y U and Y U - Y I N G L I A ODepartment of Zoology, National Taiwan University, Taipei, Taiwan, ROC 106, Republic of China
Keywords: Anourosorex squamipes, behavioural genetics, fossorial, microsatellite, Soricidae
Received 23 June 2000; revision accepted 24 July 2000
Correspondence: Alex Hon-Tsen Yu. Fax: +886 2 23638179; E-mail: [email protected]
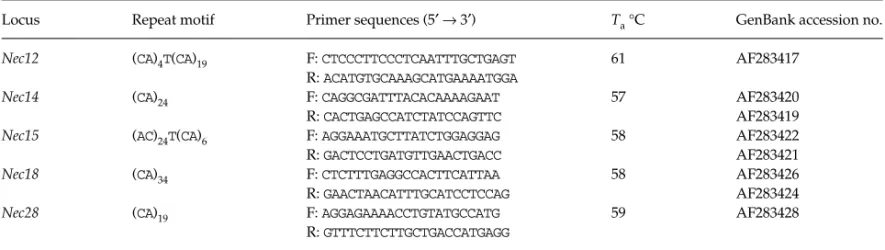
Genetic information revealed by microsatellite markers is useful for inferring social behaviours in animals (Garza et al. 1997), particularly for species that lead a secretive life style. The mole shrews (Anourosorex squamipes) are semi-fossorial, living underground and digging burrows but also coming to the forest floor to search for food (Hutterer 1985). Yu (1994) suggested that several mole shrews might share the same burrow system, as three or four mole shrews were often caught successively by one trap placed on the same spot. Thus, the mole shrew may have the peculiar social structure and behaviour common to some other subterranean mammals (Nevo 1979). As a preparatory step for studying behavioural genetics, we have characterized 11 microsatellite loci that are polymorphic and suitable for use to address questions regard-ing social structure in Anourosorex squamipes.
Genomic DNA for constructing the partial libraries was prepared according to procedures described by Sambrook et al. (1989). Genomic DNA was digested with Sau3A and fractioned in a 2.5% NuSieve™ GTG gel (FMC, Rockland, ME, USA). DNA of size range of 300–700 bp was isolated, purified with a Gene-Clean III kit (Bio101 Inc.) and ligated into plasmid PUC18/
BamHI/BAP (Pharmacia, Vista, CA, USA) according
manu-facturer’s protocols. Ligated plasmids were transformed into com-petent SURE cells or XL-2 Blue ultracomcom-petent cells (Stratagene). Recombinant clones containing inserts were transferred to Hybond N+ nylon membranes (Amersham), which were hybridized to a set of six oligonucleotide probes: (AC)10, (TC)10, (CAC)5CA, CT(ATCT)6, (TGTA)6TG and CT(CCT)5. Probes were labelled with a DIG Oligonucleotide 3′-End Labelling Kit (Boehringer Mannheim). Hybridization was performed at 45 °C for 16 h in a standard hybridization buffer consisting of 5 × SSC, 0.1% N-lauroylsarcosine, 0.2% SDS and 1% blocking reagent (Boehringer Mannheim). The membranes were washed twice for 5 min at 45 °C, with a solution of 2 × SSC, 0.1% SDS, and then twice for 15 min at 65 °C with a solution of 0.1 × SSC, 0.1% SDS. Chemi-luminescent detection was performed with a DIG Luminescent Detection Kit (Boehringer Mannheim). The exposure time ranged from 15 to 30 min.
Positive clones were chosen for sequencing to confirm suitable length and base composition. The sequencing reactions were performed with a Big Dye dye-terminator kit, following the manufacturer’s protocols, and analysed on polyacrylamide gels with an ABI 377 automated sequencer (Perkin-Elmer Applied Biosystems). The online program
2160 P R I M E R N O T E S
© 2000 Blackwell Science Ltd, Molecular Ecology, 9, 2155 – 2234 Primer 3.0 (http://www.genome.wi.mit.edu) was used to
design primers from flanking regions of microsatellite DNA loci that contain more than 10 repeat units.
Individual genotypes were determined by polymerase chain reaction (PCR). PCR reactions were performed either with radioactive primers or radioactive primers. For non-radioactive PCR, 25 µL reactions were performed, containing 200 ng template DNA, 10 mm Tris–HCl, 50 mm KCl, 0.1% Triton X-100, 0.75 mm Mg2+, 0.15 mm dNTP, 0.5 µm of each primer and 2 units Taq DNA polymerase (Promega). Ampli-fication was carried out according to the thermal profile: 95 °C for 4 min, followed by 25 cycles of 94 °C for 30 s, optimal annealing temperature (Table 1) for 30 s and 72 °C for 30 s, with a final extension step at 72 °C for 7 min. PCR products were run on 6% native polyacrylamide gel, stained by ethidium bromide and visualized on a UV light box. The non-radioactive PCR was used to screen for polymorphic loci and the initial round of genotyping.
For radioactive PCR, one primer from each pair was 5′ end-labelled with [γ32P]-ATP (NEN) and T4 polynucleotide kinase (Promega, Boston, MA, USA), following the manufac-turer’s protocols. Each PCR reaction totalled 10 µL, containing 200 ng template DNA, 10 mm Tris–HCl, 50 mm KCl, 0.1% Tri-ton X-100, 0.25 mm dNTP, 0.2 µm of each unlabelled primer, 0.6 mm Mg2+, 0.25 units Taq DNA polymerase (Promega) and 0.5 pmol [γ32P]-ATP labelled primer. Amplification was carried out according to the thermal profile: 95 °C for 3 min, followed by 25 cycles of 95 °C for 15 s, optimal annealing
temperature (Table 1) for 2 min and 72 °C for 2 min, with a final extension step at 72 °C for 7 min. PCR products were run on a regular denaturing 6% polyacrylamide sequencing gel. The sizes of alleles were estimated by using control DNA (PUC18) from a Thermo Sequenase Cycle Sequencing Kit (Amersham) as markers. The radioactive PCR was used for a second round of screening: all the alleles of different sizes detected in the first round of screening were run on com-parison gels to accurately determine their sizes. Running radioactive PCR products on denaturing gels also helps reduce the confusion caused by the heteroduplex bands that sometimes appeared in the first round of screening.
Eleven clones were confirmed to be polymorphic (Table 1) by typing 36 mole shrews collected from Taiwan. The number of alleles per locus ranged from 10 to 20, and the observed and expected heterozygosities ranged from 0.33 to 0.92 and from 0.82 to 0.96, respectively. The observed genotypes deviated from Hardy–Weinberg expectation at the 11 loci (all P < 0.05), resulting from heterozygote deficiency, which may be caused by combining samples from various disparate localities (Wahlund’s effect).
Acknowledgements
Chu-Fong Lo and members of her laboratory offered technical support for molecular cloning. Financial aid was granted to HTY by the National Science Council (89-2311-B-002-029, 88-2311-B-002-051).
Table 1 Characteristics of 11 polymorphic microsatellite loci in Anourosorex squamipes, including repeat motif, primer sequences, annealing temperature, allele size range, number of alleles, observed heterozygosity (HO) and expected heterozygosity (HE)
Locus* Repeat motif Primer sequences (5′ → 3′)
Annealing temp. (°C) Allele size range (bp) Number of alleles HO HE AS1 (AC)15 GGATTCTATTTCATTCTTGAGTCAC 53 129 –155 10 0.75 0.88 GTAAAACTCTGGCTGGTGCC AS2 (TC)9(TG)6 CCTGGTTTGACCTCATGTTTGG 58 136 –166 15 0.56 0.89 GACAGAGAGAGATGGGTGGGG AS3 (TG)3TA(TG)18 TTCCGCCTTGTACTTTGCTG 56 118 –138 20 0.67 0.93 CCCCGGGGATCCAGTGTCTTAC AS4 (TGTC)5(TC)11(AC)6 GGATCCTTCCAGCGTTCTCTCTC 53 140 –164 11 0.78 0.89 GCAGCATGTTTCCCCAGTGTC AS5 (CA)17 AGGCAAACGCTTTACCCTTG 56 94 –112 17 0.58 0.89 TGTAGAAGGCTGGAGAGACAGTG AS6 (AC)13 GGTATGGAGGCACACAACGG 56 96 –126 13 0.56 0.86 TGCTTGCCAGTCTTCTCTGCG AS7 (TG)14 CGCATGCGTGTGTGTGAATC 53 120 –150 13 0.36 0.82 CCAGGTGTGCCCTTGAAACC AS8 (TG)12 TGCTCAAAAGCAATGCTAGCTG 52 112 –138 13 0.53 0.88 GTTCCAAGGACAATGCACGG AS9 (TG)12 CGCACTTTTGTTGTTGTATGCG 50 126 –148 19 0.58 0.93 TTCCTGGCGCCCCATAATAG AS10 (CA)26 GGGGCCTATTCCCCTGTTTC 56 79 –111 20 0.92 0.96 GGATGAGGGAATCCAGAAGACG
AS11 (CCA)6CCG(CCA)8 AGCCACAGGTTTCCACCCAC 56 80 –119 19 0.33 0.88
TTCCGCCTGTCTGCTTCTCC
References
Garza JC, Dallas J, Duryadi D, Gerasimov S, Croset H, Boursot P (1997) Social structure of the mound-building mouse Mus
spicilegus revealed by genetic analysis with microsatellite. Molecular Ecology, 6, 1009 –1017.
Hutterer R (1985) Anatomical adaptations of shrews. Mammal
Review, 15, 43 – 55.
Nevo E (1979) Adaptive convergence and divergence of sub-terranean mammals. Annual Review of Ecology and Systematics, 10, 269 – 308.
Sambrook J, Fritsch EF, Maniatis T (1989) Molecular Cloning. A
Laboratory Manual, 2nd edn. Cold Spring Harbor Laboratory
Press, Cold Spring Harbor, New York.
Yu HT (1994) Distribution and abundance of small mammals along a subtropical elevational gradient in central Taiwan.
Journal of Zoology, London, 234, 577 – 600.
9 12 2000 1115 Primer notes Primer notes Primer notes 1 13 Graphicraft Limited, Hong Kong
Isolation and characterization of
microsatellite DNA markers in the Florida
manatee (Trichechus manatus latirostris)
and their application in selected Sirenian
species
A . I . G A R C I A - R O D R I G U E Z , *
D . M O R A G A - A M A D O R , † W. FA R M E R I E , ‡ P. M C G U I R E § and T. L . K I N G ¶
*United States Geological Survey, Biological Resources Division, Sirenia Project, Gainesville, FL 32601, USA,†Education and Training Core, Interdisciplinary Center for Biotechnology Research, University of Florida, Gainesville, FL 32610, USA, ‡ Molecular Services Core, Interdisciplinary Center for Biotechnology Research, University of Florida, Gainesville, FL 32610, USA, §Department of Biochemistry and Molecular Biology, University of Florida, Gainesville, FL 32610, USA, ¶United States Geological Survey, Biological Resources Division, Aquatic Ecology Laboratory, Leetown Science Center, 1700 Leetown Road, Kearneysville, WV 25430, USA
Keywords: Dugong dugong, microsatellite DNA, Trichechus inunguis, Trichechus manatus
Received 3 February 2000; revision received 2 July 2000; accepted 27 July 2000 Correspondence: T.L. King. Fax: 304 724 4498; E-mail: [email protected] The West Indian manatee (Trichechus manatus) inhabits sub-tropical and sub-tropical waters of the Caribbean Sea from the southern USA to Brazil’s north-east coast. Two sub-species are recognized, the Florida manatee (T. m. latirostris) and the Antillean manatee (T. m. manatus) (Domning & Hayek 1986). Abundant biological and ecological data for the Florida manatee have been collected, and the information has formed the basis for management and conservation programmes. However, to plan and implement biologically sound manage-ment programmes for this marine mammal, knowledge of the amount of genetic diversity present and a thorough under-standing of the evolutionary relationships among geographical populations are essential. Genetic studies employing allozymes (McClenaghan & O’Shea 1988) and mitochondrial DNA (Bradley et al. 1993; Garcia-Rodriguez et al. 1998) have identified
low levels of genetic diversity, and failed to resolve population structure for the Florida manatee. A technique with a higher resolution of genetic population structure and pedigree ana-lysis is needed. We report the development and characteriza-tion of microsatellite DNA markers in the Florida manatee and test the utility of these markers in three closely related Sirenian species.
Two methodologies were used to generate microsatellite-enriched libraries for T. m. latirostris. Four microsatellite-enriched libraries were produced by Genetic Identification Services (Chatworth, California, USA) using proprietary magnetic bead capture technology. An additional library was constructed and screened for polymorphic loci following a protocol modified from Armour et al. (1994). For this protocol, approximately 50 µg of manatee genomic DNA were digested with Sau3AI (Life Technologies, Rockville, Maryland, USA), gel-fractionated to isolate 0.4 –1.0 kbp fragments, and ligated to Sau3AI linkers. Polymerase chain reaction (PCR) amplifications were per-formed in a 100 µL volume containing 15 ng of purified DNA, 50 mm KCl, 10 mm Tris–HCl (pH 9.0), 0.1% Triton X-100, 0.25 mm MgCl2, 0.2 mm dNTPs (Applied Biosystems, Foster City, California, USA), 1 µm Sau-L-A primer and 2.5 units of Taq DNA polymerase (Promega, Madison, Wisconsin, USA). The following amplification programme was used: 94 °C for 3 min, 30 cycles of 94 °C for 45 s, 68 °C for 45 s and 72 °C for 1.5 min, followed by 72 °C for 10 min. Purified PCR prod-ucts were denatured by alkali treatment and hybridized to nylon filters containing (CA)n oligonucleotide repeats. Hybridization was performed overnight at 65 °C, and 5 µL of the recovered hybridized molecules were used for a 100 µL PCR amplification of microsatellite-enriched genomic DNA fragments following the amplification and PCR conditions described above. PCR products were directly ligated to pCR®2.1 (Invitrogen, Carlsbad, California, USA) followed by transformation into INVαF′ One Shot™ competent cells (Invitrogen). A total of 186 colonies were screened for (CA)n -containing inserts using alkaline phosphatase-conjugated (TG)n oligomer and a chemi-luminescent detection system (FMC BioProducts Corp., Rockland, Maine, USA). Following a secondary screening, 60 positive colonies were sequenced using the ABI Prism BigDye Terminator Cycle Sequencing Ready Reaction Kit (Applied Biosystems) employing M13 forward and reverse primers. Sequencing reactions were electrophoresed on an ABI 377 automated sequencer (Applied Biosystems).
From the two sets of libraries, primers were designed in the flanking regions of 61 microsatellite-bearing clones using oligo 5.1 (National Biosciences, Molecular Biology Insights Inc., Cascade, Colorado, USA). Microsatellite DNA amplification reactions consisted of 200 ng DNA, 10 mm Tris –HCl (pH 8.3), 50 mm KCl, 1.5 mm MgCl2, 0.20 mm dNTP, 5 pmol of forward and reverse primer and 1.0 U Taq DNA polymerase (Promega) in a total volume of 20 µL. The forward primer was 5′ modified with either TET, FAM or HEX fluorescent labels (Applied Biosystems). Amplification was performed in a Biometra® UNO II thermal cycler using the following conditions: 94 °C for 2 min, 34 cycles of 94 °C for 30 s, 54 °C for 30 s and 72 °C for 30 s, and a final extension at 72 °C for 10 min. Ampli-fied fragments were subjected to fragment analysis on an
2162 PRIMER NOTES © 2000 Blackwell Science Ltd, Molecular Ecology , 9, 2155 – 2234
Table 1 Expected size of fragment (bp), repeat type, number of alleles detected, observed and expected levels of heterozygosity, primer sequence, and GenBank accession nos for 14
Trichechus manatus latirostris microsatellite DNA markers surveyed in 50 animals collected throughout Florida, and the results of cross-species amplification of these markers in three
other Sirenian taxa
Manatee species Florida Antillean N Amazonian N Dugong N GenBank accession no. Locus Size Repeat type (and length) N HO HE Primer sequences (5′ → 3′)
TmaA01 107 (TA)3(CA)3CG(CA)7 1 0.00 0.00 F-CAGAAGGGATACATATACA 2 2 2 AF223649
R-CAGCCCCTGGCTGTCTCTTGTC
TmaA02 247 – 251 (CACT)2(CA)16 3 0.51 0.54 F-CTCAGTCCAAACAGCTAATG 3 5 2 AF223650
R-TAGTCATTTGTGCAGAGTGC
TmaA03 163 –183 (GACA)4 2 0.30 0.40 F-ACATGTGTTCCCTGCTGTAT 4 3 1 AF223651
R-GATTTTTGGAGCAGTTGTCA
TmaA04 204 (CT)2(GT)12AT(GT)7AT(GT)2 1 0.00 0.00 F-GAACACAAGACCGCAATAAC 3 1 3 AF223652
R-TGGTGTATCACTCAGGGTTC
TmaA09 150 (GT)15 1 0.00 0.00 F-GATGGGATACTGGGTTATGC 1 4 3 AF223653
R-ATGCAGACACTGGACATAGG
TmaE02 172 –174 (GT)13 2 0.44 0.46 F-GTCTCTACGGCCTAGAATTGTG 2 1 3 AF223656
R-TTTCTCTACCTCTCCTCACACG
TmaE08 149 –165 (CA)13TA(CA)5 3 0.47 0.55 F-GAATAGAGACTGGGCTAGAATCC 4 2 3 AF223657
R-GCCTTTTGGAGGGATAGAAGTAG
TmaE11 177 –197 (CA)13 6 0.58 0.63 F-ACACACAACATCACTCATCCAC 8 1 3 AF223658
R-AAGCTGCGTTCTACTTCATATAATC
TmaE26 199 – 201 (CA)8C(CA)17 2 0.24 0.26 F-CATTCCTGATCCACAAAATC 5 3 2 AF223659
R-CCTGTCTTCTCTCTGTTTCTCC
TmaF14 204 – 206 (TC)6(TG)2TA(TC)5TG(TC)3 2 0.24 0.32 F-CTAAGACATTGCTCCAAAAGC 2 2 1 AF223660
R-GGGCAGTGGGATTTGAGATG
TmaF34 271 (TCTCTCTCTTTCTG)2(TC)4 1 0.00 0.00 F-CATGAGAGACTATGCTCCCTTC 1 2 — AF223661
TT(TC)3 (AC)8AT(AC)9 R-CAGGTAGGAAGATGATGAGGAC
TmaH1I 298 (TCTG)4(TCTA)5CCTGTCTATCCA 1 0.00 0.00 F-AGCAGATAGACACACTGGGAAG 1 3 1 AF223662
(TCTA)3CCTG(TCTA)8CCTG(TCTA)5 R-GAGTCTGAATGAATGAATTACTGC
TmaM61 176 (TG)3(GT)17 1 0.00 0.00 F-TTGAGGTGTAATCTGTGTG 2 2 1 AF223655
R-GGTAATCGGAGTTGGTGTA
TmaM79 154 –156 (GT)15 2 0.56 0.54 F-CCAATCATGTCCCAAACT 3 3 2 AF223654
R-CAATAGAAGAAGCAGCAG
Tests for goodness of fit to Hardy–Weinberg expectations suggested that there were no significant differences between observed and expected values (Raymond & Rousset 1995). The results of cross-species amplification of these markers in three other Sirenian taxa are also provided: Antillean manatee (Trichechus manatus manatus), n = 21 animals surveyed; Amazonian manatee (Trichechus inunguis), n = 7; and the dugong (Dugong dugong), n = 3. ‘—’ indicates no or sub-optimal amplification products in cross-species tests. N, number of alleles observed.
ABI PRISM™ 310 Genetic Analyser (Applied Biosystems). Genescan™ 2.1 and Genotyper™ 2.1 Fragment Analysis software (Applied Biosystems) were used to score, bin and output allelic (and genotypic) data.
Fourteen sets of primers amplified fragments of expected size from Florida manatee genomic DNA (Table 1). These markers were screened in 50 manatees collected throughout the Florida peninsula. Eight of the 14 loci were polymor-phic in this initial survey, and overall levels of heterozygos-ity averaged 41%. Low levels of allelic diversheterozygos-ity were observed in the Florida manatee. The maximum number of alleles identified was six (TmaE11), and the average number of alleles observed at polymorphic loci was 2.9. This paucity of genetic diversity suggests a founder effect or major popu-lation bottleneck of evolutionary significance (see Garcia-Rodriguez et al. 1998). In addition, this study reports one of the lowest levels of genetic diversity observed in species-specific microsatellite DNA markers [see Nyakaana & Arctander 1999 (African elephant); Waldick et al. 1999 (right whale) ].
Cross-species amplification was tested in three Sirenian taxa: the Antillean manatee (T. m. manatus), the Amazonian manatee (T. inunguis) and the dugong (Dugong dugong). Eleven of 14 markers were polymorphic for the Antillean and the Amazonian manatee (Table 1). At least nine markers were polymorphic in the dugong; the polymorphism is likely to be under-estimated due to the small sample size (n = 3). This suite of markers appears to be ideal for the identification of population structure and possibly pedigree analysis in all four Sirenian species, and provides a nuclear DNA-based approach to complement existing mitochondrial DNA genetic information for these vulnerable species.
References
Armour JAL, Neumann R, Gobert S, Jeffreys AJ (1994) Isolation of human simple repeat loci by hybridization selection. Human
Molecular Genetics, 3, 599 – 605.
Bradley JL, Wright SD, McGuire PM (1993) The Florida manatee: cytochrome b DNA sequence. Marine Mammal Science, 9, 197 – 202. Domning DP, Hayek LC (1986) Interspecific and intraspecific
morphological variation in manatees (Sirenia: Trichechus).
Marine Mammal Science, 2, 87–144.
Garcia-Rodriguez AI, Bowen BW, Domning D, et al. (1998) Phylogeography of the West Indian manatee (Trichechus manatus): how many populations and how many taxa? Molecular Ecology, 7, 1137–1149.
McClenaghan LR Jr, O’Shea TJ (1988) Genetic variability in the Florida manatee (Trichechus manatus). Journal of Mammalogy, 69, 481– 488.
Nyakaana S, Arctander P (1999) Population genetic structure of the African elephant in Uganda based on variation at mitochondrial and nuclear loci: evidence for male-biased gene flow. Molecular Ecology, 8, 1105 –1115.
Raymond M, Rousset F (1995) genepop (version 1.2): population genetics software for exact tests and ecumenicism. Journal of
Heredity, 86, 248 – 249.
Waldick RC, Brown MW, White BN (1999) Characterization and isolation of microsatellite loci from the endangered North Atlantic right whale. Molecular Ecology, 8, 1753 –1768.
9 12 2000 1116 Primer notes Primer notes Primer notes 1 13 Graphicraft Limited, Hong Kong
Microsatellite loci for two European
sciurid species (Marmota marmota,
Spermophilus citellus)
S . H A N S L I K * and L . K R U C K E N H A U S E R †
*Department of Animal Breeding and Genetics, University of Veterinary Medicine Vienna, A-1210 Vienna, Austria, †Museum of Natural History Vienna, 1st Zoology Department, Burgring 7, A-1014 Vienna, Austria
Keywords: Marmota marmota, microsatellite, primer, population genetics, Spermophilus citellus
Received 10 May 2000; revision received 19 June 2000; accepted 29 July 2000 Correspondence: L. Kruckenhauser. Fax: +43 15235254; E-mail: [email protected]
Two species of European sciurid rodents are of particular interest for behavioural ecology and population genetics:
Marmota marmota and Spermophilus citellus. The Alpine marmot
(M. marmota) inhabits higher elevations of the European Alps and some isolated mountain massifs. Autochthonous popu-lations occur only in the Alpine core area and in a small area near Berchtesgaden. The distribution of the European ground-squirrel (S. citellus) comprises the grassland of the Pannonian plain ranging from eastern Europe to the foothills of the Alps. It is presently listed as endangered (Berner Convention 1999). We isolated six new microsatellite markers for each of the two species (M. marmota: L. Kruckenhauser; S. citellus: S. Hanslik).
Genomic DNA was extracted from frozen liver (M. marmota) or ethanol-stored tissue samples from the tail (S. citellus) using a standard phenol– chloroform extraction method (Sambrook
et al. 1989). Following the protocol of Rassmann et al. (1991),
partial genomic libraries were established for M. marmota and S. citellus and around 1400 clones from each species were screened for the presence of microsatellite sequences using a dinucleotide simple sequence polymer probe AC/GT.
Fifty-eight marmot clones showed a positive signal. Twenty-two were sequenced using the SequiTherm EXCEL™ II DNA Sequencing Kit (Epicentre Technologies) with bio-tinylated primers and the SAAP/CSPD detection system (US Biochemicals, Inc.). Primer pairs were synthesized for 11 loci; six of these microsatellite loci showed unambiguous allelic patterns in M. marmota (Table 1). Polymerase chain reaction (PCR) amplifications were performed on a HYBAID Omnigene thermocycler in a volume of 12.5 µL containing 10 mm Tris –HCl (pH 8.8), 1.5 mm MgCl2, 150 mm KCl, 0.1% Triton X-100, 0.25 U DynaZyme DNA polymerase (Finnzymes OY), 2 pmol of each primer (forward primer labelled with IRD-800), 200 µmol of each dNTP, 0.25 µL DMSO and 50 ng template DNA. The amplification protocols were as follows: 94 °C for 5 min, then two cycles of 94 °C for 20 s, annealing temperature plus 6 °C for 20 s, 70 °C for 20 s, then 30 cycles of 94 °C for 30 s, annealing temperature for 20 s, 70 °C for 20 s, and finally 72 °C for 2 min. PCR products were separated on 6% denaturating polyacrylamide gels in a Li-Cor automatic sequencer. Analysis of PCR fragments was carried out using RFLPscan (Scanalytics). The six loci were tested in 19 indi-viduals of M. marmota from the Austrian allochthonous population Turracher Nockberge. In addition, 10 individuals of S. citellus were cross-tested with the same primer sets.
2164 P R I M E R N O T E S
© 2000 Blackwell Science Ltd, Molecular Ecology, 9, 2155 – 2234 Thirty-six positive ground-squirrel clones were sequenced
with the M13-40 forward primer using Sequenase version 2.0 (Amersham Life Sciences). Sequencing products were separ-ated on a 4% denaturing polyacrylamide gel and visualized autoradiographically. Primers were designed with the oligo software package (National Biosciences Inc., version 5.0). PCR amplification was carried out on a HYBAID Omnigene ther-mocycler in 10 µL reaction volume with 10 mm Tris –HCl (pH 9.0), 50 mm KCl, 1.5 mm MgCl, 0.1% Triton X-100, 0.2 mg/mL BSA, 200 µm dNTPs, 1 µmol of each primer (0.02 pmol forward primer end-labelled with γ32P), 50 –100 ng template DNA, and 0.5 units Taq DNA polymerase. A 4 min initial denaturation at 94 °C was followed by 30 cycles of 1 min at 94 °C, 1 min at 47– 61 °C (depending on the primer combination), 1 min at 72 °C, and a final extension at 72 °C for 45 min. PCR products were separated on a 7% denaturing polyacrylamide gel. Alleles were sized by running a sequencing reaction of M13 next to the amplified microsatellites. Six primer pairs yielded clear amplification products in S. citellus (Table 1). The six loci were analysed in 54 ground-squirrel and 10 marmot individuals.
Observed and expected heterozygosities were calculated using genepop (version 1.2; Raymond & Rousset 1995). Altogether 12 microsatellite loci were tested in both species, the results for these are shown in Table 2. Ten loci amplified in both species, two amplified in M. marmota only. All loci were polymorphic in at least one of the two species, and up to seven different alleles were observed in one species. Significant deviations from the Hardy–Weinberg expectations as calcu-lated with the program genepop (version 1.2; Raymond &
Rousset 1995) were found for the loci SB10 (P = 0.0038) and SX (P = 0.0098) in the ground-squirrel population and MS56 (P = 0.0001) in the marmot population. These deviations might be due to null alleles in the respective populations.
So far, only a small number of microsatellite loci have been identified for M. marmota (Klinkicht 1993), and no markers have been isolated for S. citellus. The primer sets for 12 loci compiled here should provide sufficient information for genetic investigations not only in M. marmota and S. citellus but also over a larger species range within the two genera.
Acknowledgements
We are very much indebted to C. Schlötterer and W. Pinsker for useful comments on the manuscript. We thank I. Hoffman and S. Huber for field work assistance and P. Taberlet and M. Preleuthner for providing marmot samples. The work was supported by a Jubiläumsfonds der Österreichischen National bank grant (project 6590) to Eva Millesi and Fords zur Förderung der wissenschaft-lichen Forschung grants to WP (project P-11840-GEN) and C.S. (P-11628, S-8207, S-8213).
References
Berner Convention (1999) EU Habitats & Species Directive Annex II
& Annex IV.
Klinkicht M (1993) Untersuchungen zum Paarungssystem des
Alpenmurmeltieres, Marmota m. marmota (Linné, 1758), mittels DNA-Fingerprinting. PhD Thesis, Ludwig-Maximilians-Universität,
München, Germany.
Table 1 Primer sequences (5′→ 3′) of microsatellites from Marmota marmota (MS6, MS41, MS45, MS57, MS53, MS56) and Spermophilus
citellus (ST7, ST10, SB10, SC2, SC4, SX), GenBank accession nos, repeat motifs and annealing temperatures
Locus Repeat motif Primer Accession no. Annealing temp. (°C)
MS6 (GT)20 F: CTGATGGGGTTAAGATTGCC AF259372 53 R: CCCCACTGACCCACCTCC MS41 (GT)11 F: GGTGTATATGGGAATAGGGGG AF259373 53 R: GCCTTCAAATCAAAGCAGGTTG MS45 (GT)13 F: CTGTCTCTTTGTCCCTGCC AF259374 53 R: CTCCTTACCATCATCTTTCCG
MS47 (GT)4TC(GT)3AT(GT)7GAGG F: CCTGATGTAGTCAGTCAG AF259375 50
(GA)4TT(GA)3AA(GA)11 R: TGTGGGAAATGGCACATC MS53 (GT)18 F: ATTGAGGAGCAGCATCTAGG AF259376 53 R: TCAGGGAAAGGCAGACCTG MS56 (CA)14 F: CAGACTCCCACCAGTGACC AF259377 53 R: CCTGATCTATGTAGGTTCCAT SB10 (GA)12(TG)18 F: TCTGTTTAGTTCATTTGCCATTT AF254435 50 R: TCAAGAGAGGTCCTACAGAATGA SC2 (GA)31 F: CATCATGGCAGAAGATGTGG AF254438 56 R: TTGACTGGAAGTGGGACTCTC SC4 (GT)20 F: AAAAGCGTGCATTGCCTTAC AF254437 56 R: CCTCTCAAGACGGGCAGA ST7 (TGG)7T(GT)2 F: GAATCTTGACTCCTGAGATA AF254439 50 AT(GT)7AT(TG)8 R: CCATCTCCTGACATTTAATA ST10 (CA)12 F: TTGTGATCCTCCAGGGAGTT AF254436 52 R: GTGATTTCCAAACCCCATTC SX (GA)25 F: TTTTCCTCTCCTGAATGCTTTT AF254440 56 R: CAAAGATGTTGTGTCCGACG
Rassmann K, Schlötterer C, Tautz D (1991) Isolation of simple-sequence loci for use in polymerase chain reaction-based DNA fingerprinting. Electrophoresis, 12, 113 –118.
Raymond M, Rousset F (1995) genepop (version 1.2): a population genetics software for exact tests and ecumenicism. Journal of
Heredity, 86, 248 – 249.
Sambrook J, Fritsch EF, Maniatis T (1989) Molecular Cloning: A
Laboratory Manual. 2nd edn. Cold Spring Harbor Laboratory
Press, Cold Spring Harbor, New York. 9 12 2000 1117 PRIMER NOTEs PRIMER NOTEs PRIMER NOTEs 1 00 Graphicraft Limited, Hong Kong
Microsatellite loci in the Eurasian red
squirrel, Sciurus vulgaris L.
R E B E C C A T O D D
Division of Genetics, University of Nottingham, Queen’s Medical Centre, Nottingham, NG7 2UH, UK
Keywords: microsatellites, primers, red squirrels, Sciurus vulgaris Received 18 May 2000; revision received 12 July 2000; accepted 29 July 2000 Correspondence: Rebecca Todd. E-mail: [email protected]
Ever since microsatellites were first amplified using the poly-merase chain reaction (PCR) and shown to be variable, they have been enthusiastically adopted by population geneticists. Microsatellites quickly became the molecular marker of choice during the 1990s because of the speed and ease with which they can be applied to large samples, and the possibility of their amplification from poor-quality samples collected by non-invasive methods. The level of variability found at microsatellite loci has meant that they can be used to answer phylogenetic questions on many levels (McDonald & Potts 1997). However, the main disadvantage in the use of micro-satellites is the frequent need to develop a set of markers for each species under investigation; this limitation will diminish as more markers are isolated for different species. This paper reports the development of five polymorphic microsatellite loci from the genome of Sciurus vulgaris L., the Eurasian red squirrel.
The loci were isolated using the enrichment method of Armour et al. (1994). Three partial genomic libraries were constructed using DNA extracted from Sciurus vulgaris tissue and digested with the enzyme Mbo1 (Gibco BRL). SAU linkers were ligated to a size-selected fragment (400 –1300 bp), as described in Armour et al. (1994), and used to prime a whole-genome PCR reaction. The product of this reaction was further size-selected before hybridization selection was carried out. Each library was constructed using genomic fractions selected by hybridization to a different set of tetra-, tri- and dinucleotide target repeat sequences taken from (GATA)n, (GACA)n, (CCAT)n, (ACCT)n, (TTGG)n, (GGAA)n, (TTTG)n, (TTTC)n, (GTA)n, (GAT)n, (GCT)n, (CGT)n, (TCC)n, (CAC)n, (GTT)n, (AAG)n and (GT)n.
The hybridization selection reactions were carried out as described by Armour et al. (1994). The selected fraction was re-amplified in a whole-genome PCR and ligated directly into the pGEM-T vector (Promega) or the pNoTA/T7 shuttle vector of the Prime PCR Cloner Cloning System (5 Prime → 3 Prime, Inc.). These ligations were used to transform
Epicu-rian coli XL2-Blue MRF ultracompetent cells (Stratagene).
Positive colonies were cultured and stored as glycerol stocks in microtitre plates; the contents of each plate were replicated onto nylon filters and probed with labelled target oligonucle-otide repeat sequences. Positive colonies were identified and sequenced manually using either isolated plasmid DNA or amplified PCR products as template (the PCR products were generated using the primers M13for (Gibco BRL) and M13rev (Promega) which flank the insertion site). Sequencing was carried out using the T7 sequencing mixes and the T7 poly-merase enzyme (Pharmacia Biotech) following a protocol based on protocol 11 described in Hoelzel & Green (1998). Primers for all useful repeat sequences were designed (with the aid of the computer program oligo™; National Bioscience) and tested for variability on a panel of 10 DNA samples.
PCR amplification of variable loci was optimized using the method described by Cobb & Clarkson (1994). The forward reaction primer in each case was end-labelled with 32P γ-dATP Table 2 Microsatellite loci tested in Marmota marmota and Spermophilus citellus: number of detected alleles, size range of alleles, expected and observed heterozygosities (HE, HO) and number of individuals analysed (n)
Marmota marmota Spermophilus citellus
Locus n Number of alleles Size range HE HO n Number of alleles Size range HE HO
MS6 19 5 142 –164 0.67 0.67 10 — — — — MS41 19 3 186 –190 0.42 0.41 10 3 195 – 201 0.43 0.55 MS45 19 3 109 –113 0.68 0.69 10 2 127–129 0.16 0.17 MS47 19 7 163 –191 0.87 0.81 10 — — — — MS53 19 5 141–149 0.71 0.78 10 4 147–153 0.58 0.46 MS56 19 3 111–115 0.58 0.16 10 3 113 –121 0.49 0.62 SC2 10 2 128 –130 0.50 0.50 54 1 146 0.00 0.00 SC4 10 2 134 –145 0.53 0.00 54 1 102 0.00 0.00 ST7 10 5 135 –154 0.60 0.87 54 3 151–156 0.55 0.44 SB10 10 1 154 0.00 0.00 54 4 150 –162 0.73 0.65 ST10 10 4 124 –130 0.63 0.83 54 3 127 –134 0.51 0.62 SX 10 2 142 –146 0.50 0.50 54 3 142 –146 0.60 0.61
2166 P R I M E R N O T E S
© 2000 Blackwell Science Ltd, Molecular Ecology, 9, 2155 – 2234 using T4 polynucleotide kinase (Gibco BRL). Amplification
reactions were carried out on a PTC-200 thermocycler (MJ Research, Inc.) with 25 µL reactions containing dNTPs (0.15 mm for RSµ1, 0.1 mm for RSµ3, 0.2 mm for RSµ4 and 0.05 mm for RSµ5 and 6), 1 mm MgCl2 (1.5 mm for RSµ1), 10 pmol of each primer (5 pmol for RSµ1 and 3) including 1 pmol of labelled primer (2 pmol for RSµ1), 1 unit of ‘red hot’ Taq DNA poly-merase (Advanced Biotechnologies) with Taq buffer (final concentration 0.75 m Tris–HCl, pH 9.0, 20 mm (NH4)2SO4, 0.01% w/v Tween; Advanced Biotechnologies) and approximately 0.8 ng of template DNA. The reactions were denatured at 94 °C for 3 min, and then subjected to 30 cycles of 94 °C for 1 min, 54 °C for 1 min and 72 °C for 90 s. A final extension step was carried out for 5 min at 72 °C. The PCR products were visualized by electrophoresis through 6% polyacrylamide gels using Sequi-GenII GT gel rigs (BioRad) and exposure to X-ray film. Allele sizes were determined by comparison to a known sequence ladder.
Five loci, named RSµ1, RSµ3, RSµ4, RSµ5 and RSµ6, were found to be polymorphic in the Eurasian red squirrel (Table 1). These loci were amplified from 163 samples of red squirrel DNA in individuals taken from 11 populations in Belgium and Germany (Todd 2000); the proportion of individuals found to be heterozygous at each locus is also given in Table 1. The study included samples of more than 20 individuals from three large populations, and these were used to test for null alleles. Fisher’s exact test was carried out using Biomstat (version 3.2) (Applied Biostatistics Inc.) on the observed and expected number of heterozygotes at each locus in the three populations, and no evidence to indicate the presence of null alleles was found (P > 0.2).
Acknowledgements
This work was carried out under the supervision of Professor David Parkin with financial support from the University of Nottingham. Red squirrel tissue samples were collected by Goedele Verbeyen, University of Antwerp, Belgium. The assistance of Dr Jon Wetton is gratefully acknowledged.
References
Armour JAL, Neumann R, Gobert S, Jeffreys AJ (1994) Isolation of human simple repeat loci by hybridization selection. Human
Molecular Genetics, 3, 599 – 605.
Cobb BD, Clarkson JM (1994) A simple procedure for optimising the polymerase chain reaction (PCR) using modified Taguchi methods. Nucleic Acids Research, 22, 3801– 3805.
Hoelzel AR, Green A (1998) PCR protocols and population ana-lysis by direct DNA sequencing and PCR-based DNA finger-printing. In: Molecular Genetic Analysis of Populations: A Practical
Approach (ed. Hoelzel AR), pp. 201– 235. Oxford University
Press, Oxford.
McDonald DB, Potts WK (1997) DNA microsatellites as genetic markers at several scales. In: Avian Molecular Evolution and
Systematics (ed. Mindell DP), pp. 29 – 48. Academic Press, San
Diego.
Todd RT (2000) The population genetics of red squirrels in a fragmented
habitat. PhD Thesis, University of Nottingham, Nottingham, UK.
9 12 2000 1118 PRIMER NOTEs PRIMER NOTEs PRIMER NOTEs 1 00 Graphicraft Limited, Hong Kong
Isolation and characterization of
microsatellite loci from the ocellated
wrasse Symphodus ocellatus (Perciformes:
Labridae) and their applicability to
related taxa
S . A R I G O N I * † ‡ and C . R . L A R G I A D È R *
*Division of Population Biology, Institute of Zoology, University of Berne, Baltzerstrasse 3, CH-3012 Berne, Switzerland, †Department of Zoology and Animal Biology, University of Geneva, 13, rue des Maraîchers, CH-1211 Geneva, Switzerland, ‡Station Marine d’Endoume, University of the Mediterranean, rue de la Batterie des Lions, F-13007 Marseille, France
Keywords: Labridae, microsatellites, ocellated wrasse, Symphodus ocellatus Received 30 June 2000; revision accepted 27 July 2000
Correspondence: S. Arigoni. Fax: +41 31 6314888; E-mail: [email protected]
Table 1 The characteristics of five Eurasian red squirrel microsatellites Locus
name
GenBank
accession no. Repeat structure Primer sequences (5′ → 3′)
Allele size range (bp)
Number
of alleles HO (%) HE (%) RSµ1 AF285149 [GGAT]13 F 5′-CTGGGTTCACTGACTTCTCC-3′ 172 –196 7 71.9 73
R 5′-CACTCTCAGAGGCCAAAGTC-3′
RSµ3 AF285150 [GA]9[GACA]9 F 5′-GCCAAAATCTAGCCCAAGAAG-3′ 161–173 7 52.2 57.4 R 5′-CTCAGGTGTGGGAAAGAAGC-3′
RSµ4 AF285151 [ATCC]12 F 5′-CAATCCTCCCATCCTGCTGC-3′ 256 – 284 8 78.1 72.3 R 5′-TAGGCAGTCAGATAGGTGGG-3′
RSµ5 AF285152 [GT]10 F 5′-CCCAGTCTACATTAAAGGGC-3′ 123 –143 7 39.3 45.5
R 5′-GCCTATACACTATAATTGACTG-3′
RSµ6 AF285153 [GTT]10 F 5′-GGCATAGGGCACGTGAAG-3′ 122 –131 4 27.3 36.5
R 5′-GGGCCAATCTCATACCAAG-3′
The ocellated wrasse, Symphodus ocellatus, is a common Mediterranean labrid fish of shallow coastal waters. Its geo-graphical distribution also includes the Black Sea, the Azov Sea and the North-Eastern Atlantic (Whitehead et al. 1984). This species is abundant in the Mediterranean and inhabits various biotopes such as shallow rocky areas and seagrass beds (Michel et al. 1987; Francour 1997). The ocellated wrasse is a partially sedentary fish, with territorial males, exclusive male parental care and conspicuous male nuptial coloration and courtship (Warner & Lejeune 1985), and thus constitutes an interesting species for investigating various aspects of population genetics and behavioural ecology of marine fishes. Here we report seven microsatellite loci of the labrid fish
S. ocellatus and their amplification in five related taxa.
Ocellated wrasse microsatellite loci were cloned as described by Estoup et al. (1993) and in detailed protocols by A. Estoup and J. Turgeon available at http://www.inapg.inra.fr/dsa/ microsat/microsat.htm. The genomic library was constructed with about 10 µg of DNA isolated from muscle tissue of a single ocellated wrasse from a population near Marseille (France). Approximately 1500 colonies were screened for microsatellites using a mixture of six probes (TC)10, (TG)10, (CAC)5CA, CT(CCT)5, CT(ATCT)6 and (TGTA)6TG, yielding 176 positively hybridizing clones. Plasmid DNA of positive clones was purified using a QIAprep Spin Miniprep Kit™ (Qiagen). Both strands of the wrasse DNA inserts were sequenced using a Thermo sequenase cycle sequencing kit™ (Amersham) and M13 forward and reverse primers end-labelled with fluorescent dye (IRD800™; Li-Cor). Miniprep prepara-tion and sequencing reacprepara-tions were carried out according to the recommendations of the manufacturers, and sequence reaction products were resolved on an automated DNA sequencer (model 4200™; Li-Cor).
Here we report the seven microsatellite loci (Table 1) for which we so far have successfully designed primer pairs. The genomic DNA for genotyping was prepared either using
a phenol–ethanol extraction method or a rapid BIO RAD (Celex 100 resin) extraction protocol as described by Estoup
et al. (1996). Polymerase chain reaction (PCR) amplifications
were carried out in 10 µL volumes using a PTC100™ machine (MJ Research, USA). Each reaction contained 20 ng genomic DNA, 2 pmol of each primer, one of which was end-labelled with an infra-red fluorescent dye (IRD800™), MgCl2 (concen-tration in Table 1), 0.06 mm of each dNTP, 1 × PCR buffer (Qiagen) and 0.25 U Taq DNA polymerase (Qiagen). Reaction conditions were as follows: an initial denaturation step of 5 min at 95 °C, five cycles consisting of 30 s at 95 °C, 30 s at annealing temperature (see Table 1) and 75 s at 72 °C, 25 cycles consisting of 30 s at 94 °C, 30 s at annealing tempera-ture and 75 s at 72 °C, followed by a final 5 min extension at 72 °C. PCR products were analysed on an automated DNA sequencer (model 4200™), and amplified fragments of cloned alleles were used for size determination at the respective loci. Variability of the loci was tested in five populations of
S. ocellatus from the French Mediterranean coast (Cap
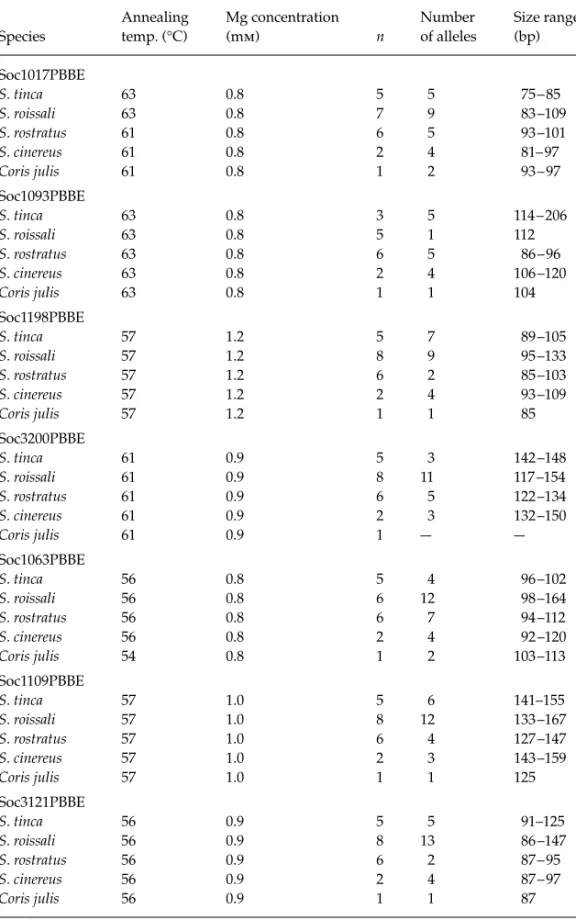
Martin, St Jean Cap Ferrat, Antibes, Cannes and Marseille). Ten individuals from each population were analysed. The number of alleles per locus and the observed and expected heterozygosities are listed in Table 1. All loci were polymor-phic, with the number of alleles per locus ranging between 11 and 30 and the observed heterozygosity between 0.76 and 0.96. Additionally, we tested the amplification of these prim-ers in the labrid Coris julis and four other species of the genus Symphodus: S. tinca, S. roissali, S. rostratus and S.
cin-ereus (Table 2). All specimens were sampled along the French
Mediterranean coast between Cap Martin and Cannes.
Acknowledgements
We thank Alex Kohler and Susanne Wüthrich for their labor-atory assistance and the Swiss Federal Office of Education and Science for financial support. S.A. thanks L. Zaninetti, Table 1 Characterization of seven Symphodus ocellatus microsatellite loci based on five samples (10 individuals each)
Locus Repeat array Primer sequences (5′ → 3′)
Annealing temp. (°C) MgCl2 (mm) Number of alleles Size range (bp)** HO HE Soc1017PBBE (AC)20GC(AC)2 *TCC TGT CAG TCT CCC TTC A
GTG ATT GAT TAG GCG ATG AG 63 0.8 20 (9 –15) 77 –123 (101) 0.86 (0.6 –1.0) 0.92 (0.87 – 0.96)
Soc1063PBBE (GA)2(GT)8 AT(GT)4
*CCC TTC TTG TGT CAT TCC
AAG CCT CAC TTG ATA TGT CC 56 0.8 14 (6 – 9) 92 –134 (98) 0.76 (0.4 –1.0) 0.86 (0.83 – 0.91)
Soc1093PBBE (AC)26 *CCT CCA ATT CCC AAA ACA AC
CTG ACC ACT GGC ACA CTC AT 63 0.8 30 (12 –15) 96 – 294 (132) 0.96 (0.9 –1.0) 0.95 (0.91– 0.97)
Soc1109PBBE (GT)10 *AGG ATT TAG CCT GCC CAG GA
TGC GGT GAA TGG CTG TAG GT 57 1.0 13 (7 – 9) 133 –167 (137) 0.84 (0.7–1.0) 0.87 (0.80 – 0.89)
Soc1198PBBE (TG)5TA (TG)13 *CTC TTT CTG CCT GCA CTC
GAC TTC ATT GGA CAG CAC AC 57 1.2 11 (5 – 9) 89 –113 (109) 0.76 (0.6 – 0.9) 0.80 (0.67 – 0.89)
Soc3121PBBE (GT)18 *ACG ACA AGC TGC ACG AAC
CCA GTA ATT CTG ACT CCA CCC 56 0.9 28 (12 –14) 82 – 205 (102) 0.90 (0.8 –1.0) 0.95 (0.94 – 0.96)
Soc3200PBBE (GT)15 *AGT GCC AGA TGT ATA TGG G
CAT GGA CGC ATT TGT AGC 51 1.0 27 (12–14) 120 –188 (134) 0.88 (0.8 –1.0) 0.94 (0.91– 0.96)
The sequences of cloned fragments have GenBank accession nos AJ278566–AJ278572; HO, observed heterozygosity; HE, expected heterozygosity; given are the mean values across the five populations with range in parentheses. *Primer used for end-labelling. **Cloned insert size in parentheses.
2168 P R I M E R N O T E S
© 2000 Blackwell Science Ltd, Molecular Ecology, 9, 2155 – 2234 M. Harmelin-Vivien and P. Francour for scientific support, and
F. Palluy and C. Marschal for assistance in obtaining samples.
References
Estoup A, Largiadèr CR, Perrot E, Chourrout D (1996) Rapid one tube DNA extraction for reliable PCR detection of fish poly-morphic markers and transgenes. Molecular Marine Biology and
Biotechnology, 5, 295 – 298.
Estoup A, Solingnac M, Harry M, Cornuet JM (1993) Character-isation of (GT)n and (CT)n microsatellites in two insect species:
Apis mellifera and Bombus terrestris. Nucleic Acids Research, 21,
1427 –1431.
Francour P (1997) Fish assemblages of Posidonia oceanica beds at Port-Cros (France, NW Mediterranean): assessment of composition and long-term fluctuations by visual census.
Pub-licazioni della Stazione Zoologica di Napoli Halia: Marine Ecology,
18, 157–173. Species Annealing temp. (°C) Mg concentration (mm) n Number of alleles Size range (bp) Soc1017PBBE S. tinca 63 0.8 5 5 75 – 85 S. roissali 63 0.8 7 9 83 –109 S. rostratus 61 0.8 6 5 93 –101 S. cinereus 61 0.8 2 4 81– 97 Coris julis 61 0.8 1 2 93 – 97 Soc1093PBBE S. tinca 63 0.8 3 5 114 – 206 S. roissali 63 0.8 5 1 112 S. rostratus 63 0.8 6 5 86 – 96 S. cinereus 63 0.8 2 4 106 –120 Coris julis 63 0.8 1 1 104 Soc1198PBBE S. tinca 57 1.2 5 7 89 –105 S. roissali 57 1.2 8 9 95 –133 S. rostratus 57 1.2 6 2 85 –103 S. cinereus 57 1.2 2 4 93 –109 Coris julis 57 1.2 1 1 85 Soc3200PBBE S. tinca 61 0.9 5 3 142 –148 S. roissali 61 0.9 8 11 117 –154 S. rostratus 61 0.9 6 5 122 –134 S. cinereus 61 0.9 2 3 132 –150 Coris julis 61 0.9 1 — — Soc1063PBBE S. tinca 56 0.8 5 4 96 –102 S. roissali 56 0.8 6 12 98 –164 S. rostratus 56 0.8 6 7 94 –112 S. cinereus 56 0.8 2 4 92 –120 Coris julis 54 0.8 1 2 103 –113 Soc1109PBBE S. tinca 57 1.0 5 6 141–155 S. roissali 57 1.0 8 12 133 –167 S. rostratus 57 1.0 6 4 127 –147 S. cinereus 57 1.0 2 3 143 –159 Coris julis 57 1.0 1 1 125 Soc3121PBBE S. tinca 56 0.9 5 5 91–125 S. roissali 56 0.9 8 13 86 –147 S. rostratus 56 0.9 6 2 87 – 95 S. cinereus 56 0.9 2 4 87 – 97 Coris julis 56 0.9 1 1 87
n, number of analysed specimens; —, no alleles obtained.
Table 2 Amplification results of seven
Symphodus ocellatus microsatellite loci in