Geology
doi: 10.1130/G20639.1
2004;32;733-736
Geology
Ching-Weei Lin, Ming-Jame Horng, Tien-Chien Chen, John Milliman and Colin P. Stark
Simon J. Dadson, Niels Hovius, Hongey Chen, W. Brian Dade, Jiun-Chuan Lin, Mei-Ling Hsu,
Earthquake-triggered increase in sediment delivery from an active mountain belt
Email alerting services
cite this article
to receive free e-mail alerts when new articles www.gsapubs.org/cgi/alerts
click
Subscribe click www.gsapubs.org/subscriptions/ to subscribe to Geology Permission request click http://www.geosociety.org/pubs/copyrt.htm#gsa to contact GSA
viewpoint. Opinions presented in this publication do not reflect official positions of the Society.
positions by scientists worldwide, regardless of their race, citizenship, gender, religion, or political
article's full citation. GSA provides this and other forums for the presentation of diverse opinions and
articles on their own or their organization's Web site providing the posting includes a reference to the
science. This file may not be posted to any Web site, but authors may post the abstracts only of their
unlimited copies of items in GSA's journals for noncommercial use in classrooms to further education and
to use a single figure, a single table, and/or a brief paragraph of text in subsequent works and to make
GSA,
employment. Individual scientists are hereby granted permission, without fees or further requests to
Copyright not claimed on content prepared wholly by U.S. government employees within scope of their
Notes
q 2004 Geological Society of America. For permission to copy, contact Copyright Permissions, GSA, or editing@geosociety.org.
Earthquake-triggered increase in sediment delivery from an active
mountain belt
Simon J. Dadson
Niels Hovius
Department of Earth Sciences, University of Cambridge, Downing Street, Cambridge CB2 3EQ, UKHongey Chen
Department of Geosciences, National Taiwan University, No. 1, Sec. 4, Roosevelt Road, Taipei, Taiwan,Republic of China
W. Brian Dade
Department of Earth Sciences, Dartmouth College, Hanover, New Hampshire 03755, USAJiun-Chuan Lin
Mei-Ling Hsu
Department of Geography, National Taiwan University, No. 1, Sec. 4, Roosevelt Road, Taipei, Taiwan, Republic of China
Ching-Weei Lin
Department of Earth Sciences, National Cheng Kung University, 1 Ta-Hsueh Road, Tainan, Taiwan, Republic of ChinaMing-Jame Horng
Water Resources Agency, Ministry of Economic Affairs, Hsin-Yi Road, Taipei, Taiwan, Republic of ChinaTien-Chien Chen
National Science and Technology Center for Disaster Prevention, 6F#200, Sec. 3, Hsinhai Road, Taipei, Taiwan, Republic of ChinaJohn Milliman
School of Marine Sciences, College of William and Mary, Gloucester Point, Virginia 23062, USAColin P. Stark
Lamont-Doherty Earth Observatory of Columbia University, Palisades, New York 10964, USAFigure 1. Location and tec-tonics of Taiwan. A: Tectonic features of Taiwan area. Ab-breviations: EP—Eurasian plate; PSP—Philippine Sea plate; MTr—Manila Trench; RTr—Ryukyu Trench; OT— Okinawa Trough (Teng, 1990). B: Topography of Tai-wan, showing epicenter and focal mechanism of Chi-Chi earthquake. Dashed lines are peak vertical ground ac-celeration contours con-structed using data from 441 strong motion recorders, 60 of which were within 20 km of Chelungpu fault (CPF) (Lee et al., 2001). Shaded re-gion with solid outline indi-cates area of widespread landsliding (>2% surface area disturbed) measured from aerial-photograph land-slide inventory.
ABSTRACT
In tectonically active mountain belts, earthquake-triggered landslides deliver large amounts of sediment to rivers. We quantify the geomorphic impact of the 1999 Mw7.6 Chi-Chi earthquake in
Taiwan, which triggered.20,000 landslides. Coseismic weakening of substrate material caused increased landsliding during subse-quent typhoons. Most coseismic landslides remained confined to hillslopes. Downslope transport of sediment into the channel net-work occurred during later storms. The sequential processes have led to a factor-of-four increase in unit sediment concentration in rivers draining the epicentral area and increased the magnitude and frequency of hyperpycnal sediment delivery to the ocean. Four years after the earthquake, rates of hillslope mass wasting remain elevated in the epicentral area.
Keywords: earthquakes, landslides, typhoons, sediment supply, fluvial erosion rates, Taiwan.
INTRODUCTION
Earthquake- and storm-triggered landslides in actively deforming orogens increase the supply of sediment to rivers (Lyell, 1830; Keefer, 1994; Eberhart-Phillips et al., 2003). The decadal pattern of sediment yield from seismically active areas such as Taiwan is controlled by large earthquakes (Dadson et al., 2003). Coseismic landslide intensity is known to correlate with earthquake magnitude (Keefer, 1994), but patterns of landslide intensity around active faults and location with respect to the river network are poorly constrained. These patterns con-trol the distribution of coseismic erosion and sediment delivery to riv-ers. After an earthquake, coseismic landslide debris is flushed from catchments (Pain and Bowler, 1973; Pearce and Watson, 1986), and seismically weakened rock mass may be removed from hillslopes, but these processes have not been documented in detail. We have quantified the hillslope and fluvial responses to the Mw7.6 Chi-Chi earthquake
in Taiwan by using data on ground acceleration, topography, landslid-ing, and fluvial sediment transport.
Taiwan is the product of oblique collision between the Luzon arc, on the Philippine Sea plate, and the Eurasian continental margin (Fig. 1A). Crustal shortening at 80 mm·yr21(Yu et al., 1997) is accompanied
by frequent large earthquakes, including the Mw 7.6 Chi-Chi
earth-quake in 1999. Taiwan has a subtropical climate with an average of four typhoons per year (Wu and Kuo, 1999) and mean precipitation of 2.5 m·yr21. This combination of active tectonic and climatic regimes
leads to erosion rates averaging 3–7 mm·yr21 and locally up to 60
mm·yr21 (Dadson et al., 2003), driven by fluvial bedrock incision
(Hartshorn et al., 2002), landsliding (Hovius et al., 2000), and debris flows (Lin et al., 2004). Average suspended-sediment discharge from Taiwan to the ocean between 1970 and 1998 was;400 Mt·yr21
(Dad-son et al., 2003).
The Mw7.6 Chi-Chi earthquake, on 21 September 1999, was the
largest in Taiwan for 50 yr and the largest on the Chelungpu thrust fault in 300–620 yr (Shin and Teng, 2001; Chen et al., 2001). The earthquake had a reverse fault mechanism, a focal depth of 8 km, and resulted from the rupture of an;100 km segment of the north-trending, east-dipping (;308) Chelungpu thrust. It produced ground accelera-tions of up to 1g (Lin et al., 2000). Geodetic observaaccelera-tions show co-seismic displacement of as much as 3 m on the fault, decreasing to zero at a distance of 20 km away from the fault (Yu et al., 2001).
Here we focus on the Choshui River basin, which drains much of the epicentral area. During 1996–2001, the following events occurred (Central Weather Bureau, 2003): (1) Typhoon Herb (August 1996), (2) Chi-Chi earthquake (September 1999), and (3) Typhoon Toraji (July 2001). Typhoon Herb occurred 80 yr after the previous Mw. 6
earth-quake in the area and produced a total water discharge of 1.2 km3over
734 GEOLOGY, August 2004 Figure 2. A: Geomorphic response to earthquake with distance
from Chelungpu fault. Filled circles show mean change in unit sediment concentration,Dk(1 standard error bars); open sym-bols show mean change in density of landsliding caused by Chi-Chi earthquake (triangles) and Typhoon Toraji (squares). Gray bar shows peak (vertical) ground acceleration (PGA). B: Relationship between PGA, area affected by landsliding (dashed line), andDk (solid line).
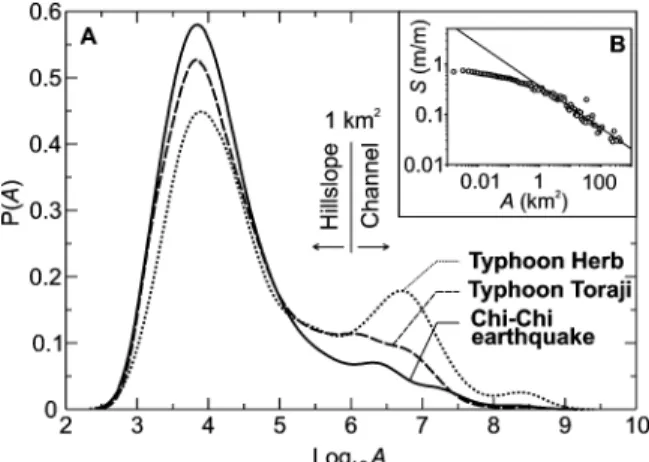
Figure 3. A: Probability (P) distribution of upslope area (A, in m2) of lowermost point reached by landslides
trig-gered by Typhoon Herb (dotted line), Typhoon Toraji (dashed line), and Chi-Chi earthquake (solid line).A was calculated using ARC/INFO D8 flow routing algorithm with 40 m digital elevation model. Value reported is max-imum found within perimeter of each landslide scar and its associated deposit. B: Slope (S) vs. area plot for Chenyoulan River. Slope is mean slope measured in di-rection of steepest descent within logarithmically spaced bins of drainage area. Solid line is power law (S 5 0.36A20.42) that was fitted to data withA > 1 km2.
(the largest of four postearthquake typhoons) produced a total water discharge from the Choshui River of 0.8 km3 over 2 days. This
typhoon-earthquake-typhoon sequence represents a natural experiment that provides quantitative information about the impact of a large earth-quake on hillslope mass wasting and transfer of sediment to rivers and the ocean.
LANDSLIDE LOCATION AND INTENSITY
Field, aerial-photograph, and satellite observations following the Chi-Chi earthquake show ;20,000 soil and bedrock landslides, cov-ering a total area of 150 km2. Landslides were mapped from
20-m-resolution SPOT satellite images. This 20-m-resolution means that landslides .3600 m2 (3 3 3 pixels) can be mapped accurately. Omission of
landslides smaller than this size may have caused significant underes-timation of area disturbed. Most slope failures occurred within an ;3000 km2 region bounded by the 0.2g contour of peak vertical
ground acceleration (Lin et al., 2000; Fig. 1B). The area disturbed by landsliding exceeds 2% within an;20 km zone along the Chelungpu fault (Fig. 2A). This zone includes the earthquake epicenter, 14 km east of the surface break. The decrease in area affected by landsliding away from the epicenter is characterized by an exponential function that decays to 1/e (37%) of its maximum value within 30 km (Fig. 2A).
After Typhoon Toraji, ;30,000 more landslides were mapped from SPOT images, with a total mapped landslide area of 500 km2.
Of the landslides triggered by the Chi-Chi earthquake, 56% were re-activated during Typhoon Toraji, while 80% of the Toraji landslides occurred in areas that had not failed during the earthquake. Moreover, the proportion of surface area disturbed by landsliding during Typhoon Toraji increased with proximity to the Chelungpu fault (Fig. 2A), sug-gesting that, even in areas that underwent no landsliding during the earthquake, the substrate was preconditioned to fail through loss of cohesion and frictional strength of hillslope rock mass caused by seis-mic strong ground motion.
Next we consider the location of landslides within the Chenyoulan River basin, a tributary of the Choshui River; the basin covers an area of 376 km2,;12 km east of the epicenter (Fig. 1B). Within the
Chen-youlan catchment, 289 landslides were mapped following Typhoon Herb, 584 following the Chi-Chi earthquake, and 1903 following Ty-phoon Toraji. To quantify landslide location relative to the river-channel network, we calculated the drainage area, A, of the lowest point reached by each landslide (Fig. 3A). A slope-area plot (Fig. 3B) pro-duced from a 40 m digital elevation model of the Chenyoulan catch-ment indicates that channelization occurs when A. 1 km2. We infer
that landslides reaching locations with A. 1 km2delivered sediment
to channels.
Most earthquake-triggered landslides remained confined to hill-slopes. Only 8% of these landslides delivered sediment to rivers. In contrast, 13% of landslides triggered by Typhoon Toraji, and 24% of landslides triggered by Typhoon Herb, delivered sediment to the chan-nel network (Fig. 2B). This difference may reflect topographic ampli-fication of seismic waves close to hillcrests (Geli et al., 1988). Sub-sequent downslope transport occurred in a cascade of sediment from hillslopes into the channel network during storm-triggered landslides and debris flows.
SUSPENDED SEDIMENT IN RIVERS
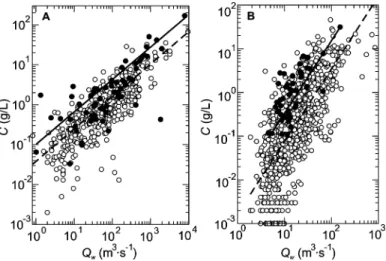
We have quantified the impact of the Chi-Chi earthquake and Ty-phoon Toraji on river sediment loads by using measurements of suspended-sediment discharge at 101 hydrometric stations between 21 September 1999 and the end of 2001. Water discharge was measured daily through the use of a stage recorder. Suspended-sediment concen-tration was measured fortnightly, through the use of a USDH-48 suspended-sediment sampler, by the Water Resources Agency of Tai-wan (1970–2003). To estimate coseismic sediment supply indepen-dently of variations in transport capacity during subsequent storms, we calculated unit sediment concentration, k, from a plot of suspended-sediment concentration and water discharge (Trustrum et al., 1999; e.g., Figs. 4A, 4B) by fitting a function of the form C5 kQb, where C is
suspended-sediment concentration (g/L) and Q is water discharge (m3·s21). The exponent b represents the strength of the relationship
mo-Figure 4. Suspended-sediment rating curves. A: Choshui River. B: Chenyoulan River. Open circles show measurements made before Chi-Chi earthquake; filled symbols show measurements after earth-quake. Dashed lines are power-law functions ofC5 kpreQbfitted to
preearthquake data using log-transformed least-squares regression; solid lines are power-law functionsC5 kpostQbfitted only to
pos-tearthquake data;b was 0.8 for Choshui River, and 1.7 for Cheny-oulan River. See text for discussion.
Figure 5. A: Spatial variation of change in unit sediment con-centration, Dk, following Chi-Chi earthquake. Data from 101 catchments were smoothed using 30-km-diameter circular mov-ing average. This length scale is median area of the catchments analyzed. Dashed lines show boundaries of named catchments. Black circles show gauging stations; open circles indicate Chi-Chi epicenter and aftershocks with ML > 6.0. Blue lines are
tracks of subsequent typhoons: Bilis (average discharge at Choshui River mouth,Qavg54850 m3·s21), Xangsane (Qavg5
1810 m3·s21), Toraji (Q
avg57790 m3·s21), and Nari (Qavg52610
m3·s21). Maximum wind velocities were 105, 74, 74, and 78
knots, respectively; track is solid if wind speed is > 64 knots; dashed otherwise. B: Time series of mean unit sediment con-centration for 6 month periods between 1986 and 2002 in Cho-shui River (gray bars). Dotted line shows typhoon season mean; dashed line shows winter mean. Solid line is exponential fit to winter data (and summer 1999 when no typhoons occurred).
bilization. By fitting model curves to both preearthquake and post-earthquake data, while keeping the exponent fixed to permit compari-son between models, we obtained model coefficients kpre and kpost.
The ratioDk 5 kpost/kpregives an estimate of the change in unit
sed-iment concentration following the earthquake. IfDk . 1, unit sediment concentration increased after the earthquake.1
The spatial pattern ofDk shows the greatest perturbation in the Chi-Chi epicentral region, in a north-trending band that tracks the Che-lungpu fault. The change in unit sediment concentration tracks the pat-terns of peak vertical ground acceleration and landslide density (Fig. 5A). Beyond the epicentral peak, Dk decreases gently in the first 60 km from the fault and then decays more rapidly (Fig. 2A). This pattern is broadly similar to the pattern of landslide disturbance, although land-slide density decays more rapidly away from the fault. Peak vertical ground acceleration correlates well with area disturbed by landsliding (r25 0.76) and with change in unit sediment concentration (r25 0.86)
(Fig. 2B). In the Peinan River, which is a considerable distance from the Chi-Chi epicenter (Fig. 1B), unit sediment concentration increased by a factor of 2.8. Here, elevated sediment concentrations and dis-charges appear to have resulted from sediment mobilized by debris flows during Typhoon Bilis, which impinged directly on this high-yielding mountain watershed. The track of Typhoon Toraji is offset from a zone of increased sediment concentration that it may have caused. Possible explanations for the mismatch include variability of the precipitation field associated with typhoons or the interaction of typhoons with topography.
Sediment discharge to the ocean was elevated following the Chi-Chi earthquake and Typhoon Toraji. The area most heavily affected by the earthquake was around the epicentral Choshui River (Fig. 1B). Following the earthquake, unit sediment concentration at the Choshui River mouth increased by a factor of 3.8 (Fig. 4A). The maximum suspended-sediment concentration measured during Typhoon Toraji (169 g/L; measured at water discharge, Q5 8900 m3·s21; Q
peak 5
28,000 m3·s21) was 2.5 times greater than during Typhoon Herb (67
g/L; measured at Q5 5850 m3·s21; Q
peak5 14,800 m3·s21), which
was of similar size but occurred 3 yr before the Chi-Chi earthquake. 1GSA Data Repository item 2004119, Table ofDk calculations for major
watersheds, is available online at www.geosociety.org/pubs/ft2004.htm, or on request from editing@geosociety.org or Documents Secretary, GSA, P.O. Box 9140, Boulder, CO 80301-9140, USA.
Greater increases in postseismic sediment concentration were observed in several mountain catchments, such as a 4.4-fold increase in the Chenyoulan watershed (Fig. 4B). The average measured suspended-sediment discharge in the Choshui River between 1986 and 1999 (a period of relative seismic quiescence) was 54 Mt·yr21(Dadson et al.,
2003).
We calculated the annual suspended-sediment discharge by using a rating-curve estimate, which combines a relationship between sedi-ment concentration and water discharge for each catchsedi-ment with a rec-ord of daily water-discharge data (supplemented with hourly discharge
736 GEOLOGY, August 2004
measurements at one station during large storms; Water Resources Agency of Taiwan, 1970–2003). This method is likely to provide a conservative estimate of the postseismic increase in sediment discharge (Cohn, 1995). The total mass removed from the Choshui River basin during the period between the Chi-Chi earthquake and the end of 2001 was 326 Mt, 175 Mt of which was removed by Typhoon Toraji over a period of 2 days. Thus, following the earthquake, average annual suspended-sediment discharge increased by a factor of 2.6 to 143 Mt·yr21. Annual averages were 14 Mt·yr21 (2 mm·yr21 across the
whole catchment assuming a density of 2650 kg·m23) in 1999, a year
with no typhoons; 81 Mt·yr21in 2000 (10 mm·yr21, one typhoon); and
241 Mt·yr21in 2001 (30 mm·yr21, three typhoons).
The time scale of the geomorphic response to the Chi-Chi earth-quake is illustrated in Figure 5B, which shows the available record of averages over 6 month periods of unit sediment concentration from 1986 to 2002. The pattern of unit sediment concentration during ty-phoon seasons is determined by tyty-phoon size. In contrast, the data for winter seasons (which have no typhoons) show an exponential decrease in unit suspended-sediment concentration from the elevated postearth-quake value to the pre-1999 winter mean. The time for winter-season unit sediment concentration to decay to 1/e of its maximum value is 2.3 yr. This observation indicates that the alluvial and colluvial stores that deliver sediment at low flow were depleted relatively rapidly fol-lowing the Chi-Chi earthquake. In contrast, hillslopes continue to de-liver sediment to rivers during extreme precipitation associated with typhoons. Large quantities of sediment may remain on hillslopes, caus-ing elevated landslide and debris-flow rates in subsequent typhoons.
Elevated postseismic sediment delivery to the coast suggests that the offshore sedimentary record may contain information on locations and recurrence intervals of past earthquakes. Hyperpycnal flows are negatively buoyant fluvial discharges caused by high concentrations of suspended sediments. On the basis of the average temperature (23–28 8C) and salinity (34‰) of oceanic coastal waters around Taiwan, con-centrations of 36–39 g/L will produce hyperpycnal flow (Boggs et al., 1979; Mulder and Syvitski, 1995). From hydrometric observations at the lowermost station on the Choshui River, we estimate (by using the postearthquake suspended-sediment rating curve) that 67% (up from 43%) of the 143 Mt·yr21annual suspended-sediment discharge from
Choshui River following the Chi-Chi earthquake was delivered under conditions for which Cs. 40 g/L. We infer that hyperpycnal plumes
were formed on at least four occasions since the earthquake, each during the typhoon season. By using the background sediment-concentration rating curve, we estimate that only one storm would have produced a hyperpycnal plume had the earthquake not occurred. Our calculations suggest that earthquake-driven geomorphic processes may leave a record of mountain-building processes in foreland stratigraphy. CONCLUSIONS
The 1999 Mw7.6 Chi-Chi earthquake has triggered at least 20,000
landslides in the Western Foothills fold-and-thrust belt of the Taiwan orogen. Coseismic landslide intensity decayed exponentially with dis-tance from the active fault. Most of the debris from coseismic land-slides has been remobilized by postseismic landland-slides, but most post-seismic landslides have affected pristine hillslopes in a pattern that closely tracks the distribution of Chi-Chi strong ground motion. These landslides have resulted in elevated postseismic erosion rates and a cascade of sediment from hillslopes to channels. Suspended-sediment concentrations in rivers within;40 km of the 1999 Chi-Chi earthquake are as much as four times higher than decadal background values. The total mass removed from the epicentral catchment during the period between the Chi-Chi earthquake and the end of 2001 was 326 Mt, two-thirds of which was delivered to the ocean at hyperpycnal concentrations.
ACKNOWLEDGMENTS
This work was supported by the UK Natural Environment Research Coun-cil, Faber Maunsell plc., the Taiwan National Science Council (ROC), the Royal
Society, European Union funding to the RETINA project under FP5 (EVG1-CT-2001-00046), and the National Aeronautics and Space Administration (NAG5-8848). We thank D. Keefer and D. Burbank for constructive reviews. REFERENCES CITED
Boggs, S., Wang, W.C., Lewis, F.S., and Chen, J.C., 1979, Sediment properties and water characteristics of the Taiwan shelf and slope: Acta Oceanogra-phica Taiwanica, v. 10, p. 10–49.
Central Weather Bureau, 2003, Historical typhoon data: http://www.cwb.gov.tw/ V4/typhoon/history/typhoon-history.htm (April 2004).
Chen, W.S., Chen, Y.G., Chang, H.C., Lee, Y.H., and Lee, J.C., 2001, Palaeo-seismic study of the Chelungpu fault in the Wanfung area: Western Pacific Earth Sciences, v. 1, p. 499–506.
Cohn, T.A., 1995, Recent advances in statistical methods for the estimation of sediment and nutrient transport in rivers: Reviews of Geophysics, v. 33, supplement, p. 1–18.
Dadson, S.J., Hovius, N., Chen, H., Dade, W.B., Hsieh, M.L., Willett, S.D., Hu, J.C., Horng, M.J., Chen, M.C., Stark, C.P., Lague, D., and Lin, J.C., 2003, Links between erosion, runoff variability and seismicity in the Taiwan orogen: Nature, v. 426, p. 648–651.
Eberhart-Phillips, D., and 28 others, 2003, The 2002 Denali fault earthquake, Alaska: A large magnitude slip-partitioned event: Science, v. 300, p. 1113–1118.
Geli, L., Bard, P.Y., and Jullien, B., 1988, The effect of topography on earth-quake ground motion: A review and new results: Bulletin of the Seis-mological Society of America, v. 78, p. 42–63.
Hartshorn, K., Hovius, N., Dade, W.B., and Slingerland, R.L., 2002, Climate-driven bedrock incision in an active mountain belt: Science, v. 297, p. 2036–2038.
Hovius, N., Stark, C.P., Chu, H.T., and Lin, J.C., 2000, Supply and removal of sediment in a landslide-dominated mountain belt: Central Range, Taiwan: Journal of Geology, v. 108, p. 73–89.
Keefer, D.K., 1994, The importance of earthquake-induced landslides to long-term slope erosion and slope-failure hazards in seismically active regions: Geomorphology, v. 10, p. 265–284.
Lee, W.H.K., Shin, T.C., Kuo, K.W., Chen, K.C., and Wu, C.F., 2001, CWB free-field strong motion data from the 921 Chi-Chi earthquake: Bulletin of the Seismological Society of America, v. 91, p. 1370–1376.
Lin, C.W., Shieh, C.L., Yuan, B.D., Shieh, Y.C., Liu, S.H., and Lee, S.Y., 2004, Impact of the Chi-Chi earthquake on the occurrence of landslides and debris flows: Example from the Chenyulan River watershed: Engineering Geology, v. 71, p. 49–61.
Lin, M.L., Wang, K.L., and Chen, T.C., 2000, Characteristics of the slope failure caused by Chi-Chi earthquake, in Loh, C.H., and Liao, W.I., eds., Inter-national workshop on annual commemoration of Chi-Chi earthquake (III): Taipei, National Center for Research on Earthquake Engineering, p. 199–209.
Lyell, C., 1830, Principles of geology, Volume 1: London, John Murray, 511 p.
Mulder, T., and Syvitski, J.P.M., 1995, Turbidity currents generated at river mouths during exceptional discharges to the world’s oceans: Journal of Geology, v. 103, p. 285–299.
Pain, C.F., and Bowler, J.M., 1973, Denudation following the November 1970 earthquake at Madang, Papua New Guinea: Zeitschrift fu¨r Geomorphol-ogie, v. 18, supplement, p. 91–104.
Pearce, A.J., and Watson, A.J., 1986, Effects of earthquake-induced landslides on sediment budget and transport over 50 years: Geology, v. 14, p. 52–55. Shin, T.C., and Teng, T.L., 2001, An overview of the 1999 Chi-Chi, Taiwan, earthquake: Bulletin of the Seismological Society of America, v. 91, p. 895–913.
Teng, L.S., 1990, Geotectonic evolution of late Cenozoic collision in Taiwan: Tectonophysics, v. 183, p. 57–76.
Trustrum, N.A., Gomez, B., Page, M.J., Reid, L.M., and Hicks, D.M., 1999, Sediment production, storage, and output: The role of large magnitude events in steepland catchments: Zeitschrift fu¨r Geomorphologie (Neues Folge), v. 115, supplement, p. 71–86.
Water Resources Agency of Taiwan, 1970–2003, Hydrological yearbook of Tai-wan, Republic of China: Taipei, Water Resources Agency: also available at http://gweb.wra.gov.tw/wrweb (April 2004).
Wu, C.C., and Kuo, Y.H., 1999, Typhoons affecting Taiwan: Current under-standing and future challenges: American Meteorological Society Bulletin, v. 80, p. 67–80.
Yu, S.B., Chen, H.Y., and Kuo, L.C., 1997, Velocity field of GPS stations in the Taiwan area: Tectonophysics, v. 274, p. 41–59.
Yu, S.B., Kuo, L.C, Hsu, Y.J., Su, H.H., Liu, C.C., Hou, C.S., Lee, J.F., Lai, T.C., Liu, C.C., Liu, C.L., Tseng, T.F., Tsai, C.S., and Shin, T.C., 2001, Preseismic and coseismic displacements associated with the 1999 Chi-Chi, Taiwan, earthquake: Bulletin of the Seismological Society of America, v. 91, p. 995–1012.
Manuscript received 11 March 2004 Revised manuscript received 28 April 2004 Manuscript accepted 4 May 2004 Printed in USA

![TraditionalMLCalgorithmsmainlytacklethebatchMLCproblem,wheretheinputdataarepresentedinabatch[24,28].Nevertheless,inmanyMLCapplicationssuchase-mailcategorization[22],multi-labelexamplesarriveasastream.Onlineanalysisistherefore dimensionreducermotivatedbyma](data:image/gif;base64,R0lGODlhAQABAIAAAP///wAAACH5BAEAAAAALAAAAAABAAEAAAICRAEAOw==)