Typhoon Initialization in a Mesoscale Model—Combination of the Bogused Vortex and
the Dropwindsonde Data in DOTSTAR
KUN-HSUANCHOU ANDCHUN-CHIEHWU
Department of Atmospheric Sciences, National Taiwan University, Taipei, Taiwan
(Manuscript received 12 January 2007, in final form 30 May 2007) ABSTRACT
Issues concerning the initialization and simulation of tropical cyclones by integrating both dropwindsonde data and a bogused vortex into a mesoscale model have been studied. A method is proposed to combine dropwindsonde data with a bogused vortex for tropical cyclone initialization and to improve track and intensity prediction. A clear positive impact of this proposed method on both the tropical cyclone track and intensity forecasts in a mesoscale model is demonstrated in three cases of typhoons, including Meari (2004), Conson (2004), and Megi (2004). The effectiveness of the proposed method in improving the track and intensity forecasts is also demonstrated in the evaluation of all 10 cases of Dropwindsonde Observations for Typhoon Surveillance near the Taiwan Region (DOTSTAR) missions in 2004. This method provides a useful and practical means to improve operational tropical cyclone prediction with dropwindsonde obser-vations.
1. Introduction
Over the past 30 yr, persistent and steady progress on the track forecasts of tropical cyclones (TCs) has been well demonstrated through the improvement of nu-merical models, data assimilation and bogusing sys-tems, targeted observations, and satellite and drop-windsonde data available to the forecast systems (Wu et al. 2007a, hereafter Wu07). In particular, consider-able progress has been made in TC track prediction with numerical models (e.g., Kurihara et al. 1995). Re-cent works (e.g., Zhang et al. 2002; Wu et al. 2002, 2003) have also displayed the capability of high-resolution nonhydrostatic mesoscale models to realistically simu-late the detailed mesoscale structure of a TC. Wang (2001) demonstrated that a high-resolution model has the ability to simulate many aspects of TCs, including the inner core structure, the inner and outer spiral rain-bands, and the vortex Rossby waves within the rapidly rotating eyewall.
As a TC spends most of its lifetime over the tropical ocean, where conventional observations have always
been sparse, the uncertainty and poor quality in initial conditions can lead to monumental errors in the nu-merical simulation and prediction of TCs. For example, Kurihara et al. (1995) have shown that a better predic-tion could be achieved by the use of improved initial-ization procedures that better represent the initial en-vironment, as well as the vortex-scale, flow, and mass fields. Wu et al. (2000) showed that numerical simula-tions of typhoon track and intensity tended to have some systematic biases, which also varied with different initial conditions. Recently, a more advanced TC ini-tialization called bogus data assimilation was proposed (Zou and Xiao 2000) based on the four-dimensional variational data assimilation. Further studies indicated that the bogus data assimilation can improve TC fore-casting and simulation (Zou and Xiao 2000; Pu and Braun 2001; Park and Zou 2004; Wu et al. 2006). This research clearly pointed out that improved initial con-ditions are a crucial step toward improving the simula-tion and predicsimula-tion of TCs.
Starting from 2003, the research program called Dropwindsonde Observations for Typhoon Surveil-lance near the Taiwan Region (DOTSTAR) marks the beginning of an era of TC surveillance and targeted observations in the western North Pacific using GPS dropwindsondes (Wu et al. 2005, 2007a,b). Built upon work pioneered by the Hurricane Research Division Corresponding author address: Dr. Chun-Chieh Wu,
Depart-ment of Atmospheric Sciences, National Taiwan University, No. 1, Sec. 4, Roosevelt Rd., Taipei 106, Taiwan.
E-mail: cwu@typhoon.as.ntu.edu.tw DOI: 10.1175/2007MWR2141.1
© 2008 American Meteorological Society
(HRD) to improve TC track forecasts, DOTSTAR is a collaboration between researchers from the National Taiwan University and the Central Weather Bureau of Taiwan, in partnership with scientists at HRD, the Na-tional Centers for Environmental Prediction (NCEP), Japan Meteorological Agency (JMA), and the Naval Research Laboratory of the U.S. Navy. Three opera-tional global and two regional models were used to evaluate the impact of the dropwindsonde data from DOTSTAR on TC track forecasting (Wu07). Based on the results of 10 missions conducted in 2004, the use of the dropwindsonde data from DOTSTAR, on average, improves by 22% the 72-h ensemble track forecast of three global models [i.e., the Global Forecasting Sys-tem (GFS) of NCEP, the Navy Operational Global At-mospheric Prediction System (NOGAPS) of the Fleet Numerical Meteorology and Oceanography Center (FNMOC), and the JMA Global Spectral Model (GSM)].
Nevertheless, Aberson (2002, 2003) found very small changes in track forecasts with the Geophysical Fluid Dynamics Laboratory (GFDL) hurricane model after the use of the dropwindsonde data. Wu07 also showed that the average improvement of the dropwindsonde data made by DOTSTAR to the 72-h typhoon track prediction in the GFDL hurricane models is an insig-nificant 3%. This is likely due to the fact that in the initialization of the GFDL hurricane model, a bogused vortex is added into the initial analysis from NCEP GFS, which already contains the dropwindsonde data information. Therefore, the bogused vortex would swamp the dropwindsonde data when they are not con-sistent with each other. The above results are concon-sistent with Tuleya and Lord (1997), where they showed that the bogusing system retarded the positive impact of dropwindsonde for as long as two days. Wu07 sug-gested that an optimal way of appropriately combining the dropwindsonde data with the bogused vortex in the mesoscale model needs to be developed in order to further boost the effectiveness of the dropwindsonde data.
In short, it has been shown that either the bogusing of the initial storm vortex (Kurihara et al. 1998) or the assimilation of dropwindsonde data (Aberson 2004; Wu07) alone can improve the track forecast of the ty-phoons. However, as noted above, when both issues are taken into account, how to optimally combine the bo-gused vortex with the dropwindsonde data becomes a critical problem worthy of further study. Therefore, to maximize the use of dropwindsonde data in the storm environment while inserting a suitable vortex into the numerical model, in this paper we investigate a method
to appropriately combine the dropwindsonde data with the bogused vortex during the initialization procedure. The proposed new method is presented and tested in three typhoon cases where the dropwindsonde data show a very positive impact. The detailed methodology of combining the dropwindsonde data and the bogused vortex, along with the designed experiments, is de-scribed in section 2. Results on the track and intensity forecast and the implications from these experiments are discussed in section 3. The conclusions are shown in section 4.
2. Methodology and experimental design
A single domain with 15-km resolution (301⫻ 301 grid points; 23 sigma vertical levels) of the latest version of the fifth-generation Pennsylvania State University– National Center for Atmospheric Research Mesoscale Model (MM5, V3.7.2) is adopted to examine the role of the dropwindsonde data and the bogused vortex on the TC forecasts. The model physics include the mixed-phase microphysics scheme (Reisner et al. 1998), the Grell cumulus parameterization scheme (Grell 1993), the Medium-Range Forecast (MRF) planetary bound-ary layer scheme (Hong and Pan 1996), and the cloud– radiation interaction scheme (Dudhia 1993). The de-tailed descriptions of the model can be obtained from Grell et al. (1995). Typhoons Meari, Conson, and Megi (2004; Fig. 1) are analyzed. In these three cases, the
FIG. 1. The JTWC best track and the deployed locations of the dropwindsondes for Typhoons Conson (Xs), Megi (open tri-angles), and Meari (crosses). The black squares indicate the cen-ter locations of Conson, Megi, and Meari during the DOTSTAR observations at 1200 UTC 8 Jun, 1200 UTC 16 Aug, and 1200 UTC 25 Sep 2004, respectively.
global models (such as the NCEP GFS and FNMOC NOGAPS) show a rather positive impact on the 72-h track prediction when 17, 16, and 16 dropwindsonde data corresponding to each storm are assimilated (Wu07). The model’s initial and lateral boundary con-ditions and sea surface temperature are obtained from the denial runs (without using the dropwindsonde data) of the NCEP GFS model.
As practiced in the surveillance observations of the Atlantic TCs using the G-IV aircraft (Aberson and Franklin 1999; Aberson 2004), the DOTSTAR makes dropwindsonde observations at the targeted areas sur-rounding the TC (generally more than 300 km away from the storm center). Such special observations of the TC environment in DOTSTAR have shown a positive impact on track forecasts when included in global mod-els (Wu07). However, since DOTSTAR does not con-duct observations in the inner core of the storm, the dropwindsonde data may somewhat improve the analy-sis of the storm’s outer circulation (at about 300-km radius), yet provides very limited impact on the analysis of the inner-core storm structure. Therefore, the impact of the dropwindsonde data on the typhoon intensity prediction is usually limited, and not as effective as that from an implanted bogused vortex (Kurihara et al. 1995).
The purpose of this work is to design a method to suitably combine dropwindsonde data (in the storm en-vironment) with an implanted bogused vortex (in the inner few hundred–kilometer core of the storm) and to improve both the track and intensity predictions.
To avoid the interference of dropwindsonde data with the bogused vortex, our strategy is to first bogus the vortex based on the analysis from Joint Typhoon Warning Center (JTWC; using information such as the storm location, maximum surface wind, minimum cen-tral sea level pressure, and the radius of the maximum surface wind) within the 200–300-km ring outside which the dropwindsondes are generally deployed. After the bogused vortex is implanted in the model, the three-dimensional variational data assimilation (3DVAR) procedure of MM5 (Barker et al. 2004) is used to as-similate the dropwindsonde data obtained from DOT-STAR.
To assess the impact of the dropwindsonde data, as well as the bogused vortex, four different experiments [with or without the dropwindsonde and with or with-out the bogused vortex (Table 1)] are designed. The experiment BNDN represents a forecast in which the initial and boundary conditions are directly interpo-lated from the denial runs (without using the dropwind-sonde data) of the NCEP GFS model (i.e., no bogused vortex is implanted and no dropwindsonde data are
assimilated into the model); the experiment BNDY is the same as BNDN, except that the dropwindsonde data are assimilated. The two sets of experiments, BYDN and BYDY, are similar to BNDN and BNDY, respectively, except that the bogused vortex is im-planted in the storm core region at the initial time. As described in the previous paragraph, in the BYDY ex-periments, the bogused vortex is implanted in the initial storm center first, and then the dropwindsonde data are assimilated into the model based on the 3DVAR.
The detailed descriptions below discuss the way that the bogused vortex is implanted and the way that drop-windsonde data are assimilated to the model.
a. Implanting the bogused vortex in the inner core region
Because of the lack of observations in the storm re-gion and the limited horizontal resolution for the global analyses available on the reachable public domain (e.g., the FTP site of the NCEP GFS products) in real time, global analyses generally do not resolve the detailed structure of TCs well. Therefore, storm intensity in global analyses is often underestimated. For this rea-son, when these global analyses are used to drive me-soscale or hurricane models, a bogused vortex spun up from a separate simulation or prediction is generally adopted in the initialization process in order to obtain a more reasonable initial storm structure (Kurihara et al. 1995; Wu et al. 2002). In the method proposed here, a Rankine vortex using the bogusing scheme of Low-Nam and Davis (2001) with the strength analyzed from the JTWC is implanted 6 h prior to the model’s initial time. This simple scheme for bogusing TCs is part of the MM5 system, which can extract weak and broad vorti-ces from the global analysis and implant an axisymmet-ric nonlinear balanced Rankine vortex (according to the actual storm position, the radius of maximum wind, and the maximum sustained wind to initialize the model).
Taking Typhoon Meari as an example, the DOT-STAR mission for Meari was conducted at 1200 UTC 25 September 2006. Since the maximum sustained wind
TABLE1. Summary of the four main experiments in all examined cases. Experiment Bogused vortex implanted Dropwindsonde data assimilated BNDN No No BNDY No Yes BYDN Yes No
of Meari was estimated at 57 m s⫺1(110 kt) by JTWC at 1200 UTC 25 September 2006, the Rankine vortex, with a 60-km radius of maximum wind and a 65 m s⫺1 maxi-mum wind,1 was first created at 0600 UTC. Then the
6-h model integration2 is performed to produce a
spunup asymmetric vortex at 1200 UTC. Following Wu et al. (2002) for obtaining a model-consistent and asym-metric vortex structure, this study replaces the model’s three-dimensional control variables (pressure perturba-tion, horizontal and vertical winds, temperature, and water vapor) in the storm core region with the above spunup vortex as the new initial condition at 1200 UTC for Meari.
Since the dropwindsondes are generally deployed outside the circle 300–400 km away from the storm cen-ter, to avoid a conflict between the bogused vortex in-formation and the dropwindsonde data, the replace-ment domain is typically chosen to be inside the region where dropwindsonde data are available. By doing so, the observed dropwindsonde data would not be seri-ously contaminated by the artificially bogused vortex. Note that for the case of Meari, as shown in Figs. 1 and 2c, the dropwindsonde data are generally taken at least about 400 km away from the storm center. Therefore, the circular region with a radius of 400 km (R2) is
se-lected for vortex replacement. Specifically, inside the inner 200-km radius (R1, shown as the solid circle in
Fig. 2c), the model data are completely replaced by the spunup vortex, while a linear transition zone between the 200- and 400-km radius is used to smoothly blend the spunup vortex with the original global analysis.
For the case of Conson, the DOTSTAR mission was conducted at 1200 UTC 8 June 2004. Since Conson was located close to Luzon at the time of the flight mission, to avoid releasing the dropwindsondes over the land-mass of Luzon, the dropwindsondes were deployed at a location about 150–200 km from the storm center. Therefore, the implantation of the bogused vortex is within the 150-km-radius region (i.e., R1⫽ 75 km and
R2⫽ 150 km). For the Megi case, the R1and R2are the
same as those of Meari, which are 200 and 400 km, respectively.
b. Assimilating the dropwindsonde data after the bogused vortex is implanted
The MM5–3DVAR system was used to assess the impact of the dropwindsonde data on this study. The system is designed for use in real-time applications and is available to the data assimilation community for gen-eral research. Its configuration is based on an mental formulation, producing a multivariate incre-mental analysis for pressure, wind, temperature, and relative humidity in the model space. The background error covariance matrix allows for a separate definition of the vertical and horizontal correlation functions. The climatological background error covariances and statis-tical regression coefficients are estimated via the Na-tional Meteorological Center (NMC) method of aver-aged forecast differences (Parrish and Derber 1992). A detailed description and application of the MM5– 3DVAR system can be found in Barker et al. (2004).
The MM5–3DVAR system is used to assimilate the dropwindsonde data in our experiments (e.g., BNDY and BYDY). Note that in BYDY (BNDY), the drop-windsonde data are assimilated into the model’s analy-sis field from the NCEP GFS where the bogused vortex has (has not) been implanted.
3. Results
a. The dropwindsonde data and the bogused vortex impact on the initial analyses
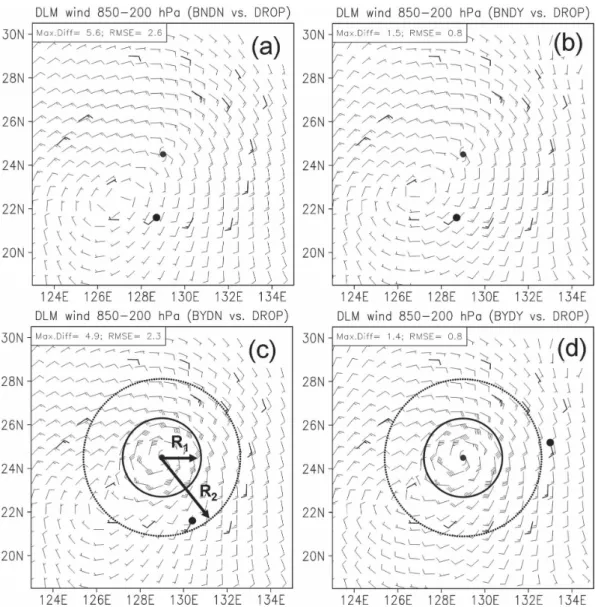
To assess the impact of the dropwindsonde data and the bogused vortex on the model’s initial analysis, the difference of the 850–200-hPa deep-layer-mean (DLM; as in Aberson 2002) wind between the model analysis and the observed dropwindsonde data for Typhoon Meari at 1200 UTC 25 September 2004 is examined (Fig. 2). Regarding the impact of the dropwindsonde data, the comparison of the DLM wind difference in experiments BNDN and BNDY (Figs. 2a,b) shows that when the dropwindsonde data are assimilated into the model, the analysis DLM wind agrees much better with the observed value from the dropwindsonde. In other words, the maximum DLM wind difference decreases from 5.6 to 1.5 m s⫺1, and the root-mean-square error (RMSE) among the 17 dropwindsonde soundings and the corresponding analyses interpolated to the sound-ing locations from the grid points is also reduced from 2.6 to 0.8 m s⫺1. The above result clearly indicates that the MM5–3DVAR efficiently assimilates the dropwind-sonde data into the model, thus positively enhancing
1This number is slightly larger than the JTWC estimate of 57
m s⫺1at 1200 UTC because the intensity of the implanted axi-symmetric Rankine vortex would generally slightly decay in the follow-up 6-h model integration while adjusting itself with the asymmetric model environment toward a more balanced state.
2The maximum surface wind and central pressure would
gen-erally reach the quasi-steady state after the 6-h integration; thus the spunup vortex from the 6-h model integration is used. In real-time calculation (as done in this paper), the spunup vortex is obtained from the previous 6-h operational forecasts. This 6-h increment from the birth of the cyclone is similar to the relocation procedure in the NCEP GFS model (Liu et al. 2000).
the impact of the dropwindsonde data from DOT-STAR. This result is rather consistent with that shown in the NCEP GFS model (Wu07).
As to the impact from the implantation of the bo-gused vortex, as shown in experiment BYDN (Fig. 2c), the inner core structure becomes more intense as com-pared to the BNDN [i.e., the maximum DLM wind increases from 20 (without bogusing) to 55 m s⫺1(with bogusing)].
Note that as compared to the DLM wind from the dropwindsondes that are located at about 350–400 km from the storm center, the RMSE difference between the BYDN and the dropwindsonde soundings is about
2.3 m s⫺1. This result indicates that the outer circulation of Meari is still not very accurate, despite that its inner core intensity is better represented by the bogused vor-tex. When the dropwindsonde data are assimilated af-ter the implantation of the bogused vortex (i.e., BYDY, as in Fig. 2d), not only is a reasonably represented inner core structure shown, but also a better analyzed outer circulation is obtained, with the RMSE of the DLM wind difference at 0.8 m s⫺1.
Figure 3a also shows the difference of DLM wind fields between the BNDY and BNDN experiments. It is found that major differences occurred at the deployed locations of the dropwindsondes, with the maximum
FIG. 2. Comparison of the DLM (850–200 hPa) wind between the dropwindsonde soundings (thick black wind barbs) and the model analysis (black wind barbs, interpolated to the location of each sounding) for experiment (a) BNDN, (b) BNDY, (c) BYDN, and (d) BYDY. The boldface bullets represent the locations where the largest DLM wind difference appears. The numbers in the upper left corners of (a)–(d) show the value of the largest DLM wind difference and the RMSE between all sounding locations.
difference of about 4 m s⫺1 on the southern side of Meari, where the fourth to seventh dropwindsondes are located. This result is similar to the result in the NCEP GFS analysis in Wu07, which also employs the 3DVAR data assimilation. However, some difference in the DLM wind exists (Fig. 3b) between BYDY and BYDN, with the major DLM wind difference located outside the dropwindsonde-deployed locations and the local maximum difference to the southwest of the fourth dropwindsonde at the magnitude of 4 m s⫺1. The com-parison of Figs. 3a and 3b clearly shows that the incre-ment caused by the assimilation of the dropwindsondes depends on whether or not the background field con-tains the bogused vortex. It may be asked why the maxi-mum increments in BYDY do not collocate with the data. It is possible that after implantation of the bo-gused vortex in BYDY, the background wind field be-comes much stronger in regions outside the dropwind-sonde locations; therefore, during the assimilation pro-cess of the dropwindsonde data, more increments are generated in those regions.
b. Track evaluation
The best track from JTWC, all 72-h model tracks from the above four experiments initialized at 1200 UTC 25 September 2004, and the model track position errors verified against the best track of JTWC are shown in Fig. 4. For the experiment without implanta-tion of the bogused vortex and without assimilaimplanta-tion of
the dropwindsonde data (BNDN), the model overpre-dicts the westward movement of Meari in the first 12 h and has a southward track bias during 12–24 h. This significant bias in the first 24 h results in a weak
inter-FIG. 4. The JTWC best track (typhoon symbols) and the fore-cast tracks of Typhoon Meari from model experiments initialized at 1200 UTC 25 Sep 2004. Model track errors (TE; km) verified against the JTWC best track and the track error improvement (TEI; km) relative to the BNDN experiment are shown in the bottom table of the figure.
FIG. 3. The difference of the DLM (850–200 hPa) wind field between (a) BNDY and BNDN, and (b) BYDY and BYDN. The
numbered black dots indicate the locations and the sequence of the dropwindsondes deployed in DOTSTAR. The solid and dotted circles in (b) represent the 200- (R1) and 400-km (R2) radius circle, respectively.
action of Meari with the approaching upper midlatitude trough, thus leading to an unrealistic track, which makes landfall in Taiwan at about 36 h. When the drop-windsonde data are assimilated into the model without the bogused vortex (BNDY), despite somewhat smaller westward bias in the first 24 h, Meari recurves to the north at about 30 h. Therefore, the track error is re-duced to 125, 290, and 574 km for 24, 48, and 72 h, respectively, as compared to that of 392, 706, and 1263 km in the BNDN experiment. This result of significant track error reduction due to the use of the dropwind-sonde data has also been demonstrated in the NCEP GFS model (Wu07).
Next, regarding the experiments with the implanta-tion of the bogused vortex (BYDN and BYDY), it is clearly shown that in the case of Meari the tracks are greatly improved (especially on the forecast of the re-curvature of Meari) when the bogused vortex is added into the model no matter whether or not the dropwind-sonde data are used. Meanwhile, when both the bo-gused vortex is implanted and the dropwindsonde data are assimilated (BYDY), the model is very close to the best track, with the track error of 70, 22, and 134 km at 24, 48, and 72 h, respectively. Results from the above dramatic improvement of the model track indicate that
the implantation of the bogused vortex plays a more significant factor than the dropwindsonde data does in improving the track of Meari. However, the combina-tion of both the dropwindsonde data and the bogused vortex to the model leads to the best track forecast for Meari. In all, the above study shows that the proposed method in assimilating the dropwindsonde data after the implantation of the bogused vortex provides a very effective tool to improve the initialization of the TC model and its follow-up forecasts.
c. How the implantation of the bogused vortex and the use of dropwindsonde data help to improve the track forecast
The improvement in track forecast after the use of the bogused vortex and dropwindsonde data has been shown in section 3b. In this section, we examine how the track forecast of Meari is improved after the im-plantation of the bogused vortex and/or the use of dropwindsonde data. First, the inner core vertical struc-ture of potential vorticity and wind speed distribution of the four experiments are examined in Figs. 5a–d. It is clear that no obvious potential vorticity maximum ex-ists near the core of Meari in BNDN (Fig. 5a). How-ever, when the dropwindsonde data are assimilated
FIG. 5. West–east cross section through the storm center of potential vorticity (PVU; dashed contour),-component wind speed (m s⫺1;
(BNDY), though the local potential vorticity maximum still cannot be recovered, the initial flow over the east-ern part of the cyclone is enhanced, especially in the upper layer near 400 hPa (Fig. 5b). In other words, the vertical extent of the cyclone is slightly deepened in BNDY as compared to BNDN.
For BYDN (Fig. 5c), it can be found that the typical storm structure is well presented, such as the presence of maximum potential vorticity of 21.8 potential vortic-ity units (PVUs; 1 PVU⫽ 1 ⫻ 10⫺6m2s⫺1K kg⫺1) in
the center and maximum tangential wind of 63.1 m s⫺1 on the eastern side of the eyewall region. Moreover, when both the bogused vortex and dropwindsonde data are considered (BYDY; Fig. 5d), besides the storm core structure being recovered, some asymmetric patterns near 400 hPa (such as the enhanced flow over the east-ern part and the reduced flow in the westeast-ern flank, mainly influenced by the assimilated dropwindsonde data) also exist. Meanwhile, the maximum tangential wind increases from 63.1 to 66.7 m s⫺1and the potential vorticity at 400 hPa increases from 21.8 to 24.2 PVU. Overall, it is clearly shown that the vertical extent of Meari is much deeper in the forecasts with the implan-tation of the bogused vortex (such as BYDY and BYDN). It is likely that the vertical extent of the model storm governs Meari’s steering flow partly associated with the approaching upper-level trough. To further investigate this issue, two extra experiments implanting a slightly weaker bogused vortex are performed (see Figs. 5e,f and Table 2; denoted as BYDN-W and BYDY-W for the cases without and with assimilating the dropwindsonde data, respectively).
The model tracks of BYDN-W and BYDY-W are shown in Fig. 6. Instead of simulating the recurvature of Meari, the storm in BYDN-W incorrectly moves to-ward Taiwan. On the other hand, the recurved track is better captured in the BYDY-W. Figures 5e,f show the east–west cross sectional structure of the weaker vorti-ces implanted in BYDN-W and BYDY-W. The storm is
shown to be weaker than those in BYDN and BYDY (Figs. 5c,d), with the maximum potential vorticity of approximately 12 PVU and the maximum tangential wind speed of 34 m s⫺1. Note that comparison of the vertical structure between BYDN-W and BYDY-W shows that the upper circulation over the eastern part can also be enhanced when the dropwindsonde data are assimilated. In other words, a stronger vertical extent of Meari appears in the BYDY-W than in BYDN-W.
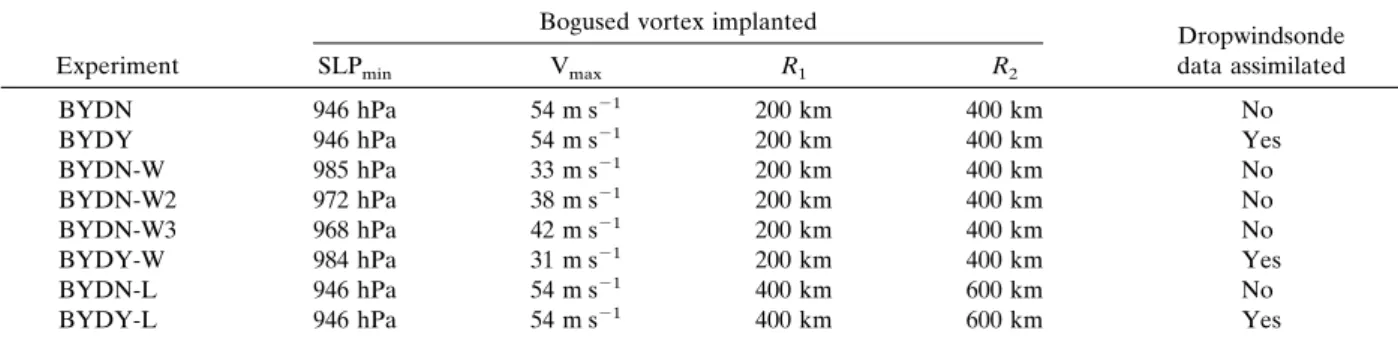
Figure 6 also demonstrates a series of tracks of model experiments with different implanted vortex strength, where the minimal central sea level pressure (lowest level maximum wind speed) varies from 985, 972, 968, to 945 hPa (from 33, 38, 42, to 54 m s⫺1) for BYDN-W, BYDN-W2, BYDN-W3, and BYDN, respectively. This shows that when the more intense bogused vortex is implanted, the model can better simulate the recurva-ture scenario.
Overall, when no bogused vortex is implanted or
FIG. 6. As in Fig. 4, but showing the forecast tracks of BYDN-W, BYDY-W, BYDN-W2, BYDN-W3, and BYDN. TABLE2. Summary of sensitivity experiments on the bogused vortex for Typhoon Meari. SLPminstands for the minimal central sea
level pressure, and Vmaxfor the lowest-level maximum wind speed. R1and R2are the inner and outer vortex radii, respectively.
Experiment
Bogused vortex implanted
Dropwindsonde data assimilated
SLPmin Vmax R1 R2
BYDN 946 hPa 54 m s⫺1 200 km 400 km No
BYDY 946 hPa 54 m s⫺1 200 km 400 km Yes
BYDN-W 985 hPa 33 m s⫺1 200 km 400 km No
BYDN-W2 972 hPa 38 m s⫺1 200 km 400 km No
BYDN-W3 968 hPa 42 m s⫺1 200 km 400 km No
BYDY-W 984 hPa 31 m s⫺1 200 km 400 km Yes
BYDN-L 946 hPa 54 m s⫺1 400 km 600 km No
when only a weaker vortex is implanted, we find that the model forecast initialized without assimilating the dropwindsonde data cannot well capture the recurva-ture of Meari and thus would result in much larger track error. Meanwhile, with either a stronger im-planted vortex or the dropwindsonde data assimilated, the recurvature of Meari can be better simulated. When both the bogused vortex and the dropwindsonde data are combined together, as in BYDY, the most accurate track forecast is produced.
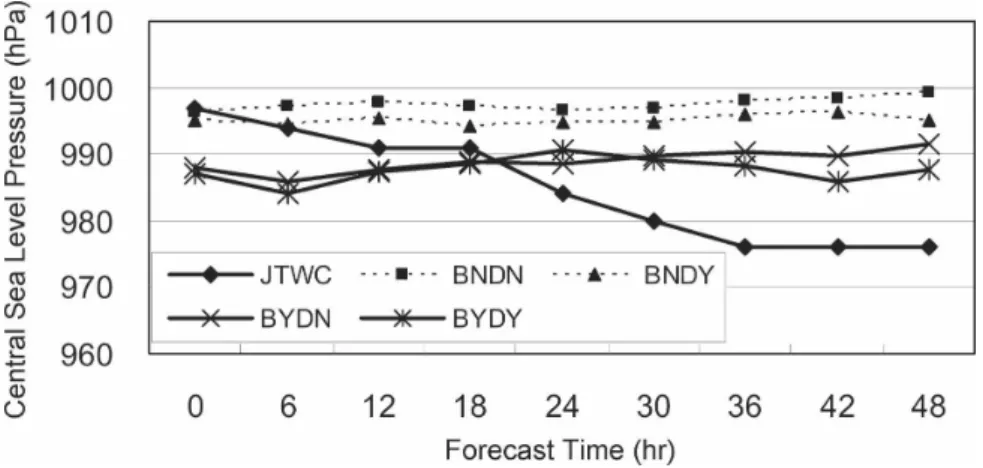
d. Intensity evolution
The 72-h intensity forecasts from the above four ex-periments as compared to the intensity analysis from JTWC of Meari are shown in Fig. 7. First, as compared to the intensity evolution with the JTWC analysis, the intensity in both BNDN and BNDY runs is underesti-mated by more than 40 hPa in the first 36 h. The inten-sity in the BNDN experiment is still largely underesti-mated after 36 h while the model storm incorrectly makes landfall in Taiwan at 42 h. On the other hand, after 36 h the BNDY experiment gradually intensifies and matches the analysis of 976 hPa at 72 h by JTWC. In other words, comparison of BNDN and BNDY shows that BNDY has a better intensity prediction at a later time due to the improved track (without the un-realistic landfall).
Note that the analysis from the operational global model (such as NCEP GFS) tends to underestimate the storm intensity, as shown in the NCEP global tropo-spheric final analyses (NFNL) in Fig. 7. Thus when us-ing the global analysis to initialize the mesoscale model [such as MM5 and Weather and Research Forecasting (WRF)], the unrepresentatively weak TC intensity at the initial time will lead to the underprediction of storm intensity. When the bogused vortex is implanted in the
model (BYDN and BYDY), the problem with the ini-tially underestimated intensity is relieved (i.e., the over-all intensity error in both experiments is reduced to about 20 hPa, a 50% error reduction as compared to those forecasts without bogusing). The improvement of the storm intensity forecast allows us to use these nu-merical models to gain more insight into the dynamics of the inner core (Zhang et al. 2002; Wang 2001; Wu et al. 2003) and the associated rainfall and flooding fore-cast and simulation when TC makes landfall (Wu et al. 2002).
e. Sensitivity to the size of the implanted bogused vortex
To assess the sensitivity of the size of the bogused vortex to the impact of the dropwindsonde data on the model forecast, two other experiments with a larger implemented bogused vortex are conducted. These two sensitivity experiments are identified as BYDN-L and BYDY-L, where the radii for the implanted bogused vortex are increased to R1⫽ 400 and R2⫽ 600 km as
compared to R1⫽ 200 and R2⫽ 400 km in BYDN and
BYDY.
The model tracks of BYDN-L and BYDY-L are shown in Fig. 8a, with forecast track error in BYDY-L (BYDN-L) of 40 (22), 128 (115), and 366 (251) km for 24, 48, and 72 h, respectively. In the case when the bogused vortex is implanted in a region larger than the domain of the deployed dropwindsondes in DOT-STAR, the assimilation of the dropwindsonde data in BYDY-L shows no improvement to the forecast with-out using the dropwindsonde data (BYDN-L). Mean-while, the comparison of the DLM wind between the dropwindsonde soundings and the model analysis of BYDY-L (Fig. 8b) shows the largest DLM wind differ-ence of 1.7 m s⫺1and the RMSE of 1.0 m s⫺1, which is
FIG. 7. Time series of the intensity (hPa) of Meari from the JTWC analysis and from all model experiments initialized at 1200 UTC 25 Sep 2004.
somewhat higher than those of 1.4 and 0.8 m s⫺1 in BYDY (see Fig. 2d).
The above two extra experiments (BYDN-L and BYDY-L) highlight how the implanted larger bogused vortex affects the background field, which contami-nates the dropwindsonde data during the data assimi-lation. For this reason, in order to improve the forecast of both track and intensity, it is practically useful to consider implanting the bogused vortex in the domain within the major targeted area for the dropwindsonde deployment of DOTSTAR.
f. Application to Typhoon Conson (2004) and Typhoon Megi (2004)
Typhoons Conson and Megi are two other distinct cases that demonstrated significant track improvement after the use of the dropwindsonde data from DOT-STAR (Wu07). Nevertheless, as indicated in Wu07, even though the operational models (such as NCEP GFS and FNMOC NOGAPS) have shown a 66-h track error reduction of about 40% with the use of the drop-windsonde data, the 66-h track error of 800 km is rather large as compared to the average 72-h typhoon track forecast error of 370 km for the entire TC season of the year 2004 (M. Peng 2006, personal communication). Therefore, the above method is applied to the Conson case, and the impact of the proposed method is exam-ined.
The model tracks from four different numerical ex-periments and the best track of JTWC are shown in Fig.
9. It is found that without the bogused vortex implan-tation and without the assimilation of the dropwind-sonde data to the model (BNDN), the model storm tends to move northeastward more slowly, thus having a track error of 1066 km at 66 h, the worst among the four experiments. However, when the dropwindsonde data are assimilated to the model (BNDY), the track pattern is closer to the best track, and the track error at 66-h forecast is reduced to 640 km. This result
pre-FIG. 9. As in Fig. 4, but for Typhoon Conson, with model experiments initialized at 1200 UTC 8 Jun 2004. FIG. 8. (a) As in Fig. 4, but showing the forecast tracks of BYDN-L and BYDY-L. (b) As in Fig. 2d, but for the comparison
sented by the MM5 model here is consistent with the results shown in the operational NCEP GFS and FNMOC NOGAPS models examined (Wu07). When considering the implantation of the bogused vortex (BYDN), its track pattern is similar to the result of experiment BNDN, with a slight improvement in the increase of the translation speed, which in turn reduces the track error to 877 km at 66 h.
The comparison between BYDN and BNDY in Fig. 9 shows that the assimilation of the dropwindsonde data alone exerts a much more positive impact on the track improvement than the implantation of the bo-gused vortex alone. Ultimately, when both the implan-tation of the bogused vortex and the assimilation of the dropwindsonde data are applied to the model (BYDY), the track evolution is much closer to the best track and its track error at the 66-h forecast is further reduced to 605 km. In all, for the case of Typhoon Conson, the proposed method of combining the bogused vortex and dropwindsonde data in the model shows a reasonable positive impact on the track forecast, though the major impact is from the use of the dropwindsonde data.
Although the proposed method can improve the track forecast of Conson, the track errors remain large. The poor forecast for Conson appears in all three glob-al models (NCEP GFS, FNMOC NOGAPS, and JMA GSM) as shown in Wu07. It may be due to the uncer-tainty of the subtle influences from the synoptic-scale environment (such as the approaching midlatitude trough and the subtropical high in the Pacific), which were not well represented in the global analyses at that particular time.
Finally, the intensity improvement by the proposed initialization is shown in Fig. 10. It is found that the intensity error in the bogused experiment (BYDY) on average reduces by about 20%–30% in the first 36 h as
compared to the forecast without the bogused vortex implantation (BNDY). Note that despite the improve-ment of Conson’s intensity at the initial time with the bogused method employed in BYDY, however, the model storm cannot sustain such intensity and it weak-ens quickly. It remains a challenging task to further improve the intensity forecast in numerical models.
Figures 11 and 12 also show the track and intensity forecast results of Megi with the proposed method used. It is apparent that when both the bogused vortex and dropwindsonde data are utilized (BYDY), the slow bias of the model track in BNDN can be corrected, with the model track error of within 110 km throughout the forecast period, and the track error reduction as com-pared to BNDN is 96 and 401 km for 24 and 48 h,
FIG. 11. As in Fig. 4, but for Typhoon Megi, with model experiments initialized at 1200 UTC 16 Aug 2004. FIG. 10. As in Fig. 7, but for Typhoon Conson, with model experiments initialized at 1200
respectively. Regarding the intensity forecast of Megi, similar to the results of the Meari and Conson cases, the intensity can be further improved by 30%–40% when the bogused vortex is implanted.
g. Evaluation of all DOTSTAR cases in the year 2004
Wu07 showed that the average 6–72-h track error from the operational global model of NCEP can be reduced by 14% when the dropwindsonde data are as-similated. To understand the overall impact of the above proposed method, the same experiments (i.e., BNDN, BNDY, BYDN, and BYDY) are conducted for all 10 DOTSTAR cases of the year 2004.3
Figure 13 shows the comparison of the average track errors verified against the best track of JTWC from each experiment. It can be shown that the average 6–72-h track error is reduced by about 30% either with the dropwindsonde data assimilated or with the bo-gused vortex implanted. When both the dropwindsonde data and bogused vortex are used in the newly pro-posed method, the average track error is reduced by 40%. Statistical examination by the paired test with one-sided distribution (Larsen and Marx 1981) for BNDN and BYDY indicates that the track improve-ment at 6, 42, 48, 60, and 66 h is statistically significant at the 90% confidence level.
Meanwhile, for all 10 cases, the evolution of the av-erage intensity error (in terms of the minimal sea level pressure) is also evaluated for forecasts with and with-out the bogused vortex (as shown in Fig. 14). For the experiments without the bogused vortex (i.e., BNDN, BNDY), the average intensity error is gradually re-duced from 45 initially to 15 hPa at 72 h, since the model vortex is gradually spun up with time. However, for the bogused implanted experiments (i.e., BYDN, BYDY), the average intensity error increases from 15 initially to 25 hPa at 72 h, which still underpredicts the storm intensity. This might be because the current fore-cast with the 15-km resolution is not fine enough to resolve the realistic typhoon intensity. Nevertheless, it is clear that the average intensity error can be reduced by at least 20 hPa at the first 48-h forecast period. Over-all, the statistical examination for BNDN and BYDY shows that improvement of the intensity forecast by the proposed method is statistically significant at the 90% confidence level in the first 48 h.
In all, the substantial track and intensity improve-ment from the above 10 cases demonstrates the benefit of the proposed method of combining the dropwind-sonde data and the bogused vortex to improve the TC forecast in the mesoscale model.
4. Conclusions
A suitable two-step method of combing the drop-windsonde data and bogused vortex has been proposed to improve the initialization and prediction of TCs in the mesoscale numerical model for the DOTSTAR cases over the western North Pacific. First, a limited area of the bogused vortex spun up from the previous (6 h) model forecast is implanted in the model at the best track location and inside the area where the
drop-3Note that the radii of R
1and R2in the implantation of the
bogused vortex for 7 of the 10 cases are 200 and 400 km, respec-tively. For the other three cases (Conson, Nida, and Nanmadol), smaller values (R1and R2of 75 and 150 km for Conson, and 100
and 200 km for both Nida and Nanmadol) are used because these three typhoons are rather close to the island of Luzon with drop-windsondes deployed at about the 150- to 250-km circle around the storms.
FIG. 12. As in Fig. 7, but for Typhoon Megi, with model experiments initialized at 1200 UTC 16 Aug 2004.
windsondes are deployed, thus creating an initial con-dition containing a reasonably represented TC vortex. Second, the dropwindsonde data are assimilated to the above bogused field by the MM5–3DVAR system. The above two steps would make constructive use of infor-mation on both the observed dropwindsonde and the bogused vortex while avoiding their interference.
Meari, Conson, and Megi are examined in this study as cases with the most significant track improvement in DOTSTAR (Wu07). Four different experiments, with and without dropwindsonde, plus with and without the bogused vortex, are also performed to examine the relative impact of the dropwindsonde data and the bo-gused vortex. For Meari, the simulated track matches with the best track of JTWC quite well when the pro-posed method of combing the dropwindsonde data and the bogused vortex is applied. The track error at the
first 72-h forecasts is less than 80 km, which is much smaller than the errors associated with both the opera-tional global forecasts from the NCEP GFS and the FNMOC NOGAPS model of more than 500 km. In addition to the improvement in track prediction, it is also shown that the intensity of Meari is better captured with the proposed new method.
For the case of Conson, the simulated track is much closer to the best track when the proposed method is adopted. Although the track errors are still large (109, 276, and 605 km for 24, 48, and 66 h, respectively) for Conson in the BYDY experiment, it is much smaller than the 66-h track errors of 750 and 1220 km in NCEP GFS and FNMOC NOGAPS, respectively. It is also shown that the intensity errors can be reduced by about 20%–30% in the first 36-h forecast after the implanta-tion of the bogused vortex. For Megi, the forecast
re-FIG. 14. As in Fig. 13, but for the evaluation of the average error of absolute central sea level pressure error (hPa).
FIG. 13. The overall average track errors (km) relative to JTWC analysis in 10 evaluation cases of 2004. The numbers along the bottom axis are the number of cases at each forecast time.
sults indicate that when both the bogused vortex and dropwindsonde data are adopted, the slow bias of model track can be corrected, and the intensity can also be further improved by 30%–40%.
Nevertheless, note that the relative importance of the impact from the dropwindsonde data and the bogused vortex is subtle. For example, in the case of Conson, the track is improved mainly because of the use of the dropwindsonde data, while for the cases of Megi and Meari, the bogused vortex plays a more dominant role in improving the track forecast. Meanwhile, it is shown that the assimilation of both the dropwindsonde data and the bogused vortex can lead to the best track and intensity forecast in all cases; thus, the appropriate combination of the dropwindsonde data and the bo-gused vortex can effectively improve both track and intensity forecast.
The proposed method is also applied to all 10 cases of DOTSTAR missions in the year 2004. The results show that the average track and intensity error can be re-duced by 40% and 30%, respectively, when both the bogused vortex and the dropwindsonde data are used. The study outlined above indicates that the proposed method has the potential to improve both the track and intensity forecast while making use of both the drop-windsonde data and the bogused vortex in the model. Work is ongoing for all real-time cases of the future DOTSTAR program using the newly developed WRF (Skamarock et al. 2005) model. Moreover, note that greater consistency between the bogused vortex and dropwindsonde data may likely be achieved by inte-grating the bogus data assimilation (BDA) technique (Zou and Xiao 2000; Pu and Braun 2001; Park and Zou 2004; Wu et al. 2006) with the dropwindsonde data by the 4DVAR system, though this would require much higher computational cost, which is the reason why we propose the current simple bogused vortex implemen-tation method for real-time application. Following Wu et al. (2006), we have started to work on this BDA issue and plan to show the new results in a follow-up paper in the future. With the potential to improve the track and intensity forecasts of TCs, this method also provides an opportunity to explore the typhoon dynamics (such as the eyewall and typhoon–terrain interaction problems) of the real-case storms.
Acknowledgments. The work is supported through
the National Science Council of Taiwan by Grants 039-MY2, NSC95-2119-M-002-003-AP1, MOTC-CWB-96-6M-02, and NTU-96R0302, as well as the Office of Naval Research Grant N00014-05-1-0672. The authors thank all team members of DOTSTAR (especially Po-Hsiung Lin of NTU) for
help taking the observations, Sim Aberson for provid-ing the denial runs of the NCEP GFS and the helpful comments, and the National Center for High-Performance Computing (NCHC) for providing the computation resources.
REFERENCES
Aberson, S. D., 2002: Two years of operational hurricane synoptic surveillance. Wea. Forecasting, 17, 1101–1110.
——, 2003: Targeted observations to improve tropical cyclone track forecast guidance. Mon. Wea. Rev., 131, 1613–1628. ——, 2004: The G-IV surveillance era, targeting, and ensemble
forecasts (1997–present). Preprints, 26th Conf. on Hurricanes
and Tropical Meteorology, Miami, FL, Amer. Meteor. Soc.,
236–237.
——, and J. L. Franklin, 1999: Impact on hurricane track and intensity forecasts of GPS dropwindsonde observations from the first-season flights of the NOAA Gulfstream-IV jet air-craft. Bull. Amer. Meteor. Soc., 80, 421–427.
Barker, D. M., W. Huang, Y.-R. Guo, A. J. Bourgeois, and Q. N. Xiao, 2004: A three-dimensional variational data assimilation system for MM5: Implementation and initial results. Mon.
Wea. Rev., 132, 897–914.
Dudhia, J., 1993: A nonhydrostatic version of the Penn State– NCAR mesoscale model: Validation tests and simulation of an Atlantic cyclone and cold front. Mon. Wea. Rev., 121, 1493–1513.
Grell, G. A., 1993: Prognostic evaluation of assumptions used by cumulus parameterization. Mon. Wea. Rev., 121, 764–787. ——, J. Dudhia, and D. R. Stauffer, 1995: A description of the
fifth generation Penn State/NCAR Mesoscale Model (MM5). NCAR Tech. Note NCAR/TN-398⫹STR, 138 pp.
Hong, S.-Y., and H.-L. Pan, 1996: Nonlocal boundary layer ver-tical diffusion in a medium-range forecast model. Mon. Wea.
Rev., 124, 2322–2339.
Kurihara, Y., M. A. Bender, R. E. Tuleya, and R. J. Ross, 1995: Improvements in the GFDL hurricane prediction system.
Mon. Wea. Rev., 123, 2791–2801.
——, ——, and ——, 1998: The GFDL hurricane prediction sys-tem and its performance in the 1995 hurricane season. Mon.
Wea. Rev., 126, 1306–1322.
Larsen, R. J., and M. L. Marx, 1981: An Introduction to
Math-ematical Statistics and its Applications. Prentice-Hall, 530 pp.
Liu, Q., T. Marchok, H.-L. Pan, M. Bender, and S. Lord, 2000: Improvements in hurricane initialization and forecasting at NCEP with global and regional (GFDL) models. NOAA Tech. Procedures Bull. 472, 7 pp. [Available online at http:// www.nws.noaa.gov/om/tpb/472.htm.]
Low-Nam, S., and C. Davis, 2001: Development of a tropical cy-clone bogusing scheme for the MM5 system. Preprints, 11th
PSU/NCAR Mesoscale Model Users’ Workshop, Boulder,
CO, National Center for Atmospheric Research, 130–134. Park, K., and X. Zou, 2004: Toward developing an objective
4DVAR BDA scheme for hurricane initialization based on TPC observed parameters. Mon. Wea. Rev., 132, 1054–1069. Parrish, D. F., and J. C. Derber, 1992: The National Meteorologi-cal Center’s spectral statistiMeteorologi-cal-interpolation analysis system.
Mon. Wea. Rev., 120, 1747–1763.
Pu, Z.-X., and S. A. Braun, 2001: Evaluation of bogus vortex tech-niques with four-dimensional variational data assimilation.
Reisner, J., R. J. Rasmussen, and R. T. Bruintjes, 1998: Explicit forecasting of supercooled liquid water in winter storms using the MM5 mesoscale model. Quart. J. Roy. Meteor. Soc., 124, 1071–1107.
Skamarock, W. C., J. B. Klemp, J. Dudhia, D. O. Gill, D. M. Barker, W. Wang, and J. G. Powers, 2005: A description of the advanced research WRF version 2. NCAR Tech. Note NCAR/TN-468⫹STR, 88 pp.
Tuleya, R. E., and S. J. Lord, 1997: The impact of dropwindsonde data on GFDL hurricane model forecasts using global analy-ses. Wea. Forecasting, 12, 307–323.
Wang, Y., 2001: An explicit simulation of tropical cyclones with a triply nested movable mesh primitive equations model: TCM3. Part I: Model description and control experiment.
Mon. Wea. Rev., 129, 1370–1394.
Wu, C.-C., M. Bender, and Y. Kurihara, 2000: Typhoon forecasts with the GFDL hurricane model: Forecast skill and compari-son of predictions using AVN and NOGAPS global analyses.
J. Meteor. Soc. Japan, 78, 777–788.
——, T.-H. Yen, Y.-H. Kuo, and W. Wang, 2002: Rainfall simu-lation associated with Typhoon Herb (1996) near Taiwan. Part I: The topographic effect. Wea. Forecasting, 17, 1001–1015. ——, K.-H. Chou, H.-J. Cheng, and Y. Wang, 2003: Eyewall
con-traction, breakdown, and reformation in a landfalling typhoon. Geophys. Res. Lett., 30, 1887, doi:10.1029/ 2003GL017653.
——, and Coauthors, 2005: Dropwindsonde Observations for Ty-phoon Surveillance near the Taiwan Region (DOTSTAR): An overview. Bull. Amer. Meteor. Soc., 86, 787–790. ——, K.-H. Chou, Y. Wang, and Y.-H. Kuo, 2006: Tropical
cy-clone initialization and prediction based on four-dimensional variational data assimilation. J. Atmos. Sci., 63, 2383–2395. ——, ——, P.-H. Lin, S. Aberson, M. S. Peng, and T. Nakazawa,
2007a: The impact of dropwindsonde data on typhoon track forecasts in DOTSTAR. Wea. Forecasting, 22, 1157–1176. ——, J.-H. Chen, P.-H. Lin, and K.-H. Chou, 2007b: Targeted
observations of tropical cyclone movement based on the ad-joint-derived sensitivity steering vector. J. Atmos. Sci., 64, 2611–2626.
Zhang, D.-L., Y. Liu, and M. K. Yau, 2002: A multiscale numeri-cal study of Hurricane Andrew (1992). Part V: Inner-core thermodynamics. Mon. Wea. Rev., 130, 2745–2763.
Zou, X., and Q. Xiao, 2000: Studies on the initialization and simu-lation of a mature hurricane using a variational bogus data assimilation scheme. J. Atmos. Sci., 57, 836–860.