行政院國家科學委員會補助專題研究計畫期中進度報告
高速基因數據分析的統計方法研究(1/2)
計畫類別:個別型計畫
計畫編號:NSC 98-2118-M-009-002-MY2
執行期間:98 年 08 月 01 日至 99 年 07 月 31 日
計畫主持人:國立交通大學統計學研究所黃冠華副教授
共同主持人:無
計畫參與人員:陳穗碧、潘家群、林弘哲、林吟玲
成果報告類型(依經費核定清單規定繳交):期中精簡報告
本成果報告包括以下應繳交之附件:
出席國際學術會議心得報告
處理方式:除產學合作研究計畫、提升產業技術及人才培育研究計畫、
列管計畫及下列情形者外,得立即公開查詢
執行單位:國立交通大學統計學研究所
中 華 民 國 九 十 九 年 五 月 二 十 六 日
目 錄
中英文摘要 ... 2
緣由與目的 ... 2
結果與討論 ... 4
計畫成果自評 ... 9
附件:出席國際學術會議心得報告 ... 9
一、 中英文摘要
中文摘要 隨著近年來生物技術的快速發展,大量的生物資料與訊息方便地被蒐集。新穎的統計方法 能有系統地分析及整理大量的生物資料,因此有助於提升對複雜疾病中多重基因與環境因 子間交互作用的瞭解。在這個計劃裡,我們將發展有效的統計方法,用以分析鉅量的基因 表現量微陣列及單點核苷酸多型性標誌基因資料。對於微陣列晶片的分析,我們將評估各 種預處理方法與表現量差異方法的組合在信度與效度上的差異。在分析單點核苷酸多型性 標誌基因資料,我們將比較不同選取標籤單體核苷酸多態性的方法與不同相關性檢定方法 在不同樣本下的檢定力。對分析全基因體標誌基因,我們將致力於多重基因間交互作用的 研究,以期發展出一可有效分析大量標誌基因、並且準確的方法。 關鍵詞:母群體相關性檢定、基因表現量微陣列晶片、全基因體相關性檢定、高速基因數 據、單點核苷酸多型性標誌基因。 AbstractNovel statistical methodology can enhance understanding of the interactions between multiple genes and environmental factors on a complex disease. The massive amount of high-throughput genomic data brings a great challenge of developing advanced statistical and computational data mining tools. In this project, we make efforts to develop effective statistical methods for
analyzing these high-throughput data. The project focuses on two types of high-throughput data: gene expression microarray and single nucleotide polymorphism (SNP) markers. In gene
expression microarray analysis, we will evaluate combinations of the most popular preprocessing and differential expression methods in terms of validity and reliability. In the candidate-gene approach of SNP marker analysis, we will consider various SNP tagging criteria, haplotype block definitions and association tests, and estimate the power and type I error of these combinations. In the genome-wide approach of SNP marker analysis, we will develop and compare methods to search for a set of marker loci in different genes and to analyze these loci jointly.
Keywords: candidate-gene association study; gene expression microarray; genome-wide association study; high-throughput genomic data; single nucleotide polymorphism markers.
二、
與緣由目的
Novel statistical methodology can enhance understanding of the interactions between multiple genes and environmental factors on a complex disease. The massive amount of high-throughput
genomic data brings a great challenge of developing advanced statistical and computational data mining tools. In this project, we make efforts to develop effective statistical methods for
analyzing these high-throughput data. The project focuses on two types of high-throughput data: gene expression microarray and single nucleotide polymorphism (SNP) markers.
A. Gene expression microarray analysis
Microarray is a device designed to simultaneously measure the expression levels of many thousands of genes in a particular tissue or cell type. It is widely used in many areas of
biomedical research, especially Affymetrix GeneChip platform. Millions of probes with length of 25 nucleotides are designed on an Affymetrix array. Two categories of probes are designed: “perfect match (PM)” probe perfectly matches its target sequence and “mismatch (MM)” probe is created by changing the middle (13th) base of its paired perfect match probe sequence. The purpose of designing MM probes is to detect the nonspecific binding because their perfect match partners may be hybridized to nonspecific sequences. A paired PM and MM is called a “probe pair” and each gene will be represented by 11-20 probe pairs typically. Owing to this distinctive design, preprocessing Affymetrix expression arrays usually involves three main steps, which are background adjustment, normalization and summarization. Nowadays, a large number of
preprocessing methods have been developed to estimate expression levels of genes. Another fundamental goal of a microarray experiment is to identify those genes that are differentially expressed within different samples. For example, a disease may be caused by large expression of particular genes resulting in variation between diseased and normal tissues. The method used to detect the genes that express differentially between different samples is called the differential expression method.
Various preprocessing and differential expression methods have been proposed, and their developers using different datasets and criteria claim there are some features superior to other methods. To help users of the technology identify the best method for the particular task, we use the common datasets to evaluate combinations of the most popular preprocessing and differential expression methods in terms of validity and reliability.
B. SNP marker analysis
Population association studies with case-control designs are powerful in detecting the genetic variations responsible for human common diseases and are increasingly used in epidemiological studies. SNP markers are preferred for association studies because of their high abundance along the human genome, low mutation rate and the accessibility of high-throughput genotyping. Population association studies can be classified into two different types: the candidate-gene approach focuses on typing 5-50 SNPs within a gene hypothesized to be responsible for the studied disease, whereas the genome-wide approach seeks to identify the common causal variants throughout the genome and requires more than 300,000 well-chosen SNPs. This report intends to
compare various analytic combinations in performing the candidate-gene and genome-wide association studies
C. Specific aims
1. In gene expression microarray analysis, evaluate combinations of the most popular preprocessing and differential expression methods in terms of validity and reliability. 2. In the candidate-gene approach of SNP marker analysis, consider
pairwise-LD/haplotype-diversity criteria for SNP tagging,
confidence-interval/spine-of-strong-LD block definitions and single/multiple-SNP association tests, and estimate the power and type I error of selected tag SNPs to detect association.
3. In the genome-wide approach of SNP marker analysis, develop and compare methods to search for a set of marker loci in different genes and to analyze these loci jointly.
三、
結果與討論
Up to now we have done the followings:
1) In gene expression microarray analysis, evaluate combinations of the most popular
preprocessing and differential expression methods.
In the current study, we use various benchmark datasets to evaluate combinations of the most popular preprocessing and differential expression detection methods in terms of accuracy and inter-laboratory consistency. This study does not intent to identify the “best” combination of preprocessing and differential expression detection methods from existing literature. In fact, it is unlikely to identify the best combination because of the huge amount of existing methods and the availability of the software. We aim to explore, under different analytic purposes (accuracy and inter-laboratory consistency) and various microarray datasets with distinct characteristics, the conditions that best fit to preprocessing and/or differential expression combinations. Here we consider four commonly used preprocessing algorithms with each taking a distinct adjustment strategy. They include stochastic-model-based algorithms: Microarray Suite software Version 5.0 (MAS5), Probe Logarithmic Intensity Error (PLIER), DNA-Chip Analyzer (dChip) and Robust Multi-array Analysis (RMA), and physical-mode-based algorithm: Position-Dependent
Nearest-Neighbor (PDNN). There are five popular differential expression methods considered: Fold-change (FC), two sample t-test, Significance Analysis of Microarrays (SAM), Linear Models and Empirical Bayes methods (limma) and Parametric Empirical Bayes methods (EBarrays). Four benchmark datasets in total are used for evaluation. Two are spike-in datasets used to assess the accuracy: one from Affymetrix Latin square datasets (HGU133 Spike-in) and one from the Golden Spike Project (Golden Spike). One “real-world-sample” microarray dataset accompanying RT-PCR measurements from the MAQC project is also used for accuracy (MAQC
RT-PCR). ROC curves are used for the evaluation. To evaluate the inter-laboratory consistency, we use another dataset from the MAQC project, which was generated using samples hybridized to Affymetrix platform at two different laboratories (MAQC Rats). Overlap rates of differentially expressed gene lists from two laboratories are compared.
We have obtained the following results:
1. Only part of the area under the ROC curve is used for evaluating accuracy.
2. Pre-processing methods RMA, PLIER16 and PDNN produce superior accuracy for the HGU133 Spike-in dataset.
3. Pre-processing method dChip has the best accuracy for the Golden Spike dataset.
4. dChip is good for experiments with high signal intensities, whereas RMA and PDNN are good for low signal intensities.
5. Probe-set-level loess normalization is recommended, especially for experiments with high signal intensities.
6. Preprocessing methods PDNN and PLIER16 result in the best agreement with the TaqMan, while differential expression method EBarrays has the worst agreement.
7. Inter-laboratory consistency depends more on differential expression methods than on preprocessing methods with FC having the best performance.
8. Source codes for creating ROC curves, overlap plots and histograms of signal intensities are available.
2) In the candidate-gene approach of SNP marker analysis, evaluate combinations of
SNP tagging, haplotype blocking and association testing.
The present study considered pairwise-LD/haplotype-diversity criteria for SNP tagging, confidence-interval/spine-of-strong-LD block definitions, and single/multiple-SNP association tests. We were also interested in the effects of various samples used for tag SNP discovery, different approaches handing SNPs outside haplotype blocks and the sample sizes in association tests.
The Genetic Analysis Workshop 15 simulated dataset was used for this study
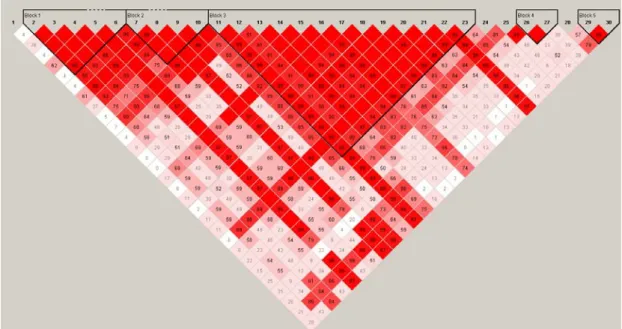
(http://www.gaworkshop.org/welcome.html/). The two region of total of 30 SNPs we selected , first region contain the disease locus D length about 260 kb and the other is away from locus D its length about 340 kb. Locus D has a direct effect on RA risk but a low allele frequency. Distance between the two regions is above 12662 Kb, 27 CM (centi-Morgan).With this distance we can say the null region can not affect the disease. Our goal was getting power from the causal region to see which match is the best and the null region can get type 1 error to compare. First we used the character of pair-wise LD plot to understand different of the two regions and difference number of tag SNPs using the four methods. We used the Haploview software to get the pair-wise LD plot of the two regions in Figures 1-2:
Figure 1. LD plot used 1500 cases and 1500 controls, CI-blocking in low LD region
Figure 2. LD plot used 1500 cases and 1500 control data CI-blocking in high LD region
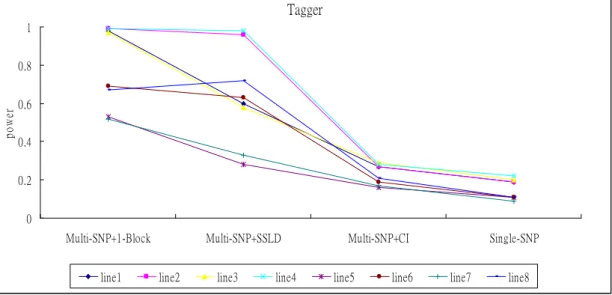
Second we did association study by using a mix subject from sample of 500 cases and 500 controls random from populations. Another setting is from 200 case sand 200 controls. When doing haplotype association study we used three blocking methods: Gabriel blocking, SSLD blocking and third is using 1 block for all region. Then we defined Bonferroni-corrected p-value let α 0.05 / (the number of haplotypes + the number of tag SNPs outside blocks) as using the = multi-SNP test; α 0.05 / (the number of tag SNPs) as using the single-SNP test. Then we used = 100 repeated random samples and estimated power with the proportion of replicates having p-value less than type 1 error. Results for Gabriel blocking (Tagger) are shown in Figures 3-4.
Tagger 0 0.2 0.4 0.6 0.8 1
Multi-SNP+1-Block Multi-SNP+SSLD Multi-SNP+CI Single-SNP
po
w
er
line1 line2 line3 line4 line5 line6 line7 line8
Figure 3. Power of tagger – association methods in casual region.
line1-line4 using association sample = 500, line5-line8 using association sample = 200, line1 and line5 using sample = control 50, line2 and line6 using sample = case 50, line3 and line7 using sample = control 100, line4 and line8 using sample = case 100
Tagger 0 0.2 0.4 0.6 0.8 1
Multi-test-1-Block Multi-test-SSLD Multi-test-GAB Single-test
pow
er
line1 line2 line3 line4 line5 line6 line7 line8
Fig 4. Power of tagger – association methods in null region.
3) Latent class prediction via k-means and hierarchical clustering procedures.
Parameters in latent class and latent profile models are typically estimated through the EM algorithm. Although this method has notable advantages, it can be very difficult to converge when analyzing the high-dimensional data. This paper proposes an alternative two-step approach for model fitting. In the first step, the k-means and hierarchical clustering algorithms are applied to search for the latent classes that best reflect the satisfaction of the conditional independence assumption underlying the latent variable model. The procedure is then followed by mixture modeling treating the class membership as known. The proposed approach can easily handle the
high-dimensional data. This paper also develops a new classification rule, based on latent
variable models. Our classification procedure can reduce the dimensionality of measured data and explicitly recognize the heterogeneous nature of the complex disease, which makes it perfect in analyzing high-throughput genomic data. Simulation studies and real data analysis demonstrate the advantages of our proposed methods.
4) We are currently writing up two manuscripts for initial results:
1. Title:
Evaluating preprocessing and differential expression combinations for Affymetrix GeneChip microarrays via spike-in, RT-PCR and cross-laboratory datasets
Abstract:
Microarray technology for gene expression has been widely used for several years and a large number of computational analysis tools have been developed. We focus on the most popular platform, Affymetrix GeneChip arrays. Despite the rich research on selecting the optimal method of preprocessing and/or detecting differential expression, this paper is unique in the following aspects. First, we have explored suitable combination of preprocessing and differential expression methods. Second, we have evaluated both accuracy and
inter-laboratory consistency on a variety of benchmark datasets with distinct characteristics. Third, we have compared stochastic-model-based and physical-mode-based preprocessing algorithms and gene-specific and empirical-Bayes’ differential expression detection. We consider popular preprocessing methods: MAS 5.0, PLIER, RMA, dChip and PDNN, and differential expression methods: fold-change, two sample t-test, SAM, limma and EBarrays. Two spike-in datasets and a “real-world-sample” microarray dataset accompanying RT-PCR measurements are used to assess accuracy, and ROC curves are used for the evaluation. To evaluate inter-laboratory consistency, we use a dataset from the MAQC project, which contains arrays generated at two different laboratories using replicated samples.
Inter-laboratory overlap rates of differentially expressed gene lists are compared. Our results show that accuracy is more sensitive to preprocessing methods, whereas inter-laboratory consistency is more sensitive to differential expression methods. We conclude that the signal intensity levels are the main factor that explains different performances between methods. We also recommend performing loess normalization at the probe set level.
2. Title:
Prediction of underlying latent classes via k-means and hierarchical clustering algorithms
Abstract:
Parameters in a finite mixture are typically estimated through the EM algorithm. Although this method has notable advantages, it can be very difficult to converge when analyzing the high-dimensional data. Here, we apply the k-means and hierarchical clustering algorithms to
first search for the optimal latent classes underlying the finite mixture model and then
estimate the parameters of the model. We also develop a new classification rule, based on the finite mixture model. Our classification procedure can reduce the dimensionality of measured data and explicitly recognize the heterogeneous nature of the complex disease, which makes it perfect in analyzing high-throughput genomic data. Simulation studies and real data analysis demonstrate the advantages of our proposed methods.
四、
計畫成果自評
We have met all proposed aims set in the proposal. Further things that need to be done are:
1) Will finalize the manuscript and submit it to the SCI journal.
2) Will build the analytic procedure for doing the genome-wide association study.
3) Will develop an integrate method to identify a set of loci that predict the complex trait. 4) Will apply (a) computational methods for data reduction and pattern recognition, (b)
statistical methods for evaluating gene-gene interactions, (c) gene set enrichment approach, and (d) endophenotype approach.
五、
附件:出席國際學術會議心得報告
計畫編號 NSC 98-2118-M-009 -002 -MY2
計畫名稱 高速基因數據分析的統計方法研究 出國人員姓名
服務機關及職稱 黃冠華/國立交通大學 統計學研究所/副教授
會議時間地點 September 22 (Tuesday) - 27 (Sunday), 2009 / Cambridge, UK 會議名稱 The Genomics of Common Diseases 2009
發表論文題目 Statistical validation of endophenotypes using a surrogate endpoint analytic analogue (poster)
1. 參加會議經過
The Genomics of Common Diseases 2009 was held at the Wellcome Trust Conference Centre, Wellcome Trust Genome Campus, Hinxton, Cambridge, UK, September 22 (Tuesday) - 27 (Sunday), 2009. The conference brought together leading participants in the field of genetic research on common diseases. The meeting addressed the topics of (1) the state of the art in genome-wide association studies, (2) population genetics, statistics and evolution challenges, (3) genomics and heritable susceptibility, (4) cell and animal models, and (5) the role of
The meeting includes 3 keynote lectures, 46 invited talks and 83 selected poster presentations. I presented my work “Statistical validation of endophenotypes using a surrogate endpoint analytic analogue” as a poster. This work was just published in the Genetic Epidemiology, 33, 2009. The abstract of my poster is as following:
Endophenotypes, which involve the same biological pathways as diseases but presumably are closer to the relevant gene actions than diagnostic phenotypes, have emerged as an important concept in the genetic studies of complex diseases. In this report, we develop a formal statistical methodology for validating endophenotypes. The proposed method was motivated by the conditioning strategy used for surrogate endpoints commonly seen in clinical research. We define an endophenotype to be “a trait for which a test of null hypothesis of no genetic heritability implies the corresponding null hypothesis based on the phenotype of interest”. An index, the proportion of heritability explained, is used as an operational criterion of validation. Statistical inferences on this index are also developed. Usefulness of the proposed method is demonstrated through computer simulations and a study of assessing the Continuous
Performance Test as an endophenotype of the schizophrenia spectrum.
2. 與會心得
This is a great meeting. I presented my work on endophenotypes and got lots of feedback. Some researchers are very interested in our work and some potential collaboration is under way.
In the meeting, I also get to know most recent advances in the genome-wide association studies (GWAS) and the next-generation sequencing technology. These are the two files that I most want to engage in. It is well known that the GWAS is an excellent way for detecting disease susceptible genes, but it requires a very large sample size to reach enough power for finding the true causal genes. Therefore, many institutes have invested enormous money to conduct the GWAS with more than 10,000 subjects. Meta analyses that combine many GWAS together are also under way, which can result in the GWAS with 100,000 or more individuals. In Taiwan, not many GWAS are conducted and the conducted GWAS are most with less than 2,000 individuals, which is apparently not enough in the current standard. To become visible in the GWAS research for Taiwan, it is urgent to gather more money to collect big enough sample size for current or future GWAS, or to seek for collaborations with other countries.
The next-generation DNA sequencing has a profound impact on the current genetic research. In the meetings, I saw many newly conducted genetic researches using this technique. They all obtained exciting results. Because this is a pretty new research area, we might be to invest ourselves to this field to be become the top in the world.
In this meeting, I am also impressed by the efforts of building an integrated genomic research team in many countries. Take the Wellcome Trust Institute where this conference was hold as an example. The institute has put all components of genetic researches together, including molecular and cell biology, animal model, translational genetics, biotechnology,
bioinformatics, statistics, and epidemiology. As a result, the institute has the full capability to conduct the integrated genomic research. The Broad Institute of MIT and Harvard is the other excellent example. We in Taiwan will need to think this more aggressive to form our own genomic research enterprise to catch the world’s progress.