Shall One Invest in Cancelled Targets after the Termination of
Mergers and Acquisitions?
Gene C. Lai*
Department of Finance, Insurance, and Real Estate, Washington State University, U.S.A.
Keith M. Moore
The Peter J. Tobin College of Business, St. John’s University, U.S.A. Henry R. Oppenheimer
College of Business Administration, University of Rhode Island, U.S.A.
Abstract
Many portfolio managers on Wall Street believe that investing in cancelled targets after the termination of mergers and acquisitions is a profitable strategy because arbitrageurs usually unwind their position after the cancellation announcement. While the anecdotal evidence shows that arbitrageurs do hold large positions in target companies when the deals are cancelled, we do not find that investing in cancelled targets is a profitable strategy. Our results also suggest that, in general, there is no relation between trading volume and abnormal returns. The overall evidence indicates that the target stocks are efficiently priced, and arbitrageurs unwinding their positions does not provide an opportunity for abnormal returns.
Key words: merger arbitrage; risk arbitrage; cancelled transactions; terminated takeovers JEL classification: G34; G14; G11
1. Introduction
Many portfolio managers on Wall Street believe that investing in cancelled targets after the termination of mergers and acquisitions is a profitable strategy. For example, Burnett (2004) examined a sample of mergers over a recent time period. Using raw returns he concluded that the strategy is profitable. Wall Street’s belief is based on their observation that after merger and acquisition announcements, the arbitrage community may establish a significantly large cumulative holding in the target company’s stock. When such combinations fail to achieve consummation,
Received June 20, 2006, revised September 4, 2006, accepted September 11, 2006.
*Correspondence to: Department of Finance, Insurance, and Real Estate, Washington State University, PO Box 644746, Pullman, WA 99164-4746, USA. E-mail: [email protected].
arbitrageurs generally sell their positions quickly into the market and look to reinvest the funds into active merger and acquisition situations. Portfolio managers try to use this strategy to exploit an oversupply of the target company’s stock that is created when risk arbitrageurs unwind their positions. However, if the capital markets are efficient, portfolio managers should not earn abnormal returns using this strategy.
The central research question addressed here is: does the strategy of investing in cancelled targets after the termination of mergers and acquisitions provide abnormal returns? Consistent with this we also ask: Are abnormal returns of cancellations different for different types of mergers and acquisitions, for different terminating parties, or for different terminating reasons?
The strategy of investing in cancelled targets is based on the belief of portfolio managers that there is an oversupply of target shares that is created by risk arbitrageurs. This leads to a second research question: are abnormal returns after cancellation announcements related to the level of arbitrage activities?
We use a sample of 153 target firms from canceled acquisitions during the period 1992 to 1999 to explore these issues. The results are summarized here. For our sample, we find that investing in target company stocks after merger or acquisition termination does not appear to be profitable strategy. When we categorize the sample by type of deal, we find that there is some evidence of positive abnormal returns from investing in target companies involved in cancelled tender offers. In contrast, we find that investing in cancelled merger and bear-hug targets results in negative abnormal returns. It should be noted that a “bear-hug” is an informal offer made by the acquiring company to the target company’s board of directors.
In instances where the acquiring company initiates the cancellation, we find that investing in target companies is a profitable strategy. On the other hand, investing in target companies is an unprofitable strategy when the target company cancels the deal or when the acquiring and the target companies mutually cancel the deal.
When we examine the strategy by reason for cancellation, we find disparate results. However, most of these results are not statistically significant. We also find, in general, there is no relation between arbitrage activities (or actually their proxies) and stock returns.
Our study contributes to the literature in several ways. First, this study provides a comprehensive study of cancellation of different types of mergers and acquisitions and different reasons for cancellations. Previous studies either investigate the cancellation of one type of deal or never examine the reasons behind the cancellation.
Second, we explicitly explore whether arbitrage activities have an effect on returns after the cancellation of all types of mergers and acquisition attempts. In contrast, Dodd and Ruback (1978) and Bradley (1980) studied tender offers while Asquith (1982) concentrated on mergers. Davidson et al. (1989) also studied only mergers. Chang and Suk (1998) included both tenders and mergers but computed returns only for acquiring companies. In subsequent sections of this paper we
provide discussion of the role of arbitrageurs before and after the cancellation announcements and the potential impact of the arbitrageur activities on the stock returns after cancellations. In addition, some anecdotal evidence of arbitrageur activities is provided using private data obtained from a proxy solicitation firm.
Third, we examine the cancellation of mergers and acquisitions from the perspective of portfolio managers in contrast to a prior literature that focuses on the results of initial market reactions. In addition to the initial reaction, we examine the strategy of investing in target companies in cancelled transactions up to a one-year investment time horizon.
2. Arbitrageurs, Cancellation, and Research Questions
In this section we describe the arbitrage process and arbitrageur holdings after mergers and acquisition (M&A) announcements. We then discuss the arbitrage activities when the cancellation of M&As are announced. Based on the discussions, we develop the two central research questions.
A. The Arbitrage Process after M&A Announcements
Arbitrageurs are a group of professional investors who concentrate their investment capital and efforts in investing in securities involved in M&A transactions. Once an M&A transaction is announced, the ownership of the target company’s stock undergoes a significant change. To understand these changes we must first have an understanding as to how the arbitrage process works.
The arbitrage process begins when the transaction is initially announced. Most arbitrageurs generally do not invest in securities based on rumors in the marketplace. Instead, they usually wait for the first public announcement of the event (Moore et al., 2006). The pre-announcement institutional and individual holders of targets are generally not accustomed to assessing the risks, rewards, and the probabilities of consummation in the post-announcement period. As a result, there is generally a stock transfer process where pre-announcement shareholders liquidate their holdings in order to reinvest the proceeds using their traditional investment decision processes. Arbitrageurs provide the buying interest that in effect transfers the risk of holding the securities subject to the M&A process from the traditional holders to the arbitrageurs. Since most M&A announcements frequently drive up the target’s price, target shareholders are encouraged to sell because it allows them to realize a vast majority of the premium offered immediately with no risk. In contrast, arbitrageurs focus on the spread between the target’s current price and the consummation value.
It should also be noted that arbitrageurs may also participate in a transaction by trading in listed options on the target company. Our sample includes information on the target company’s common stock as opposed to the listed options. We believe the possibility that arbitrageurs use options should not affect our results because arbitrageurs most likely would also use options to offset their original position.
B. The Size of Arbitrage Holdings after M&A Announcements
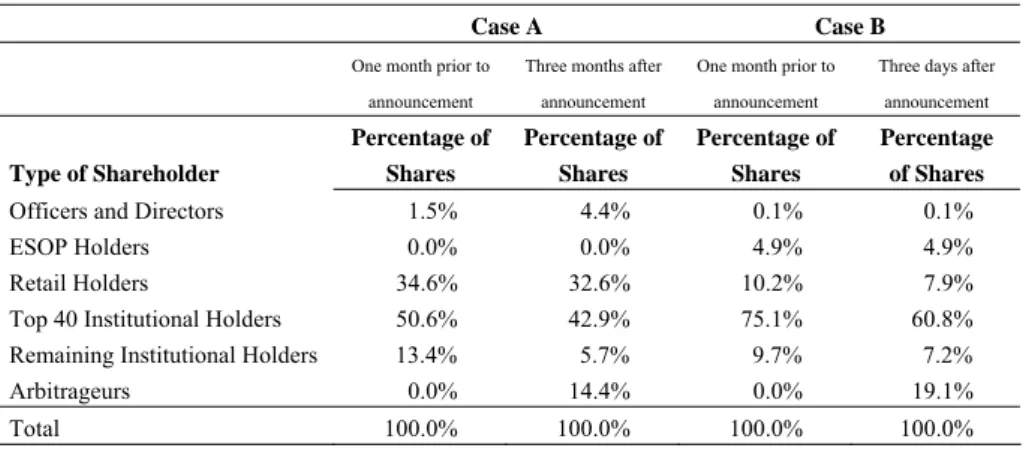
In many cases, the aggregate holdings by the arbitrage community can become a significant percentage of the target company’s outstanding shares. In Table 1 we provide private data from a leading proxy solicitation firm on two transactions that shows how the ownership of the target company’s security undergoes significant changes in ownership once a transaction is announced. Neither one of these transactions was announced during the period covered by our study but they are typical of transactions in that they demonstrate the effect of arbitrage on the ownership profile of target securities.
In Case A, we examine a target company that was subject to a bear-hug proposal from the acquiring company. The acquiring company initiated a proxy fight along with its bear hug in order to exert maximum pressure on the target to negotiate a merger agreement. The arbitrage community became active in the target company’s security once the bear hug was made public. The change in shareholder ownership is shown in Case A of Table 1. Over a 3-month period arbitrageurs established a position representing 14.4% of the target company’s shares. Most of this position was established by purchasing shares from institutional shareholders in the marketplace.
Table 1. Changes of Ownership of Target Company’s Common Stock
Case A Case B
One month prior to announcement
Three months after announcement
One month prior to announcement
Three days after announcement Type of Shareholder Percentage of Shares Percentage of Shares Percentage of Shares Percentage of Shares
Officers and Directors 1.5% 4.4% 0.1% 0.1% ESOP Holders 0.0% 0.0% 4.9% 4.9% Retail Holders 34.6% 32.6% 10.2% 7.9% Top 40 Institutional Holders 50.6% 42.9% 75.1% 60.8% Remaining Institutional Holders 13.4% 5.7% 9.7% 7.2% Arbitrageurs 0.0% 14.4% 0.0% 19.1%
Total 100.0% 100.0% 100.0% 100.0%
In the second case the target company was subject to a hostile tender offer that eventually turned into a friendly merger transaction. Case B in Table 1 shows the change in ownership over a one-month-and-3-day period. By only 3 days after the announcement, individual and institutional holders sold enough shares for the arbitrage community to establish a 19.1% ownership position. Again, institutional shareholders did most of the selling. Subsequently the arbitrage position continued to grow. In fact, by the time the merger was consummated, arbitrageurs owned over 50% of the outstanding common shares. In each case arbitrager ownership became material soon after the M&A announcement.
C. Deal Cancellation and Stock Ownership
After a cancellation is made public, most arbitrageurs liquidate their positions into the marketplace. Arbitrageurs are not long-term investors—their purpose is simply to profit from the spread in pending acquisition offers. Most arbitrageurs operate under policies and guidelines within their firms that require them to unwind positions in cancelled deals quickly in the marketplace. Since arbitrageurs are free to liquidate their positions in the target company at any time, some may choose to sell-off their positions prior to the consummation or cancellation of the transaction. This unwinding activity would most likely have a minimal effect on our study’s results for two reasons. First, other arbitrageurs are the most likely buyers of shares sold by arbitrageurs liquidating their positions prior to a deal’s cancellation. Second, the main focus of this study is to examine the abnormal returns of cancelled targets after the termination of an M&A rather than before the termination.
When transactions are terminated, most of these announcements come as a surprise to the marketplace. For instance, on March 30, 2001, it was announced that Tyson Foods had cancelled its plans to acquire Iowa Beef Processors. The share of Iowa Beef declined 33% from $22.79 to $15 while the shares of Tyson Foods rose sharply. The general surprise of cancellation announcements combined with the fact that securities usually need to be traded immediately after the announcement leads to rapid investment decision-making and leaves very little time for investors to return to fundamental analysis to establish trading levels for target company shares. It is at this point in time that we see a reversal of the process in which the significant arbitrage holdings revert to the traditional ownership distribution.
D. The Impact of Arbitrage Activities on Target Stock Returns after Cancellations
From the data in Table 1 we see that these arbitrage positions can be quite large. Had either of these two transactions been cancelled, the holdings by arbitrageurs would have come into the market and would have been “redistributed” to both institutional and retail stockholders. In Case B, where arbitrageurs ultimately owned over 50% of the outstanding shares, it could be argued that the rapid liquidation of arbitrager holdings would have had an effect on the pricing of the target company’s shares, consistent with the belief of many portfolio managers. On the other hand, efficient market advocates would argue that even if these substantial holdings are sold over a short period of time, the target company’s shares will be efficiently priced in the marketplace and investors should not be able to earn abnormal profits as the arbitrage community unwinds its positions and ownership of the target’s securities returns to normal distribution levels.
E. The Issues
The first central research question, thus, is: does the strategy of investing in cancelled targets after the termination of M&As provide profits? Logical extensions include: are abnormal returns of cancellations different for different type of M&As, for different terminating parties, or for different terminating reasons? We examine
three types of cancellations: tender offers, mergers, and bear-hugs. We also examine abnormal returns of cancellation initiated by the acquiring company, by the target company, and by mutual termination. Finally, we examine seven categories of cancellation reasons: target resistance, target fundamentals or financing, no agreement on terms, due diligence, regulatory or legal issues, acquiring company stock price or fundamentals, and for no stated reasons.
The strategy of investing in cancelled targets is based on the belief of portfolio managers that an oversupply of target stocks is created by risk arbitrageurs selling their positions. This leads to the second central issue: are abnormal returns after cancellation announcements related to the level of arbitrage activities?
3. The Sample
To obtain our sample we use data from a number of different sources. As a starting point we use the Mergerstat database of William Grimm & Company. This service gives a listing of all cancelled or terminated mergers, tender offers, and acquisition offers on the New York Stock Exchange, American Stock Exchange, and the NASDAQ market. Our data covers the seven-year period from March 30, 1992, to April 21, 1999. We exclude any deal that indicates a total market value for the target company of less than $100 million. We employ this screen because we focus on the effect of arbitrage on returns of securities involved in cancelled transactions. Arbitrageurs concentrate their investments on liquid announced transactions. Most arbitrageurs use $100 million as the minimum cut-off for transactions.
Our initial data set includes 318 potential transactions. Many of these deals are eliminated from the sample for a number of reasons. We only include target companies that receive a bid for the entire company (not just for a unit). We exclude target companies that are not traded in US securities markets. Finally, we exclude observations where the bidding companies dropped or terminated their bids because of either a higher bid or a management-supported competing bid. In this case, while the original bidder has terminated, the target company is still being acquired. Therefore, the target company will not experience the same type of liquidating trading activity from arbitrageurs compared to non-competing bid situations. Other researchers such as Bradley (1980), Asquith (1982), and Davidson et al. (2002) have not made this distinction, and we may obtain different results as a result.
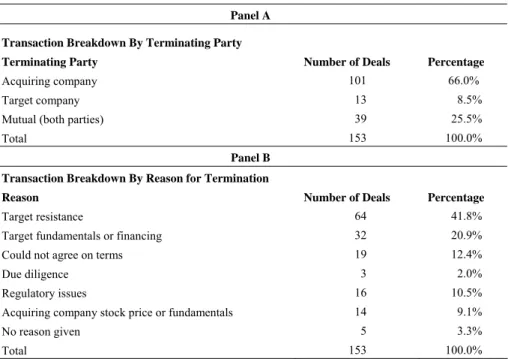
Our final sample consists of 153 firms. Of the 153 transactions in the sample, eighty transactions (52.3%) were mergers, thirty-eight transactions (24.8%) were tender offers, and thirty-five transactions (22.9%) were bear-hug proposals. In order to determine which party terminated the transactions as well as the specific reasons for termination, we use the original articles from the Wall Street Journal. Table 2 shows the breakdown of all the transactions by terminating party and by reason for termination.
We find that the acquiring companies terminated 66% of the 153 transactions in our sample, while the target companies terminated 8.5% of the transactions. The rest of the transactions were mutually cancelled. Subsequently, we examine whether
abnormal returns differ depending upon which party actually terminates the transaction.
Table 2. Sample Breakdown by Terminating Party and Reasons
Panel A
Transaction Breakdown By Terminating Party
Terminating Party Number of Deals Percentage
Acquiring company 101 66.0%
Target company 13 8.5%
Mutual (both parties) 39 25.5%
Total 153 100.0%
Panel B Transaction Breakdown By Reason for Termination
Reason Number of Deals Percentage
Target resistance 64 41.8%
Target fundamentals or financing 32 20.9% Could not agree on terms 19 12.4%
Due diligence 3 2.0%
Regulatory issues 16 10.5% Acquiring company stock price or fundamentals 14 9.1%
No reason given 5 3.3%
Total 153 100.0%
Over 40% of the transactions in the study were terminated due to target company resistance to the bid. The next most frequent reason for termination is deteriorating target company fundamentals or difficulty in completing financing of the transactions.
4. Methodology A. Abnormal Returns
We utilize The Center for Research in Securities Prices (CRSP) database to compute all returns. We use the standard event study methodology as detailed by Brown and Warner (1980, 1985) to make our return calculations. We assume that security returns follow a single factor model:
jt mt j j it R e R =αˆ +βˆ + , (1)
where Rjt is the rate of return on the target stock of the th
j firm on day t, Rmt is
the return on the CRSP equally weighted index on day t, and e is the random jt
error term. The error term has an expected value of zero and is assumed to be uncorrelated with the market return. β measures the sensitivity of j R to the jt
market index. The coefficients of α and j βj are the least square estimates of α j and β . These coefficients are estimated from a 255-day period that ends 30 days j prior to the initial announcement of the proposed merger, tender, or bear hug. We eliminate the 30-day period from our model to avoid bias in our estimates that could be created by rumors and insider trading prior to the offer.
Abnormal returns are calculated as follows:
(
j j mt)
jt
it R R
A = −αˆ +βˆ , (2)
where Ajt is the abnormal return for target stock of the jth firm on day t.
We also use the standardized method of abnormal returns as detailed by Patell (1976) in our calculations. The standardized abnormal return is calculated as follows:
(
jt Ajt)
jt A S
SAR = , (3)
where S equals the maximum likelihood estimate of the standard deviation. This Ajt
method estimates a separate standard error for each firm-event and assumes cross-sectional independence of these events.
Our calculations of abnormal returns require us to determine the relevant periods to measure returns. We use an initial 5-day return window as well as windows for the first month through the first 12 months of trading after the deal cancellation.
It should be noted that when takeover transactions are announced, the risk-return relationship of the target company changes and the target company’s sensitivity to overall market moves is also altered. In cash transactions, after M&A announcements, the target company’s stock generally closely tracks the offer price regardless of overall equity market moves. In transactions involving the issuance of shares of the acquiring company, moves in the target company’s stock are closely related to the acquiring company’s shares (adjusted for the exchange ratio) as opposed to overall equity market movements. However, the main focus of this study is the target returns after the cancellation announcement. We believe that the risk-return relationship of the target before the initial announcement is similar to that of the target after the announcement. By using pre-announcement stock prices to estimate the model parameters, we have minimized these potential biases.
B. Level of Arbitrage Activity
In order to determine if arbitrage activity is directly related to abnormal returns we examine the level of arbitrage activity using three separate measures of arbitrage activity. In an ideal world we would directly observe the level of arbitrage activity for each deal. Since this information is proprietary, we have not been able to obtain the direct data. Consequently, we use reasonable proxies. Specifically, we use the following regression: e Arb b b CAR= 0+ 1 + , (4)
where CAR is cumulative abnormal returns and Arb represents various measures
of arbitrage activities.
The first measure we use is the cumulative volume of trading in the target company’s stock from the initial announcement date to the termination date as a percentage of the total number of shares outstanding. As long-term investors sell their holdings after the deal announcement, we assume that the arbitrage community purchases these shares and arbitrageurs sell the shares after the termination date. Using this method it is possible that, prior to a deal cancellation, a sale from one arbitrageur to another may result in overestimating the arbitrage community’s collective position. However, there is currently no method to identify trades done by arbitrageurs. We assume that this type of activity will have a minimal effect on our results. Our first measure is then:
(
ShsTraded) (
OutShs)
ArbAct1= , (5)
where ShsTraded is the number of shares traded in the target company from the initial announcement date to the termination date and OutShs is the number of outstanding shares of the target company. In deals where the target company was listed on NASDAQ, we used a volume correction factor of 0.65 to account for a high level of dealer-to-dealer trades. This correction factor has been previously utilized by other researchers.
We use the amount of trading in excess of average trading volume before the deal as our second measure of arbitrage activity. Here we are assuming that the amount of trading in excess of average trading volume before the deal can be attributed to the arbitrage community. More formally our second measure is:
(
ShsTraded N AvgPreDealVol) (
OutShs)
ArbAct2=
∑
− ( ) , (6)where
∑
ShsTraded is the number of shares traded in the target company from theinitial announcement date to the termination date, N is the number of trading days between the announcement date and the termination date, AvgPreDealVol is the
average volume for the 60-day trading period ending 10 trading days prior to the initial announcement, and OutShs is the number of outstanding shares in the target company.
We utilize the average trading volume for the 60-day trading period ending 10 trading days prior to the initial announcement as a measure of normal trading. We end the measurement period 10 days prior to the initial announcement to avoid bias that could be caused by the existence of insider trading and rumors.
Our final measure of arbitrage activity involves using a market model to calculate cumulative abnormal volume in the target company’s securities. First, we estimate how volume in the individual security relates to the overall volume of trading in all securities on the New York, American, and NASDAQ stock exchanges. Consistent with abnormal return estimation, we use a 255-day estimation period ending 30 trading days before the initial announcement date:
(
t)
t i t i t i a b TotMktVol Vol ng IndivTradi , = , + , , (7)where IndivTradingVol is the actual trading volume for the target company, i t, ai,t is the intercept from the market model for firm i in period t, bi,t is the coefficient of market volume for firm i in period t, and TotMktVol is the total daily market t volume.
We obtain total market volume by summing the volume of all securities listed on the New York Stock Exchange, American Stock Exchange, and NASDAQ. This data is obtained from CRSP tapes. We then use these coefficients to calculate expected volume in the security in question during the period from the initial announcement of the transaction until termination. The difference between the estimates and the actual volume becomes the abnormal volume that is assumed to be attributable to the trading by arbitrageurs. Our third measure is then:
(
ShsTraded EstTradingVol) (
OutShs)
ArbAct3=
∑
−∑
, (8)where
∑
ShsTraded is the number of shares traded in the target company from theinitial announcement date to the termination date,
∑
EstTradingVol is theestimated trading volume calculated for each day from equation (7) and summed from initial announcement to termination date, and OutShs is the number of outstanding shares in the target company.
5. Results
A. Results for the Whole Sample
The central issue is whether equity portfolio managers can profit by investing in the stocks of target companies after deals are cancelled. First, we examine the abnormal returns from the entire sample of transactions. These are presented in Table 3. While the CARs for the first 3 months are slightly positive, they are not statistically significant. During the next 3 months the CARs are slightly negative but statistically insignificant. Over the one-year post-announcement period, CARs are not significantly different from zero. The results do not support the popular wisdom that the unwinding of arbitrage positions creates an opportunity for portfolio managers to profit from purchasing target company shares after deals are terminated. It should be noted that we also performed the same analyses using a market model based on value-weighted returns and found that abnormal returns were not also significantly different from zero.
B. Results by Type of Deal
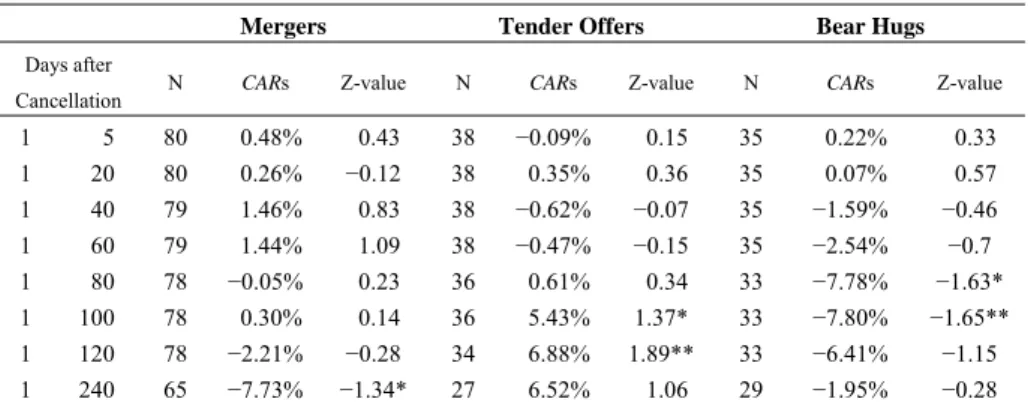
The results of abnormal returns by deal type are shown in Table 4. Target firms in terminated mergers have an average CAR of −7.73% (t = −1.34) about one year after termination. This is significantly different from zero at the 10% level. In contrast, targets of cancelled tender offers have an average CAR of 6.52% after
about one year; this is not statistically significant. There is some indication of significant returns about 5 months after cancellation.
Table 3. Cumulative Abnormal Returns—All Deals
Days After Cancellation N CARs Z-value
1 5 153 0.281% 0.545 1 20 153 0.240% 0.366 1 40 152 0.239% 0.343 1 60 152 0.045% 0.373 1 80 147 −1.625% −0.438 1 100 147 −0.578% −0.001 1 120 143 −1.017% −0.169 1 240 121 −3.163% −0.613
Notes: Cumulative abnormal returns of target companies are for all transactions from 1992 to 1999 using the market model. These returns are calculated using the standardized market model method and the equally weighted CRSP index. The sample size is indicated by N.
Table 4. Cumulative Abnormal Returns by Type of Deal
Mergers Tender Offers Bear Hugs
Days after
Cancellation N CARs Z-value N CARs Z-value N CARs Z-value
1 5 80 0.48% 0.43 38 −0.09% 0.15 35 0.22% 0.33 1 20 80 0.26% −0.12 38 0.35% 0.36 35 0.07% 0.57 1 40 79 1.46% 0.83 38 −0.62% −0.07 35 −1.59% −0.46 1 60 79 1.44% 1.09 38 −0.47% −0.15 35 −2.54% −0.7 1 80 78 −0.05% 0.23 36 0.61% 0.34 33 −7.78% −1.63* 1 100 78 0.30% 0.14 36 5.43% 1.37* 33 −7.80% −1.65** 1 120 78 −2.21% −0.28 34 6.88% 1.89** 33 −6.41% −1.15 1 240 65 −7.73% −1.34* 27 6.52% 1.06 29 −1.95% −0.28 Notes: Cumulative abnormal returns of target companies are for all transactions from 1992 to 1999 using the market model as disclosed. These returns are calculated using the standardized market model method and the equally weighted CRSP index. * and ** denote significance levels (one-tail tests) of 10% and 5%, respectively. The sample size is indicated by N.
The results for bear hugs show a monotonically decreasing pattern in CARs over the first 5 months after cancellation. The CARs reach about −7.8% after 4 and 5 months after termination. There is some performance improvement over subsequent months, but the CAR after 240 days is negative.
C. Results by Terminating Party
Next we examine is whether equity portfolio managers can profit based on which party cancels the transaction. These results are presented in Table 5.
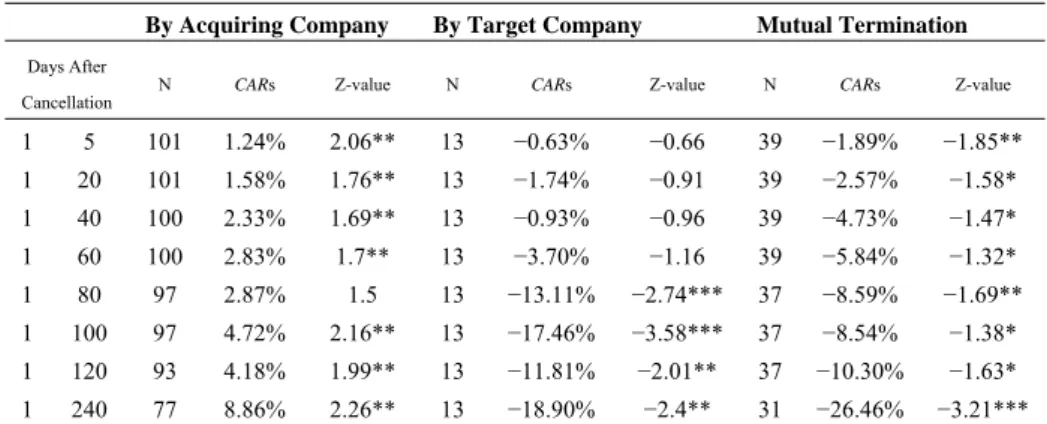
In cases where the acquiring company initiates the cancellation, we find that after termination the CAR grows throughout the next year. After 6 months (1 year) returns are 4.18% (8.86%) and are significant at the 5% level. These findings are similar to those of Dodd (1980) that showed, for mergers, positive abnormal returns in the 20- and 40-day periods after termination. Davidson (1989) also found that the targets were permanently revalued after mergers were terminated and the target companies showed positive abnormal returns.
We have only 13 targets that terminated acquisitions. Subsequent to termination, mean CAR for this group becomes significantly negative. By the fourth month there is a −13.11% CAR. This finding is larger but similar to that of Asquith (1982) who found target abnormal returns of approximately −4.7% six months after cancellation. After about one year there is an average CAR of −18.9% for this group, which is significant at the 5% level. When the target company cancels a merger or acquisition, the abnormal returns are negative and do not represent profitable opportunities for equity portfolio manager to outperform the market. Of course, it might be possible for the portfolio managers to sell short the target company and make abnormal profits over time.
Table 5. Cumulative Abnormal Returns by Terminating Party
By Acquiring Company By Target Company Mutual Termination
Days After
Cancellation N CARs Z-value N CARs Z-value N CARs Z-value
1 5 101 1.24% 2.06** 13 −0.63% −0.66 39 −1.89% −1.85** 1 20 101 1.58% 1.76** 13 −1.74% −0.91 39 −2.57% −1.58* 1 40 100 2.33% 1.69** 13 −0.93% −0.96 39 −4.73% −1.47* 1 60 100 2.83% 1.7** 13 −3.70% −1.16 39 −5.84% −1.32* 1 80 97 2.87% 1.5 13 −13.11% −2.74*** 37 −8.59% −1.69** 1 100 97 4.72% 2.16** 13 −17.46% −3.58*** 37 −8.54% −1.38* 1 120 93 4.18% 1.99** 13 −11.81% −2.01** 37 −10.30% −1.63* 1 240 77 8.86% 2.26** 13 −18.90% −2.4** 31 −26.46% −3.21*** Notes: Cumulative abnormal returns of target companies are for all transactions from 1992 to 1999 using the market model as disclosed. These returns are calculated using the standardized market model method and the equally weighted CRSP index. *, **, and *** denotes significance levels (one-tail tests) of 10%, 5%, and 1%, respectively. The sample size is indicated by N.
When both companies mutually cancel the agreement, the CARs become increasingly negative over time. We find a −26.4% CAR about one year after mutually cancelled transactions. This result is significant at the 1% level. This may be a result of the market growing increasingly less optimistic about the cancelled transaction being restructured or a combination being rekindled with another entity. In sum, however, only terminations by acquiring companies represent profitable purchase opportunities for portfolio managers.
D. Results by Reason for Termination
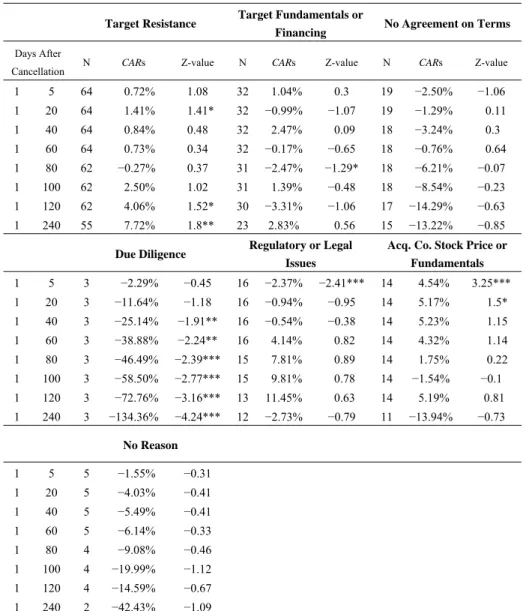
Next we consider whether the reason given for the transaction’s termination is related to abnormal returns. In most cases, upon termination of the transaction, the press releases disclose why the transaction was cancelled. In Table 6 we present the abnormal returns based on the different reasons for cancellation.
When the target company resists the acquisition (our largest group in Table 6 with 64 observations), we find positive CARs. The CAR about one year after cancellation is 7.72% and is significant at the 5% level. Equity portfolio managers may want to concentrate on deals that are cancelled due to target company resistance. In contrast, one of the worst cases of long-term performance after termination is observed when the parties could not agree on the terms. While the one-year CAR is −13.22%, it is not statistically significant.
We have 16 observations of the transaction being cancelled due to regulatory issues. After the first 5 days of trading after the transaction is cancelled, returns are negative (−2.37%). After this 5-day period, the CARs become positive. The returns reach 11.45% after 6 months of trading, but decrease thereafter. Portfolio managers may find it profitable to invest in these target company’s stocks. However, other than the 5-day returns, none of the subsequent CARs are statistically significant.
In instances where the target company fundamentals or financing caused the transactions to fail, we find that the target company stocks are generally efficiently priced after the reason is disclosed. As a result, these cases do not present profitable opportunities for equity portfolio managers.
In cases where transactions are cancelled as a result of due diligence or had no stated reason for cancellation, we have very small sample sizes making it difficult to perform meaningful statistical tests.
The overall CARs results by cancellation reason are mixed. The only possible profitable strategy is to invest in targets when the cancellation reason is target resistance.
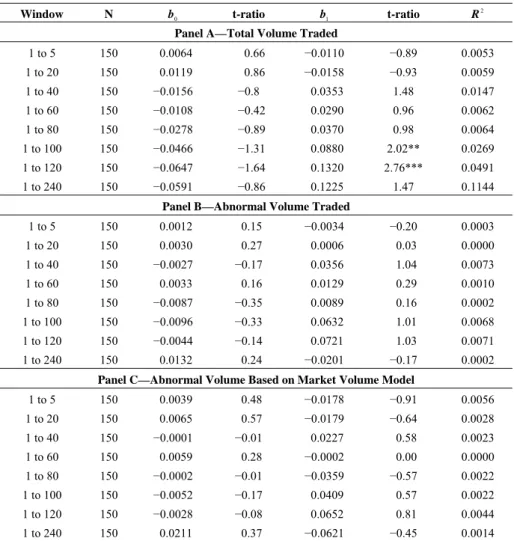
E. Results Based on the Level of Arbitrage Activity
If arbitrage activity has an effect on CARs after merger cancellation, we would expect to find a negative relationship immediately subsequent to termination and a positive relationship following that. This pattern would occur if arbitrage-related selling pressure were to cause the stocks of the target companies to drop to levels that create opportunities for abnormal returns. We find no evidence of this in Table 7, irrespective of the measure of arbitrage activity utilized.
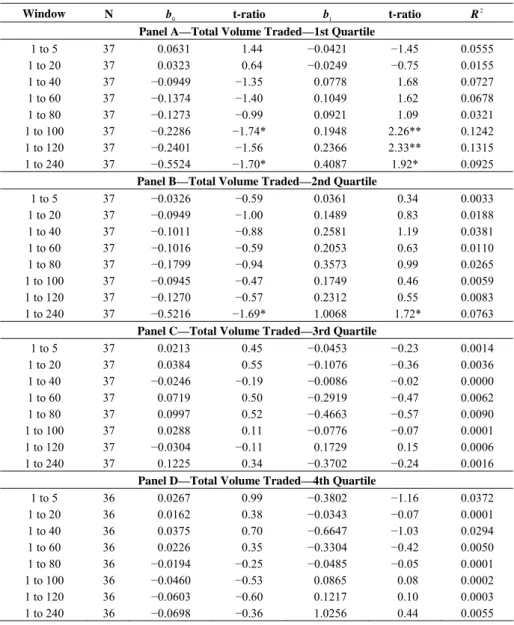
Next we considered trading volume by quartiles. These results are presented in Table 8 and, again, provide little evidence supporting the notion that selling pressure caused by cancellation of an acquisition provides for a profitable opportunity.
Table 6. Cumulative Abnormal Returns by Reason
Target Resistance Target Fundamentals or
Financing No Agreement on Terms
Days After
Cancellation N CARs Z-value N CARs Z-value N CARs Z-value
1 5 64 0.72% 1.08 32 1.04% 0.3 19 −2.50% −1.06 1 20 64 1.41% 1.41* 32 −0.99% −1.07 19 −1.29% 0.11 1 40 64 0.84% 0.48 32 2.47% 0.09 18 −3.24% 0.3 1 60 64 0.73% 0.34 32 −0.17% −0.65 18 −0.76% 0.64 1 80 62 −0.27% 0.37 31 −2.47% −1.29* 18 −6.21% −0.07 1 100 62 2.50% 1.02 31 1.39% −0.48 18 −8.54% −0.23 1 120 62 4.06% 1.52* 30 −3.31% −1.06 17 −14.29% −0.63 1 240 55 7.72% 1.8** 23 2.83% 0.56 15 −13.22% −0.85
Due Diligence Regulatory or Legal Issues
Acq. Co. Stock Price or Fundamentals 1 5 3 −2.29% −0.45 16 −2.37% −2.41*** 14 4.54% 3.25*** 1 20 3 −11.64% −1.18 16 −0.94% −0.95 14 5.17% 1.5* 1 40 3 −25.14% −1.91** 16 −0.54% −0.38 14 5.23% 1.15 1 60 3 −38.88% −2.24** 16 4.14% 0.82 14 4.32% 1.14 1 80 3 −46.49% −2.39*** 15 7.81% 0.89 14 1.75% 0.22 1 100 3 −58.50% −2.77*** 15 9.81% 0.78 14 −1.54% −0.1 1 120 3 −72.76% −3.16*** 13 11.45% 0.63 14 5.19% 0.81 1 240 3 −134.36% −4.24*** 12 −2.73% −0.79 11 −13.94% −0.73 No Reason 1 5 5 −1.55% −0.31 1 20 5 −4.03% −0.41 1 40 5 −5.49% −0.41 1 60 5 −6.14% −0.33 1 80 4 −9.08% −0.46 1 100 4 −19.99% −1.12 1 120 4 −14.59% −0.67 1 240 2 −42.43% −1.09
Notes: Cumulative abnormal returns of target companies are for all transactions from 1992 to 1999 using the market model as disclosed. These returns are calculated using the standardized market model method and the equally weighted CRSP index. *, **, and *** denotes significance levels (one-tail tests) of 10%, 5%, and 1%, respectively. The sample size is indicated by N.
Table 7. Regression of CARs on Different Measures of Arbitrage Activity—Equally Weighted
Window N b0 t-ratio b1 t-ratio
2 R
Panel A—Total Volume Traded
1 to 5 150 0.0064 0.66 −0.0110 −0.89 0.0053 1 to 20 150 0.0119 0.86 −0.0158 −0.93 0.0059 1 to 40 150 −0.0156 −0.8 0.0353 1.48 0.0147 1 to 60 150 −0.0108 −0.42 0.0290 0.96 0.0062 1 to 80 150 −0.0278 −0.89 0.0370 0.98 0.0064 1 to 100 150 −0.0466 −1.31 0.0880 2.02** 0.0269 1 to 120 150 −0.0647 −1.64 0.1320 2.76*** 0.0491 1 to 240 150 −0.0591 −0.86 0.1225 1.47 0.1144
Panel B—Abnormal Volume Traded
1 to 5 150 0.0012 0.15 −0.0034 −0.20 0.0003 1 to 20 150 0.0030 0.27 0.0006 0.03 0.0000 1 to 40 150 −0.0027 −0.17 0.0356 1.04 0.0073 1 to 60 150 0.0033 0.16 0.0129 0.29 0.0010 1 to 80 150 −0.0087 −0.35 0.0089 0.16 0.0002 1 to 100 150 −0.0096 −0.33 0.0632 1.01 0.0068 1 to 120 150 −0.0044 −0.14 0.0721 1.03 0.0071 1 to 240 150 0.0132 0.24 −0.0201 −0.17 0.0002
Panel C—Abnormal Volume Based on Market Volume Model
1 to 5 150 0.0039 0.48 −0.0178 −0.91 0.0056 1 to 20 150 0.0065 0.57 −0.0179 −0.64 0.0028 1 to 40 150 −0.0001 −0.01 0.0227 0.58 0.0023 1 to 60 150 0.0059 0.28 −0.0002 0.00 0.0000 1 to 80 150 −0.0002 −0.01 −0.0359 −0.57 0.0022 1 to 100 150 −0.0052 −0.17 0.0409 0.57 0.0022 1 to 120 150 −0.0028 −0.08 0.0652 0.81 0.0044 1 to 240 150 0.0211 0.37 −0.0621 −0.45 0.0014 Notes: Regression results are for regressing CARs on three measures of arbitrage activity. In Panel A we regress CARs on the total volume traded as a percentage of the target company’s outstanding shares. Total percentage volume traded is calculated by taking the total volume between the announcement date and the termination date as a percentage of the outstanding shares. In Panel B we regress CARs on the abnormal percentage volume traded as a percentage of the target company’s outstanding shares. Abnormal volume traded is the difference between total volume traded between the announcement date and the termination date and the expected average trading volume based on the average trading volume for each security prior to the deal’s announcement. The difference is then taken as a percentage of outstanding target company shares. Panel C shows the results of regressing abnormal returns on cumulative abnormal volume traded as a percentage of the target company’s outstanding shares. Cumulative abnormal volume is the difference between the total volume traded in the target company during the transaction less the sum of the expected daily trading volume based on the market volume model. *, **, and *** denotes significance levels (two-tail tests) of 10%, 5%, and 1%, respectively. The sample size is indicated by N.
Table 8. Regression of CARs on Total Volume Traded by Quartile
Window N b0 t-ratio b1 t-ratio
2 R
Panel A—Total Volume Traded—1st Quartile
1 to 5 37 0.0631 1.44 −0.0421 −1.45 0.0555 1 to 20 37 0.0323 0.64 −0.0249 −0.75 0.0155 1 to 40 37 −0.0949 −1.35 0.0778 1.68 0.0727 1 to 60 37 −0.1374 −1.40 0.1049 1.62 0.0678 1 to 80 37 −0.1273 −0.99 0.0921 1.09 0.0321 1 to 100 37 −0.2286 −1.74* 0.1948 2.26** 0.1242 1 to 120 37 −0.2401 −1.56 0.2366 2.33** 0.1315 1 to 240 37 −0.5524 −1.70* 0.4087 1.92* 0.0925
Panel B—Total Volume Traded—2nd Quartile
1 to 5 37 −0.0326 −0.59 0.0361 0.34 0.0033 1 to 20 37 −0.0949 −1.00 0.1489 0.83 0.0188 1 to 40 37 −0.1011 −0.88 0.2581 1.19 0.0381 1 to 60 37 −0.1016 −0.59 0.2053 0.63 0.0110 1 to 80 37 −0.1799 −0.94 0.3573 0.99 0.0265 1 to 100 37 −0.0945 −0.47 0.1749 0.46 0.0059 1 to 120 37 −0.1270 −0.57 0.2312 0.55 0.0083 1 to 240 37 −0.5216 −1.69* 1.0068 1.72* 0.0763
Panel C—Total Volume Traded—3rd Quartile
1 to 5 37 0.0213 0.45 −0.0453 −0.23 0.0014 1 to 20 37 0.0384 0.55 −0.1076 −0.36 0.0036 1 to 40 37 −0.0246 −0.19 −0.0086 −0.02 0.0000 1 to 60 37 0.0719 0.50 −0.2919 −0.47 0.0062 1 to 80 37 0.0997 0.52 −0.4663 −0.57 0.0090 1 to 100 37 0.0288 0.11 −0.0776 −0.07 0.0001 1 to 120 37 −0.0304 −0.11 0.1729 0.15 0.0006 1 to 240 37 0.1225 0.34 −0.3702 −0.24 0.0016
Panel D—Total Volume Traded—4th Quartile
1 to 5 36 0.0267 0.99 −0.3802 −1.16 0.0372 1 to 20 36 0.0162 0.38 −0.0343 −0.07 0.0001 1 to 40 36 0.0375 0.70 −0.6647 −1.03 0.0294 1 to 60 36 0.0226 0.35 −0.3304 −0.42 0.0050 1 to 80 36 −0.0194 −0.25 −0.0485 −0.05 0.0001 1 to 100 36 −0.0460 −0.53 0.0865 0.08 0.0002 1 to 120 36 −0.0603 −0.60 0.1217 0.10 0.0003 1 to 240 36 −0.0698 −0.36 1.0256 0.44 0.0055 Notes: Regression results are for regressing cumulative abnormal returns on one measure of arbitrage activity. We regress CARs on the total volume traded as a percentage of the target company’s outstanding shares. Total percentage volume traded is calculated by taking the total volume between the announcement date and the termination date as a percentage of the outstanding shares. Panel A has the results of the first quartile by total volume traded. Panel B has the results for the second quartile. Panels C and D show the results from the third and fourth quartiles. *, **, and *** denotes significance levels (two-tail tests) of 10%, 5%, and 1%, respectively. The sample size is indicated by N.
F. Discussion of Overall Results
Many portfolio managers on Wall Street believe investing in the stock of the target company following the cancellation of a merger or acquisition can generate positive abnormal returns. The reason offered by portfolio managers is that arbitrageurs usually unwind their position after the termination announcements and create a temporally depressed stock price. The portfolio managers try to exploit an oversupply of the target company stock that is created by sales of arbitrageurs.
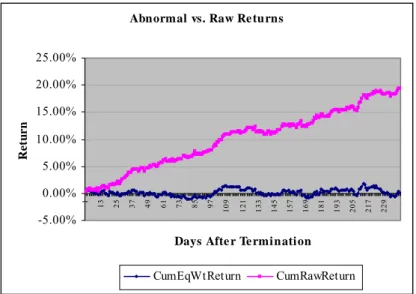
We find evidence that the capital market has generally efficiently priced target company securities after M&A transactions are terminated. This finding is at odds with a common Wall Street belief that security prices of target companies are artificially depressed during arbitrage liquidations. We are curious why portfolio mangers believe the strategy of investing cancellation deals work. Perhaps an explanation can be found in Figure 1 where we plot equally weighted CARs as well as raw returns unadjusted for market returns.
Figure 1. Equally Weighted Cumulative Abnormal and Cumulative Raw Returns
Figure 1 shows that raw returns grow positive after transactions are terminated. In fact, in our sample the raw returns reach over 10% after 6 months of trading and 20% after 1 year. These positive raw returns are apparently a result of overall equity market moves and not a result of liquidation pressures.
6. Summary
This paper focuses on some portfolio mangers belief that investing in target companies after cancelled transactions is a good investment strategy. The rationale offered by portfolio managers is that arbitrageurs usually unwind their position after
Abnormal vs. Raw Re turns
-5.00% 0.00% 5.00% 10.00% 15.00% 20.00% 25.00% 1 13 25 37 49 61 73 85 97 109 121 133 145 157 169 181 193 205 217 229
Days Afte r Te rmination
Ret
u
rn
the termination announcements and create a temporally depressed stock price. We provide some anecdotal evidence that risk arbitrageurs unwind their position after cancellation announcements. The empirical evidence, however, suggests investing in all target company stocks after M&As are terminated does not appear to be a consistent profitable strategy for equity portfolio managers.
Our findings suggest that portfolio managers may be able to generate positive abnormal returns by investing in target companies where the cancelled transactions are tender offers or initiated by the acquiring companies. Moreover, in cases where the target company resists the M&A, the portfolio manager may be able to realize positive abnormal returns by investing in the target company after the transaction is cancelled. We find little evidence that returns after cancellation are related to any of our proxies for prior level of arbitrageur holdings. In sum, the folklore of “The Street” has relatively little empirical support.
References
Asquith, P., (1983), “Merger Bids, Uncertainty, and Stockholder Returns,” Journal
of Financial Economics, 11, 51-83.
Bradley, M., (1980), “Interfirm Tender Offers and the Market for Corporate Control,” Journal of Business, 53, 345-376.
Brown, S. J. and J. B. Warner, (1980), “Measuring Security Price Performance,”
Journal of Financial Economics, 8, 205-258.
Brown, S. J. and J. B. Warner, (1985), “Using Daily Stock Returns: The Case of Event Studies,” Journal of Financial Economics, 14, 3-32.
Burnett, T., (2004), “Still Sexy—Broken Merger Deals Make Some Companies More Attractive,” Barron’s, May 31, 2004.
Chang, S. and D. Suk, (1998), “Failed Takeovers Methods of Payment and Bidder Returns,” The Financial Review, 33, 19-32.
Davidson, W., D. Dutia and L. Cheng, (1989), “A Re-Examination of the Market Reactions to Failed Mergers,” Journal of Finance, 44(4), 1077-1083.
Davidson, W. N., S. Rosentein and S. Sundaram, (2002), “An Empirical Analysis of Cancelled Mergers, Board Composition and Ownership Structure,” Applied
Financial Economics, 12, 485-491.
Dodd, P., (1980), “Merger Proposals, Management Discretion and Shareholder Wealth,” Journal of Financial Economics, 8, 105-137.
Dodd, P. and R. Ruback, (1977), “Tender Offers and Stockholder Returns: An Empirical Analysis,” Journal of Financial Economics, 5, 351-374.
Moore, K. M., (1999), Risk Arbitrage: An Investors Guide, New York: John Wiley and Sons.
Moore, K. M., G. C. Lai and H. R. Oppenheimer, (2006), “The Behavior of Risk Arbitrageurs in Mergers and Acquisitions,” The Journal of Alternative
Investments, 9(1), 19-27.
Patell, J., (1976), “Corporate Forecasts of Earnings per Share and Stock Price Behavior: Empirical Tests,” Journal of Accounting Research, 14, 246-276.