0 1998 Elsevier Science Ltd All rights reserved. Printed in Great Britain
PII:
800456535(98)001349
@M-6535/98 $19.00+0.00The Influence of Relative Humidity on the Adsorption
of Toluene by Soils
- Interpretation with the Adsorption Energy Distribution Functions.
Chih-yu Chen*, Shian-thee Wu* *
*Department of Environmental Engineering, Foo Yin Institute of Technology, Taliao, Kaohsiung Hsien, Taiwan, R.O.C.
** Graduate Institute of Environmental Engineering, National Taiwan University, No, 71 Chou-shan Rd., Taipei, 10770, Taiwan, R.O.C.
(Received in Germany 29 October 1997; accepted 23 March 1998) Abstract
It has been shown that the VOC adsorption capacity of soil decreases significantly with increasing relative humidity levels in the vapor phase. It might be due to the competition of adsorption sites by water molecules on the soil surfaces. Generally, the surface of nature adsorbents, such as soil and clay mineral, is highly heterogeneous owing to their complex chemical composition and irregularities of physical structure. It is necessary to describe the adsorption phenomena of nature adsorbent microscopically. Based on gas-solid adsorption isotherm, the energy distribution function of sorbing sites OII soil surface were constructed. The variation of adsorption energy distribution function reveals that the adsorption energy for water was higher than that for toluene and, therefore, the soil surface would prefer to adsorb water vapor rather than toluene vapor. In addition, the adsorption energy of water vapor shifts towards the lower side at higher relative humidity level. It appears that the water vapor is condensed onto the surface. It is found that the previously adsorbed water molecules modified the soil surface and changed the energy spectrum of the adsorption sites. The shift of the adsorption energy spectrum to lower adsorption energy is the reason of the suppression of the soil uptake of organic vapors by water vapor. 01998 Elsevier Science Ltd. All rights reserved
Introduction
Adsorption is one of the most important processes affecting the fate of volatile organic compound (VOC) in the v&dose zone. There has been many articles discussing the effects of relative humidity on the adsorption of VOC on soils. The adsorption capacity of VOC of soil was reported to decrease significantly with increasing relative humidity in the vapor phase’.‘. The suppression of the soil uptake of VCC by water vapor has heen explained by different affinity of organic vapor and water molecules to the soil mineral surface and organic matter. However, the extent to which the adsorbed water vapor modifies the surfaces of soils is determined by the vapor pressure of water (i.e. relative humidity) and the characteristics of the sorbing site. It has hecn suggested that the surfaces of nature adsorbents, soils and clay minerals, are highly heterogeneous owing to their complex chemical composition and the irregularities of their physical structure’. The adsorption energy between adsorbent and adsorbate reflects the intrinsic property of an adsorption site on the surface. Therefore. the adsorption energy can be a measurable property to describe the tendency of association of sorbcnt and sorbate and be used to categorize the adsorbing site?. In addition, the distribution of the amount of adsorbing
sites according to their adsorbing energy level (similar to a probability density function) could hc a quantitative description of the heterogeneity of the surface in the respect of adsorption tendency.
The objective of this study is to explore the mechanisms of the suppression of uptake of organic vapors by humidity and to establish a model which can explain the change in the adsorption behavior of soil surface before and after the sorption of water vapor.
Materials and Methods
Soil properties: Two soils, slate alluvial soils and diluvium red soils, were sampled and air-dried in the laboratory at room temperature prior to use. The moisture content of the air-dried soil was determmed gravimetrically (oven-drying at 103S”C for 24hr). The soil-pH was measured in a 1: 1 (w/w) s&d-deioni;led water mixture4. The organic carbon content of the soil was obtained by using the Walkley-Black procedure’. 7%~ cation-exchange capacity (CEC) of the soil was determined with the method proposed by Rhoades”. The mechanical analysis was conducted by pipette method’. The specific surface area of the soils was determined by BET nitrogen adsorption method with a porosimeter (Micromeritics Instrument Corporation, ASAP2000). The basic properties of the two soils are listed in Table 1. Soil samples were crushed by a wooden hummer and particles smaller than 0.84 mm were collected and packed into a glass tube.
Table 1, Basic properties of slate alluvial soils and diluvium red soils. slate alluvial diluvium red soil fraction, % clay sill SkiMI PH CEC,cmoUKg
organic carbon content,%, moisture content,% specific surface area (BET/N2)(m2/g) soils soils 23.0 40.6 46.0 46.0 3 1 .o 13.4 7.4 4.3 6.0 3.4 0.95 I .56 0.42 1.43 9.51 30.6
Adsorption of toluene at different relative humidity level: The uptake of tolucne from gas phase were carried out using a sorption apparatus at room temperature under dil’fercnt rclativc humidity levels and different toluene concentrations. Vapors from the organic vapor gcnerutor and the water vapor gcncrator wcrc combined and mixed with dry nitrogen gas to obtain appropriate relative humidity and tolucnc conccnlration in gas flow. The relative humidity of‘the gas llow was monitored continuously by an electronic relative humidity calibrator (VASALA. HMC2O/HMP2OB). The gas samples were collected with a gas-tight syringe ;~nd
analyzed for the organic vapor concentration by a gas chromatograph quipped with llame ionization dctcctor (HPSXYOA). After the vapor system had rcachcd B steady state with constant relative humidity and organic vapor concentration, the soil column was conncctcd to the outlet of the mixing chamber. Normally. D contact time of about 24 hours was required for cstahlishing sorption equilibrium. The amount of organic vapol- sorbed
by soil at varying organic vapor concentration at a fixed relative humidity was determined by extracting the soil with dichloromcthane and analyzing with a gas chromatograph
Adsorption of water vapor: A soil column was connected to the sorption apparatus and purged with nitrogen until the relative humidity of the effluent was below detcctuhlc limit. Then the soil column W;IS weighted and connected to a nitrogen gas flow with certain humidity. Sorption equilibrium was assumed
reached when the weight of soil column did not change in about 24 hours. The amount of water vapor sorbed by soil column was determined by the difference of weights.
Estimation of adsorption energy distribution function: If the adsorption energy distribution function
of adsorbate-adsorbent pairs, F_IE ), can be determined, the overall adsorption isotherm will be the integration ol a number of local isotherms, which describe the sorption behavior of a group of sorption pairs with identicd sorption energy, weighted by the distribution function?
e, (n) = N, C,DJ~N,
= J”*‘e, @,E m kk
, (1)cm>.
where the A! @) (cc/g or mglg) is the experimentally measured total amount of adsorbed VOC at vapor pressure, p, N, (cc/g or mg//s) is the monolayer adsorption capacity, E &J/mole) is the adsorption energy.
0, @,E ) is the local adsorption isotherm for the specific group of adsorbing center with same sorption energy E ,
and E,,,~., is the minimum adsorption energy assumed to be equal to energy of’ condensation of adsorbatc’. The energetic heterogeneity of an adsorbing surface is then characterized by the distribution function F(E ) (mole/kJ) normalized to unity. Three adsorption isotherms have been frequently used to represent the local adsorption isotherm, which are Langmuir equation, Fowler-Guggenheim equation and BET equation”. It is also assumed that the local adsorption isothenns are of’the same type for any adsorption energy level.
An exponential adsorption isotherm has been used to describe the overall adsorption isotherm f’or heterogeneous surface?:
InN,~(p)=In[B,(p)~,,,]=~B,[RTln(p/(,,)]’ (2)
I=0
where the pr is the saturated vapor pressure. This equation was derived with the methods of statistical mechanics to describe the average number of particles in the surface phase of‘an adsorption system”. Fk) can be solved by substituting this exponential adsorption isotherm, equation (2), into equation (I) and using the method of condensation approximation’. The relationship giving pressure p versus adsorption energy E is
E = -RTln(K,p), in which KO is a constant”. The function F(E) can be evaluated as’.’
[ m
F(E) =
c
JBJ(E,,,,,, -EY
e.xp,=I
I [
on
c
R,(E,,,,,,-E)’ ,
I=, 1
(3)
where B, are defined as heterogeneity coefficients, which characterize the structural and surface heterogeneity ol a solid’. To evaluate B’ for the local isotherm interpreted by BET model, equation (2) was modil’ied by severlll researcher?. The experimental adsorption data was approximated by the logarithmic polynomial
NO((,)(I -x) = exp 2 R,[RTW/p,)]’
1 ,=” 1 > (4)
where x = p//l, and ,Y = X/ (l-x). The coefficient B, was related to the monolayer adsorption capacity N,,, = e.xp(B,). In this study the adsorption isotherm of toluene vapor at different relative humidity levels and water vapor will be fitted with equation (4) by adjusting the values of B’s, The estimates ol‘ R coefficients will bc substituted into equation (3) to calculate adsorption energy distribution function, F(F ).
Results and discussion
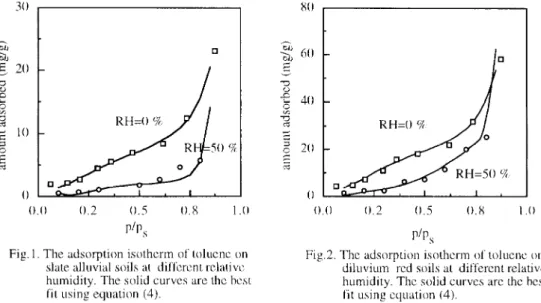
The adsorption isotherm of toluene vapor at different relative humidity levels for these two soils arc shown in Figures 1 and 2. The adsorption of’ toluene vapor by soils is significantly suppressed by water vapor
to only about half of that at very low humidity. These results arc similar to those in previous studies’,*. It is belicvcd that the water molecules and toluene molecules compete simultaneously for the adsorption sites on sod surFace. The experimental results rev& that the Interaction between water vapor and so11 surtke 1s stronger than that between tolucnc vapor and soil surtiace. Some adsorption sites which would adsorb toluene vapor arc occupied by water molecules and the adsorption capacity for toluene vapor is suppressed. The adsorption capacity ol’diluv~um red soil is higher than that of slate alluvial soil. The differcncc coincides with the difference 01’ the spccif’ic surface arca of these two soils. The spccll‘ic surl’acc ;IGI ol~d~l~~vi~m~ red kls (ahout 30 m?g) IS larger than that of alluvial slate so11s (ahout 10 m2/g). The udsorptlon isotherm of water vapor on these two solls are shown in Figure 3 The sorption capacity 01’ diluvium l-cd so11 I’or war vapor is larger than that 01 alluvial slate soil as well
RH=O %
0
0.0 0.2 0,s 0.8 I .o 0.0 0.2 0.5 0.x I .o
P/P,
P/P,
Fig. 1. The adsorption isotherm of tolucnc on Fig.2. The adsorption isotherm of tolucnc on slate alluvial soils at dil’l’crcnt rclativc diluvium red soils at different rclativc humidity. The solid curves are the hcst humidity. The solid curves arc the best
fit using equation (4). fit Lising equation (4).
The adsorption data for each set 01’ adsorption cxperimcnts was transl’ormcd into the form like equation (4). Several sets of R,s with different numhcr and value wcrc ohtaincd from the rcgrcssion of adsorptIon dam with a statistic software StatView. Each set of 19,s was used to charactcrl7e the adsorption hehavlor at different pressure with cyuation (4). an overall adsorption isotherm. Table 2 lists the results of f&s. Figures I, 2 and 3 show that the logarithmic polynomial can describe adsorption data well with ;I set of 19,s. The monolayer adsorption capacity. ,y,,. is culculuted from 4. The cross-sectional ;Lrc;I occupied by LI toluenc molcc~11c and a water molecule is cstimatcd with the method proposed by Trcmainc & Gray’” With thzsc two values the specific surface area of soils COLII~ hc estimated. Both the monolayer adsorption capacity. /y,. and spccilic surface area of soils arc lisrcd in Table 3.
Tdhlc 2. The R, s for each XL of adsorption cxpcrimcnts.
adsorbent adsorhatc 4 4 9 R 4 R
toluene (RH=OR) I ,211 -0.0 I2 -0.03 I -0.000875 0.0003627 -0.000 133.5
slate alluvial soil toluene (RH=SO%~) -0.162 0.161 0.055 0.003 -0.005 -0.00 I water I.759 -0. I I I -0.0 12 0.002 -0.0003 173
toluene (RH=O%) 2.239 -0.03S -0.03 0.0 1 0.0001612 -0.0002066 diluvium red soil tolucne (RH=SO%) 1.3.56 0.312 -0.04 I -0.0 I’) O.OOI 0.000 I
? ?
/
diluvium red soil
0.0 0.2 0.5 0.8 1.0
RH
Fig.3. The adsorption isotherm of water vapor on twodifferent soils. The solid curves are the best fit using equation (4).
0.4 3 0.3 2 a 0.2 K 0. 1 0.0
- diluvium red soil --- slatealluvialsoil
‘%water (kJ/mole)
Fig.4.The adsorption energy distribution function for water-slate alluvial soil pair and water- diluvium red soil pair.
It is found that the specific surface areas obtained from different adsorbates are different. The specific surt’ace area obtained from toluene vapor is smaller than that from water vapor. The specific surface area obtained from toluene vapor under a higher relative humidity is smaller than that at very low humidity. This suggests that part of soil surface was occupied by water vapor and the probing toluene could only access the surface sites which were not occupied by water vapor. The specific surface area estimated from water vapor is much greater than that measured with BET/N:! procedure. The discrepancy may be due to the unique property of water molecules. Mitchell’” classified the possible mechanisms of soil-water interaction into hydrogen bonding, hydration of exchangeable cations, attraction by osmosis, charged surface-dipole attraction and attraction by London dispersion force. Sposito CG Prost I4 suggested that the first stage of water adsorption by clay was the solvation of the exchangeable cations by either three or more water molecules. They further pointed out that these hydration states corresponded to interlamellar c axis spacing large enough to accommodate either one or two layers of adsorbed water molecules. These results in the literature and from this study as well suggest that the water vapor could create new space to accommodate more water molecules inside soils and result in extra monolayer adsorption. Therefore, the specific surface area of soils estimated from the monolayer adsorption capacity of water vapor is different from the specific surf&e area from BET/N2 method and needs to be redefined.
The adsorption energy distribution function, calculated by equation (3), for water vapor sorbed by these two soils are shown in Figure 4. The normalized adsorption energy distribution curve is similar for the two soils, although the chemical composition and physical texture of the two soils are quite different. The adsorption energy distribution function for toluene sorbed by alluvial slate soil and diluvium red soil under diff’erent relative humidities are shown in Figure 5 and Figure 6. The shape of adsorption energy distribution changes significantly with the relative humidity in the vapor phase. It suggests that the water vapor modifics the so11 surface and the probing toluene has quite different al‘f’inity for soil surfaces under different relative humidity. Modified surfaces were seen by the probing toluene and the shape of’ adsorption energy distribution curve was shifted to lower energy. The adsorption energy distribution curves at RH=O4 and RH=50% (Figure 5 and Figure 6) show that the toluene were easily replaced by water molecules on the sites with sorption energy
condensation energy were created which correspond to those unoccupied by water molecules or on the surfaces of newly formed water films. The extent of surface heterogeneity of soil surface decreased as more water molecules being adsorbed onto the soil surface. The water film prohibited the interaction between toluene and so11 surfaces. In addltlon, Pennell” proposed that the VOC would bc condensed onto the interface of gas and liquid. So, the toluene would be condensed onto the water film when the concentration of toluene was high enough in vapor phase. The value of E -E,, .:, dccrcased with an increase in the concentration of toluene in vapor phase. The amount of toluene condcnscd onto the water film increased with the increase of the toluene concentration m vapor phase. The condensation of toluene was recognized as adsorption by soil surface and the numher of adsorption sites estimated by equation (2) at low adsorption energy region increased. Consequently, the adsorption energy distribution curve was raised under lower value of E - E,,,
5 0.6 c RH=O % - __... RH=SO %a 0.0 I.0 2.0 3.0 4.0 s.0 6.0 ~~~~~~~~~~~~~ (kJ/molc)
Fig.5. The adsorption energy distrihutlon Fig.6. The adsorption energy distribution function for toluene-slate alluvial soil function for toluene-diluvium red soil
at RH=O% and 50%; at RH=O% and 50%.
-so
-4.5 -40 -35 -30E (k.hOk)
Fig.7.The adsorption energy distribution tunction for water and toluene vapor
on slate alluvial soils.
- RH=O %a ,\ - , L : ‘,_______ : b : I I a : I : I : : toluent water E (kJ/mole)
Fig.8. The adsorption energy distribution function for water and toluene vapor on diluvium red soils.
1443
To further explain the mechanism of the adsorption of water and toluene onto the soil surfaces, the energy of condensation, E,,,~, , for each one was estimated. Assuming that the vapor of adsorbate followed ideal gas law, the energy of vaporization of adsorbate at temperature T can be represented by
Al?, = MV - RT, (5)
where AE, is the energy of vaporization, AH, is the enthalpy
of
vaporization, R is the gas constant, and T isthe temperature. The energy of condensation, E,“, is the negative value of A.!$. The enthalpy of vaporization, AH,, at temperature T can be estimated from A&, the enthalpy of vaporization at boiling point q with the equation below’?
AlY”=AH,
[
=$
6 c1
n,
where T is the critical temperature of adsorbate. The results of E,, for water and toluene are -46.3 kJ/mole and -46.8 kJ/mole, respectively. Replotting the adsorption energy distribution curves of these two soils for water and toluene with the E,,S was shown in Figure 7 and Figure 8. The curve for water occurs at the right- hand side of that for toluene. It means that the adsorption energy for soil adsorbing water was higher than that for toluene. The soil surface would prefer to adsorb water vapor rather than to adsorb toluene vapor. This result supports the previous suggestion that the water vapor may occupy the surface more easily than toluene and modify the surface.
Conclusion
The sorption capacity of diluvium red soil for water vapor is larger than that of alluvial slate soil as well. The specific surface area obtained for toluene vapor is smaller than that for water vapor. It is likely that the water vapor could create new space to accommodate more water molecules inside soils and result in larger monolayer adsorption capacity. The adsorption of toluene vapor by soils is significantly suppressed by water vapor. The probing toluene has quite different affinity for soil surface under different relative humidity levels. The shapes of the energy distribution functions for these two soil systems were significantly deviated when adsorption took place at different relative humidity levels. It is obvious that the surface of soil has been modified by moisture and the shape of adsorption energy distribution curve was shifted to lower energy. It is likely that there are two mechanisms resulting in the sorption capacity diminishing. Firstly, the adsorption center with higher adsorption energy is occupied by moisture first and the number of available adsorption center decreases. Secondly, the surface is modified by moisture to form a new surface and toluene molecules arc not adsorbed easily by this new surface. Therefore, the adsorption monolayer capacity for toluene estimated by R at 50’% relative humidity is lower than that under very low relative humidity.
Acknowledge: The authors gratefully acknowledge the financial support of the National Science Council. R. 0. C., (Contract No.: NSC 84-2211.EOW018) for this research work.
References
l.Chiou, C. T. and Shoup, T. D., “Soil sorption of organic vapors and effects of humidity on sorptivc mechanism and capacity”, Environ. Sci. Technol., 19, 1195-1200, 1985.
2.Smith, J. A., Chiou, C. T., Kammer, J. A. and Kile, D. E., “Effect of‘ soil moisture on the sorption of trichloroethene vapor to vadose-zone soil at Picatinny Arsenal, New Jersey”, Environ. Sci. Technol., 24, 676-6X7, lYY0.
3.Jaroniec, M. and Br%ucr. P., “Recent progress in determination of energetic heterogeneity of solids from adsorption data”, Surface Science Reports, 6. 65 I 17, 1086.
4.Mc Lean, E. 0.. “Soil pH and lime requirement”, In: A.L. Page, R.H. Miller and D.R. Keeney (Editors), Methods of soil analysis, part 2. Chemical and microbiological properties. Agronomy monograph no. Y(2nd cd.), American Society of Agronomy, Madison, IYY-224, 1982.
S.Nelson, D. W. and Sommers, L. E., “Total carbon. organic carbon, and organic matter”, In: A.L. Page. R.H. Miller and D.R. Keeney (Editors). Methods of soil analysis, part 2. Chemical and microbiological properties. Agronomy monograph no. Y(2nd cd.). American Society of Agronomy, Madison, 539.579. 1982.
6.Rhoades, J. D., “CatIon exchange capacity”, In: A.L. Page, R.H. Miller and D.R. Keeney (Editors),
Methods
of
soil analysis, part 2. Chemical and microhlological properties. Agronomy monograph no Y(2nd cd.), American Society of Agronomy, Madison, 14Y- 157. IYX2.7.Gee, G. W. and Balder, J. W., “Particle-size analysis”, In: A. Klute (Editor), Methods of soil analysis. Part I. Physical and mineralogical methods. Agronomy monograph no. Y(2nd ed.), American Society of Agronomy, Madison. 3X3-41 1, lYX2.
X.Sokolr)wska, Z.. Jozet‘aciuk. G., Sokolowska. S. md Ourumova-Pcsheva, A., “Adsorption 01’ water vapor by soils: Investigations of the influcncc of organic matter, iron. and alummum on cncrgetic hcterogencity 01 clays”. Claya and Clay Matters. 41. 346-352. lYY3.
Y.Jaromec. M., “Adsorption on heterogeneous surl’aces: the exponential equation for the overall adsorption Isotherm”. Surface Science, 50, 553-564. 1075.
lO.Hccr, C. V., “Statistical thermodynamic theory for adsorption Isotherms”. J. Chem. Phys., 55, 4066-407 I. 1971.
1 I .Ccrotolini, G. F., “Localized adsorption on hctcrogcncous surfaces”. Thin Solid Films, 23. I2Y- 152, 1974. 12,Tremaine, P. R. and Gray, D. G.. “Adsorption 01’ noll-swelling vapours on the surface 01. ct’llulosc”, J
Chcm. Sot. Faraday Trans. I , 71, 2170-2 185.. IY7.5.
13.Mitchcl1, J. K., “Fundamentals of Soil Behavior”, John Wiley CG Sons. Inc., New York, 437 pp., 1993. 14.Sposito, G and Prost. R., “Structure 01’ water adsorbed on smectitcs”. Chemical Reviews. 2X. 553-573,
lYX2.
15.Pcnncl1, K. D., Dean Rhuc, R., Rae. P. S. C. d Johnston, C. T.. “Vapor-phase sorption of p-xylcnc and water on soils and clay minerals”, Environ. Sci. Tcchnol.. 26. 756-763, lYY2.
16,Rechstcincr. C. E., Jr.. “Heat of vaporization”. In: W. J. Lyman, W. F. Rcchl and D. H. Rosenblatt (Editors), Handbook of chemical property estimation methods. McGraw-Hill Inc.. American Chemical Society, Washington, DC.. chapter 13, lYX2.