Sequential Distribution of Main Chain
Phosphorus-Containing Copolyesters
Characterized by
1H NMR
Shinn-Jen Chang & Feng-Chih Chang
*
Institute of Applied Chemistry, National Chiao-Tung University, Hsinchu, Taiwan (Received 19 March 1997 ; accepted 1 August 1997)
Abstract : A series of main chain phosphorus-containing copolyesters were syn-thesized by polycondensation of terephthalic acid (TPA), ethylene glycol (EG) and phenyl phosphonic acid (PPA). Chemical structures of these main chain phosphorus-containing copolyesters were characterized by 1H NMR. Experi-mental results show that the resonance intensity of PPA aromatic protons increases with increase of the phosphorus content. The chemical shifts of the ethylene protons in the ethylene glycol units vary with di†erent sequences. The resonance chemical shift of the ethylene protons of the T-E-T unit is higher than those of P-E-T (T-E-P) and P-E-P units. The monomer molar fraction, sequen-tial distribution and degree of randomness of the phosphorus-containing copoly-esters were determined through analyses of the ethylene protons in the ethylene glycol units. The molar fractions of the PPA comonomer determined by 1H NMR analyses are close to the values determined by a UV method. The degree of randomness for the copolyesters was found to be in the range 0É66È0É83.
1998 SCI. (
Polym. Int. 45, 36È42 (1998)
Key words : 1H NMR ; phosphorus-containing copolyester ; sequential distribu-tion ; phosphorus content
INTRODUCTION
Phosphorus-containing compounds are known to have a Ñame-retardant property.1 Flame retardation of organic polymers using phosphorus compounds has been well established.2,3 Organophosphorus Ñame retardants primarily function as a char promoter of car-bonates in the condensed phase,4h8 which can provide excellent Ñame retardation, less volatiles, low smoke and low toxicity. If phosphorus moieties are inserted into the polymer main chain, the phosphorus will not migrate to the surface and maintains its good Ñame retardation and physical properties.
The Ñame retardation of a phosphorus-containing polymer and the correlation with its phosphorus content have been studied previously.7,9 The phos-phorus content was usually determined by a UV
* To whom all correspondence should be addressed.
method,10 or by the charge value. The chemical struc-ture of a copolymer is also known to a†ect its Ñame retardation.11h15
The chemical structure of a copolymer (i.e. random, alternating or block) is important in determining its Ðnal properties. For a copolyester, nuclear magnetic resonance spectroscopy (NMR) is a powerful technique for qualitative and quantitative analyses of its chemical structure.16h22 Yamadera and Murano16 showed that the degrees of randomness of the same copolyesters can be determined by NMR. These analyses can be e†ective provided that the resonance signals of the given proton(s) or carbon(s) with di†erent sequences have dif-ferent chemical shifts. It has also been shown that the aromatic protons of the terephthalate units of copoly-esters with di†erent aromatic and aliphatic diol sequen-ces have di†erent resonance signals.17h19 The resonance signals of the aromatic carbons of terephthalic acid, the aliphatic carbons of ethylene glycol and 1,4-butanediol 36
were found to give a quartet.20 Additionally, the reso-nance signals from the proton(s) or carbon(s) of the glycol units of copolyesters with di†erent diacid sequences also resulted in di†erent chemical shifts, and thus the sequential distributions could be deter-mined.16,21h30
Very few previous studies have been devoted to understanding the sequential distribution of a phosphorus-containing polyester. In this paper, a series of phosphorus-containing copolyesters, poly(ethylene terephthalate)-co-poly(ethylene phenyl phosphonate)s (PET-co-PEPP)s, were synthesized by polycondensation of terephthalic acid, ethylene glycol and a phosphorus-containing comonomer (phenyl phosphonic acid, here-inafter referred to as PPA). We attempted to analyse the sequential distribution of these phosphorus-containing copolyesters and determine their phosphorus content by using proton nuclear magnetic resonance (1H NMR).
EXPERIMENTAL
Terephthalic acid (TPA) and ethylene glycol (EG) were obtained from Tokyo Kasei Ltd., Japan. Zinc acetate and diantimony trioxide were purchased from Merck Schuchardt Ltd, Germany.
Scheme 1 illustrates the two-step preparation of phosphorus-containing copolyesters (PET-co-PEPP)s. The copolyesters with various phosphorus contents, ranging from 0É79 to 5É00 wt%, were synthesized through co-condensation of phosphonic acid with TPA and EG catalysed by zinc acetate as esteriÐcation lyst and diantimony trioxide as polycondensation
cata-Scheme 1. Preparation of PET-co-PEPP polymer.
lyst. The preparation was carried out according to a previously described method.31,32 The copolyester with phosphorus content of 0É79 wt% is denoted as P079, 1É19 wt% is denoted as P119 and so on. The intrinsic viscosities of all the copolyesters measured at 30¡C in phenol/1,1,2,2-tetrachoroethane (60/40 wt/wt) were greater than 0É50 dl g~1.
1H NMR spectra of copolyesters inCF were 3COOD measured with a Bruker Am 400 NMR instrument using tetramethylsilane as an internal standard. A Metertek SP-830 UV spectrophotometer was employed to determine the phosphorus content of the copoly-esters.
For phosphorus content determination, the following four reagents A, B, C and D were prepared :
Reagent A. Solution 1 : 50É0 g ammonium molybdate dissolved in 500 ml of Solu-((NH
4)2MoO4) H2O. tion 2 : 125 ml conc. H diluted with 350 ml
2SO4
Solution 3 : Solution 1 and solution 2 were H
2O.
mixed together and diluted to 1 l. Reagent B. 4N H
2SO4.
Reagent C. 10 g ammonium ferrous sulphate added to 2 ml of ((NH
4)2SO4É FeSO4É 6H2O)
reagent B, and then diluted to 100 ml.
Reagent D. Blank solution (25 ml reagent A] 10 ml reagent B] 8 ml reagent C). The mixed solution was diluted to 100 ml.
A phosphorus-containing copolyester sample of about 10 mg was accurately weighed into a 100 ml Kjel-dahl Ñask, and 1 ml 18M H together with 8 drops
2SO4
of HClO added. The concentrated solution was Ðrst 4
heated at 81¡C for 1 h ; then the temperature was raised to 186¡C for another hour to decompose the copoly-ester completely. The Ñask was cooled to room tem-perature and Ñushed out with 20 ml distilled water. The Ñushed solution, 25 ml reagent A and 10 ml reagent C were added to a 100 ml volumetric Ñask, and then diluted with distilled water to 100 ml. The colour of the solution containing phosphorus was navy blue after 10 min. The phosphorus content of the navy blue sample solution was determined with a UV spectropho-tometer at 700 nm wavelength using triphenyl phos-phine (P content\ 11É83%) as a standard.10
RESULTS AND DISCUSSION
1H NMR spectra of PET, poly(ethylene phenyl phos-phonate (PEP) and copolyester P079 are shown in Fig. 1. The chemical structure and resonance peak assign-ments for each polyester are shown in Table 133,34 and Scheme 2. The chemical shifts of the ethylene protons from the ethylene glycol units are 3É8 to 4É8 ppm and those for the aromatic protons are 7É1 to 8É0 ppm. The resonance peaks of the ethylene protons from the PET-co-PEPPs are interesting. By comparison with the
Fig. 1. 1H NMR spectra of PET, PEP and copolyester P079.
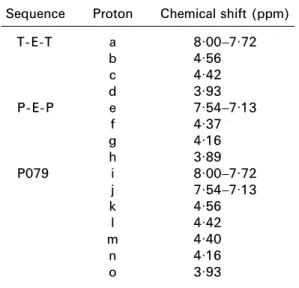
TABLE 1. Assignments for resonance peaks of PET, PEP and P079
Sequence Proton Chemical shift (ppm)
T-E-T a 8·00–7·72 b 4·56 c 4·42 d 3·93 P-E-P e 7·54–7·13 f 4·37 g 4·16 h 3·89 P079 i 8·00–7·72 j 7·54–7·13 k 4·56 l 4·42 m 4·40 n 4·16 o 3·93
resonance peaks of PET and PEP, the resonance of the ethylene protons from the ethylene glycol units of the copolyester can be from four possible sequences as shown in Scheme 3. The sequences of the ethylene protons of T-E-T, T-E-P (P-E-T) and P-E-P resonate at 4É56 (proton k), 4É40 (proton m) and 4É16 (proton n) ppm, respectively. Theb-methylene protons (proton 1) anda-methylene protons (proton o) of the hydroxyl ter-minal units (T-E-OH) in the ethylene glycol units reson-ate at 4É42 and 3É93 ppm, respectively ;34 where T is the
Scheme 3. Sequences of PET-co-PEPP polymer.
terephthalate unit, E is the ethylene glycol unit, P is the phenylphosphonate unit and OH is the hydroxyl group. Figure 2 shows the expanded NMR resonance peaks of the ethylene protons in ethylene glycol units of the phosphorus-containing copolyesters with chemical shifts ranging from 3É8 to 4É8 ppm.
Table 2 summarizes the intensities of the ethylene protons resonating at 4É56, 4É40, 4É16, 4É42 and 3É93 for each copolyester. These chemical shifts are in the range
Fig. 2. Expanded 1H NMR spectra of copolyesters with chemical shifts ranging from 3É8 to 4É8 ppm.
for aliphatic protons of ethylene groups. The resonance chemical shift of the ethylene protons of the T-E-T units (protons k) is higher than that of P-E-T (T-E-P) units (protons m) and P-E-P units (protons n), because the electronegativity of the P unit (phosphorus atom) is weaker than that of the T unit (carbon atom). Compari-sons of the resonance peaks of the ethylene protons from samples of P079, P119, P228, P250, P300 and P500 reveal that the resonance intensity of proton k at 4É56 ppm decreases with increase of the phosphorus
TABLE 2. Resonance intensities of ethylene protons of ethylene glycol unit and molar percentages of PPA
Sample Intensity of chemical shifts X
P(%)a k m n l o P079 0·735 0·081 0·014 0·194 0·194 4·48 P119 0·635 0·146 0·026 0·223 0·223 7·89 P228 0·616 0·182 0·069 0·237 0·237 11·98 P250 0·596 0·192 0·069 0·246 0·246 12·22 P300 0·528 0·309 0·083 0·209 0·209 17·75 P500 0·405 0·497 0·176 0·178 0·178 29·60
a Molar percentage of PPA equal to(I whereS is the m/2 ½In)/S Ã 100%,
integrated intensities of resonance peaks of ethylene proton (S ¼I k½Im ½I
content. Higher phosphorus content implies a higher content of P-E-T (T-E-P) and P-E-P units. Thus, molar fractions of terephthalate (X and PPA of a
T) (XP) phosphorus-containing copolyester can be calculated from the intensities of the peaks from the respective methylene protons (k, m, n, l, o) :
X
T\ (ITET] ITEP/2] ITEOH)/S \ (I k] Im/2] Il] Io)/S (1) X p\ (IPET/2] IPEP)/S \ (I m/2] In)/S (2) whereI (where and
rep-TET, ITEP ITEP* IPET), IPEP ITEOH resent the integrated intensities of the ethylene protonÏs resonance signals of T-E-T, T-E-P, PEP sequences and the T-E-OH terminal unit, respectively, and S is the total integrated intensities of all resonance peaks of these ethylene protons. The results calculated by eqn (2) are listed in Table 2.
Figure 3 shows that the intensity of the PPA aro-matic proton (proton j) resonance increases with increase of the phosphorus content because of higher PPA molar fractions. Thus, the resonance intensity can also be used to quantify the PPA molar fraction of copolyesters. Table 3 lists the proton resonance inten-sities and peak assignments for TPA and PPA aromatic protons of each copolyester. Figure 3 reveals that the TPA aromatic protons (proton i) resonate with chemi-cal shifts ranging from 7É72 to 8É00 ppm while the PPA aromatic protons (proton j) resonate with chemical shifts ranging from 7É54 to 7É13 ppm for each copoly-ester.
The molar fractions of terephthalate (X and PPA T)
can also be obtained from the resonance intensities (X
P)
TABLE 3. Resonance intensities of phenyl protons of the aromatic unit and molar percentages of
phenyl phosphonic acid (PPA) Sample Intensity of chemical shifts X
P(%)a i j P079 1·000 0·064 4·88 P119 0·980 0·106 7·93 P228 1·000 0·202 13·91 P250 1·000 0·267 17·60 P300 0·950 0·262 18·05 P500 0·900 0·586 34·25
a Molar fraction of PPA is equal to Ê(I
j/5)/Í(Ii/4) ½ (Ij/5)ËÌ Ã 100.
of the aromatic protons by eqns (3) and (4) : X
P\ (Ij/5)/[(Ii/4)] (Ij/5)] (3) X
T\ (Ii/4)/[(Ii/4)] (Ij/5)]\ 1 [ XP (4) whereI and represent the integrated intensities of the
j Ii
PPA and TPA aromatic protons, respectively. The results calculated by eqn (3) are listed in Table 3. For comparison, the PPA molar fractions of the phosphorus-containing copolyesters determined by a UV method are listed in Table 4. The molar fractions of PPA obtained by1H NMR analyses are close to those from the UV method. The use of the1H NMR method in calculating monomer molar fractions has the advan-tages of small sample size, together with fast and non-destructive determination. It is not necessary to prepare reagents and to decompose the samples. Thus, the 1H NMR method is more convenient to determine the PPA molar fractions of the phosphorus-containing copoly-esters. By using the monomer molar fractions(X and
P(E)
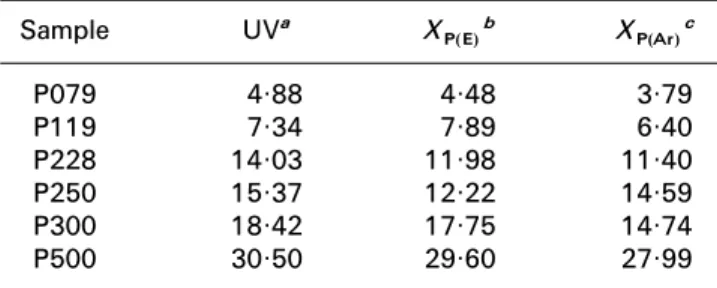
TABLE 4. Molar percentages of PPA obtained by1H NMR, UV methods and relative error
Sample UVa X P(E)b XP(Ar)c P079 4·88 4·48 3·79 P119 7·34 7·89 6·40 P228 14·03 11·98 11·40 P250 15·37 12·22 14·59 P300 18·42 17·75 14·74 P500 30·50 29·60 27·99 a Calculated by a UV method.
b Calculated from the 1H NMR intensity of the ethylene
protons of ethylene glycol units : X
P¼ (IPET/2 ½IPEP)/S Ã 100%.
c Calculated from the 1H NMR intensity of the aromatic
protons :X
P¼ Ê(Ij/5)/Í(Ii/4) ½ (Ij/5)ËÌ Ã 100%.
in Table 4) obtained by the1H NMR method to X
P(Ar)
Ðt a linear least squares equation, the values calculated from the square multiple correlation coefficients are 0É964 and 0É928, respectively. These Ðttings based on1H NMR intensities of the aliphatic protons are considered to be adequate for a linear least squares Ðtted equation because the square multiple correlation coefficients are all greater than 0É6.35
By taking ethylene glycol units as a reference point, the probability of Ðnding a P unit next to a T unit is as follows :36
P
TP\ ITEP/(ITEP] ITET] ITEOH) (5) Similarly, the probability of Ðnding a T unit next to a P unit can be calculated by the following equation :
P
PT\ IPET/(IPET] IPEP) (6) The probability of a P unit next to a T unit for sample P500 is substantially higher than sample P079, because the former has a signiÐcantly higher PPA
molar fraction than the latter. Copolyester containing a higher phosphorus content implies a greater probability of a P unit next to a T unit. TheP of sample P500 is
TP
24É6%, which is close toX (29É6%) as shown in Table P
5.
The number-average sequential lengths of the T (L1 nT) and P (L1 units are calculated by the following
equa-nP) tions : L1 nT\ 1/PTP (7) L1 nP\ 1/PPT (8) The number average sequential lengths of phosphorus-containing copolyesters are also summarized in Table 5. The sample P500 has a lower sequential length of the T unit (4É06) than that of the sample of P079 (28É73), because the former has a substantially higher phos-phorus content than the latter.
The degree of randomness is deÐned by : B\ P
TP] PPT (9) For total randomness of a copolymer, B is equal to unity. For an alternating copolymer, B is equal to two, and for a block copolymer, B is close to zero.
Table 5 lists the degrees of randomness of the phosphorus-containing copolyesters obtained from the 1H NMR analyses. The di†erence in monomer reacti-vity in the esteriÐcation reaction may result in a ten-dency to block distribution ; however, the transesteriÐcation reaction results in a tendency to random distribution of the various sequences in the copolyesters. The degree of randomness of these phosphorus-containing copolyesters is in the range 0É64È0É83. The incorporation of the phosphorus linkage into the main chain backbone results in lower thermal stability. The ethylene phosphonate unit (PwO bond) is more readily attacked at high temperature.33 Therefore,
TABLE 5. Molar percentages of PPA, number average sequential lengths and degree of randomness determined by
1H NMR analyses Sample X P(%)a PTPb PPTc L1nTd L1nPe Bf P079 4·48 0·035 0·742 28·73 1·35 0·77 P119 7·89 0·063 0·738 15·83 1·36 0·80 P228 11·98 0·077 0·566 12·97 1·76 0·64 P250 12·75 0·081 0·582 12·34 1·72 0·66 P300 17·75 0·140 0·650 7·13 1·54 0·79 P500 29·60 0·246 0·585 4·06 1·71 0·83
a Molar percentage calculated from the 1H NMR intensity of ethylene
protons of ethylene glycol units.
b Probability of finding a T unit next to a P unit. c Probability of finding a P unit next to a T unit. d Number-average sequential length of T. e Number-average sequential length of P. f Degree of randomness of the copolyester.
the B values obtained from NMR analyses tend to give greater variation.
CONCLUSIONS
A series of main chain phosphorus-containing copoly-esters have been characterized by using a 400 MHz 1H NMR spectrometer. The resonance intensity of the PPA aromatic protons increases with increase of the PPA content. The chemical shifts of ethylene protons of ethylene glycol units vary with di†erent sequences. The resonance chemical shift of ethylene protons of the T-E-T unit is higher than that of P-E-T (T-E-P) and P-E-P units. Molar fractions of phosphorus-containing comonomer (PPA), their sequential distributions and degrees of randomness were determined through analyses of the ethylene protons in the ethylene glycol units. The molar fraction of PPA could also be obtained from the resonance intensities of the aromatic protons. Monomer fractions of the PPA comonomer obtained from 1H NMR analyses are close to the values deter-mined by a UV method. The copolyesters were found to have a degree of randomness in the range 0É66È0É83.
REFERENCES
1 Sandler, S. R. & Karo, W., Polymer Synthesis, Vol. 1, Academic Press, New York, 1974, p. 367.
2 Cullis, C. F. & Hirschler, M. M., T he Combustion of Organic Poly-mers, Clarendon Press, Oxford, 1981, p. 241.
3 Kuryla, W. C. & Pappa, A. J., Flame Retardancy of Polymer Materials, Vol. 1, Marcel Dekker, New York, 1975.
4 Lyons, J. W., J. Fire Flammability, 1 (1970) 302. 5 Yeh, K. N. & Barker, R. H., T ext. Res., 41 (1971) 932.
6 Yeh, K. N., Birky, M. M. & Huggett, C., J. Appl. Polym. Sci., 17 (1973) 255.
7 Hilado, C. J., Flame Retardants, Ed. Technomic Westpor, Conn. 1973, pp. 1È10.
8 Banks, M. J., Ebdon, R. & Johnson, M., Polym., 34 (1994) 4547. 9 Yang, C. P. & Wang, S. S., J. Polymer. Sci. A, 27 (1987) 3351. 10 Tomsom, M. B., Barone, J. P. & Nancollas, G. H., At. Absorpt.
Newsl., 16 (1977) 117.
11 Nair, C. P., Clouet, R. G. & Guilbert, Y., Polym. Degrad. Stabl., 26 (1989) 305.
12 Sate, M., Kondo, M. & Yokoyama, M., J. Appl. Polym. Sci., 29 (1984) 299.
13 Krevelen, D. W., Polymer, 16 (1975) 615.
14 Liu, Y. L., Hsiue, G. H., Chiu, Y. S., Jeng, R. J. & Ma, C. J., J. Appl. Polym. Sci., 59 (1996) 1619.
15 Camino, G., Grassie, N. & McNeill, I. C., J. Polym. Sci., Polym. Chem., 16 (1978) 95.
16 Yamadera, R. & Murano, M. J., Polym. Sci., Part A-1, 5 (1967) 2259.
17 Hamb, F. L., J. Polym. Sci., Polym. Chem. Ed., 10 (1972) 3217. 18 Gouinlock, E. V., Wolfe, R. A. & Rosenfeld, J. C., J. Appl. Polym.
Sci., 20 (1976) 949.
19 Devaux, J., Godard, P., Mercier, J. P., Touillaux, R. & Dereppe, J. M., J. Polym. Sci., Polym. Phys. Ed., 20 (1982) 1881.
20 Newmark, R. A., J. Polym. Sci., Polym. Chem. Ed., 18 (1980) 559. 21 Khramova, T. S., Urman, Y. G., Avdeveva, G. M., Sedov, L. N. &
Slonim, I. Y. V ysokomol. Soedin. Ser A, 15 (1973) 148.
22 Urman, Y. G., Alekseyeva, S. G. & Slonim, I. Y., V ysokomol. Soedin. Ser A, 19 (1977) 299.
23 Krichedorf, H. R., Makromol. Chem., 179 (1978) 2133.
24 Lenz, R. W. & Schular, A. N., J. Polym. Sci., Polym. Symp., 63 (1978) 343.
25 Andreis, M., Meic, Z. & Veksli, Z., Polymer, 24 (1983) 611. 26 Andreis, M., Veksli, Z. & Meic, Z., Polymer, 26 (1985) 1099. 27 Chen, M. S., Chang, S. J., Chang, R. S., Kuo, W. F. & Tsai, H. B.,
J. Appl. Polym. Sci., 40 (1990) 1053.
28 Huang, J., Guan, G., Sun, T. & Chen, H., Gaofezi Xuebao, 5 (1992) 538.
29 Cheng, C. C., J. Chin. Inst., Chem. Eng., 23(2) (1992) 139.
30 Higashiyama, A., Yamamoto, Y., Chujo, R. & Wu, M., Polym. J. T okyo, 24(12) (1992) 1345.
31 Chang, S. J., Lin, K. L., Tseng, T. W. & Tang, H. I., Jap. Pat. 93,213,913 (1993).
32 Chang, S. J., Sheen, Y. C., Chang, R. S. & Chang, F. C. Polym. Degrad. Stab., 54 (1996) 365.
33 Chang, T. C., Chiu, Y. C., Chen H. B. & Ho, S. Y., Polym. Degrad. Stab., 47 (1995) 375.
34 T he Sadtler Standard Spectra, Sadtler Research Laboratories, 1969, No. 2461.
35 Jurs, P. C., Computer Software Application in Chemistry, John Wiley and Sons, New York, 1986.
36 Davaux, J., Godard, P. & Mercier, J. P., J. Polym. Sci., Polym. Phys. Ed., 20 (1982) 1875.