Noise frequency components and the prevalence of hypertension in workers
Ta-Yuan Chang
a,b,⁎
, Chiu-Shong Liu
c, Li-Hao Young
a, Ven-Shing Wang
a, Shen-En Jian
a, Bo-Ying Bao
da
Department of Occupational Safety and Health, College of Public Health, China Medical University, Taichung, Taiwan, ROC
b
Institute for Risk Assessment Sciences, Utrecht University, Utrecht, The Netherlands
cDepartment of Family Medicine, China Medical University Hospital, Taichung, Taiwan, ROC d
Department of Pharmacy, College of Pharmacy, China Medical University, Taichung, Taiwan, ROC
a b s t r a c t
a r t i c l e i n f o
Article history: Received 20 June 2011
Received in revised form 25 November 2011 Accepted 28 November 2011 Available online xxxx Keywords: Cross-sectional study Frequency analysis Hypertension Occupational noise Workers
Epidemiological studies have demonstrated a relationship between noise exposure and hypertension, but the association between hypertension and noise frequency components remains unclear. This cross-sectional study investigated the association between noise exposure at different frequencies and the prevalence of hy-pertension in 188 screw-manufacturing workers. Participants were divided into one high-noise-exposure group (≥80 A-weighted decibel, [dBA]; n=68) and two reference groups, including 68 low-noise-exposure workers (75.8 ± 3.2 dBA) and 52 office workers (61.5±0.5 dBA). Personal noise low-noise-exposure and en-vironmental octave-band analyses were performed at work. Multiple logistic regression models were used to estimate odds ratios (ORs) for hypertension between different noise-exposure categories after adjustment for potential confounders. Male workers exposed to noise levels at high frequencies of 2000, 4000 or 8000 Hz had a higher but non-significant risk of hypertension. Those exposed to ≥80 dBA for 2–4 years, 4–6 years and more than 6 years had a 4.43-fold (95% CI=1.21–16.15), 1.21-fold (95% CI=0.35–4.21) and 0.95-fold (95% CI = 0.16–5.60) risk of hypertension, respectively, compared with reference workers. A signif-icant association was only observed in male workers exposed to≥70 dBA at 4000 Hz for 2–4 years (adjusted OR = 4.22; 95% CI = 1.15–15.49) and was not found at other frequencies for any periods. These findings sug-gest that occupational noise exposure above 80 dBA for specific periods may be associated with hypertension, and noise frequency at 4000 Hz may have the greatest effect on hypertension.
© 2011 Elsevier B.V. All rights reserved.
1. Introduction
Many epidemiological studies have shown an association between occupational and environmental noise exposure and hypertension. Workers exposed to noise levels above 80 A-weighted decibels (dBA) have been reported to have a higher risk of hypertension (Chang et al., 2011b; Chang et al., 2009; Fogari et al., 1994; Sbihi et al., 2008; Zhao et al., 1991) and elevated blood pressure (Chang et al., 2003; Fouriaud et al., 1984; Green et al., 1991; Lee et al., 2009; Talbott et al., 1999; Tomei et al., 2000; Verbeek et al., 1987). Residents
exposed to road traffic noise at a 24-h average equivalent sound level
(Leq,24 h) above 55 dBA may have a higher odds ratio (OR) for
hyper-tension (Barregard et al., 2009; Bodin et al., 2009; Chang et al., 2011a; de Kluizenaar et al., 2007; Jarup et al., 2008; Leon Bluhm et al., 2007). Residents exposed to aircraft noise of Leq,24 h> 50 dBA may have a
higher risk of hypertension (Eriksson et al., 2010; Eriksson et al.,
2007; Rosenlund et al., 2001).
The biological mechanism between noise exposure and hyperten-sion may be that noise, a psychosocial stressor, activates the sympa-thetic and endocrine systems to induce a release of stress hormones (such as catecholamines, adrenaline, nor-adrenaline and cortisol), producing a transient elevation of blood pressure. Chronic and repet-itive noise stimuli modify these otherwise normal responses to a per-manent upward resetting of baroreceptors and lead to hypertension (Babisch, 2002; Ising and Kruppa, 2004; Spreng, 2000).
However, the association between noise frequency components and hypertension is unclear. Exposure to different frequencies of occupa-tional noise may produce different adverse health effects. Previous studies have found that an audiometric notch at 3000, 4000 or 6000 Hz with recovery at 8000 Hz is a sign of occupational
noise-induced hearing loss (ACOEM, 2003; May, 2000; McBride and
Williams, 2001). High-frequency noise-induced hearing loss may be as-sociated with the risk of hypertension (Chang et al., 2011b). Exposure to
low-frequency noise (10–250 Hz) has been associated with annoyance
in previous studies (Luszczynska et al., 2010;
Pawlaczyk-Luszczynska et al., 2003). Although annoyance is more relevant to envi-ronmental noise exposure than to occupational noise exposure, it also presents in industrial control rooms and office-like areas (Berglund et
Science of the Total Environment xxx (2012) xxx–xxx
Abbreviations: BMI, body mass index; 95% CI, 95% confidence interval; dBA, A-weighted decibel; DBP, diastolic blood pressure; HPD, hearing protective device; LAeq, A-weighted equivalent sound level; OR, odds ratio; SBP, systolic blood pressure.
⁎ Corresponding author at: Department of Occupational Safety and Health, College of Public Health, China Medical University, 91 Hsueh-Shih Road, Taichung 40402, Taiwan, ROC. Tel.: + 886 4 22053366x6203; fax: + 886 4 22079225.
E-mail address:[email protected](T.-Y. Chang).
0048-9697/$– see front matter © 2011 Elsevier B.V. All rights reserved. doi:10.1016/j.scitotenv.2011.11.071
Contents lists available atSciVerse ScienceDirect
Science of the Total Environment
al., 1996; Pawlaczyk-Luszczynska et al., 2009). Low-frequency noise-induced annoyance may produce hypertension by causing emotional responses that interfere with work performance in jobs requiring selec-tive attention or processing of high load of information (Babisch, 2002; Bengtsson et al., 2004; Pawlaczyk-Luszczyniska et al., 2005; Persson Waye et al., 2001; Persson Waye et al., 1997). Work noise annoyance was associated with an increase of diastolic blood pressure (DBP) in a
community-based study (Lercher et al., 1993). To our knowledge,
how-ever, no study has investigated the association between noise frequency components and hypertension. The purpose of this study was to deter-mine the association between occupational noise exposure at different frequencies and the prevalence of hypertension in industrial workers. 2. Materials and methods
2.1. Study population
This cross-sectional study was conducted with 281 employees of a screw-manufacturing plant in Taichung County at the end of 2009. Be-cause personal information, including working history, lifestyle and health examination results, was required to establish the study
popula-tion, only 202 volunteers (23–58 years old) with complete data were
recruited in this study. There were no significant differences between
the 202 participants and the 79 non-participants in terms of educational level, cigarette smoking, alcohol drinking, tea consumption, coffee con-sumption, regular exercise, working activity or family history of hyperten-sion. To avoid interference from non-occupational exposure, nine workers were excluded due to a previous diagnosis of hypertension prior to beginning work in the factory with a questionnaire. In addition, five workers were excluded because they reported the use of hearing pro-tective devices (HPDs) at work that might cause potential bias in
expo-sure classification. Therefore, the study group comprised 136
production-line workers and 52 office workers. Production-line workers
were exposed to occupational noise due to metal cutting, pressing, grind-ing, sand blastgrind-ing, polishing and gear washing processes in manufacturing ball screws and linear guides. The present study was reviewed and ap-proved by the Institutional Review Board of the School of Public Health, China Medical University before the study commenced, and written in-formed consent was obtained from each participant.
2.2. Blood pressure measurements and hypertension
All subjects were required to fast overnight before blood sampling and blood pressure measurements during annual health examinations in 2009. Subjects sat quietly for 10 min in a chair with the back
sup-ported, both feetflat on the floor and arms supported at the heart
level during blood pressure measurements. A trained nurse used an au-tomated sphygmomanometer (Ostar Model P2, Ostar Meditech Corp., Taipei, Taiwan) to measure subjects' blood pressure two times in both
arms at 0700–0900 in the morning, before the subjects began work.
The higher mean value of blood pressure measurements was used to represent individuals' blood pressure in the present study. The proce-dure for blood pressure measurements followed established guidelines (Chobanian et al., 2003; Pickering et al., 2005), and the nurse was blind to the exposure status of each worker during the blood pressure
mea-surements. Subjects were defined as hypertensive if they reported a
previous medical diagnosis of hypertension after beginning work at this factory, if their mean resting systolic blood pressure (SBP) was ≥140 mm Hg or if their mean resting DBP was ≥90 mm Hg. Height, body weight, total cholesterol level and triglyceride level were also measured in all subjects. Body mass index (BMI) was calculated as body weight (kg) divided by the square of height (m2).
In addition, a self-administered questionnaire was used to identify potential confounders. These factors included age, gender, employ-ment duration, cigarette smoking, alcohol drinking, tea consumption, coffee consumption, regular exercise, work activity and family history
of hypertension. Cigarette smokers were defined as those who
smoked cigarettes more than three days per week for at least six
months; alcohol, tea and coffee drinkers were defined by the same
criterion. Regular exercisers were defined as those who participated
in a sporting activity at least three times per week for six months or more. Working activity was categorized into high and low levels based on a scoring system that counted each subject's time of sitting, walking, lifting heavy objects during working periods and the
dis-tance walked between the worksite and home (Hwang et al., 1997).
2.3. Noise exposure assessment and frequency analyses
Workplace noise levels were measured using an octave-band ana-lyzer (TES-1358, TES Electronic Corp., Taipei, Taiwan) that can report 1-sec to 24-h continuous equivalent sound levels (Leq) in the range of
50–120 dBA and time-weighted-average (TWA) noise levels at
fre-quencies of 31.5, 63, 125, 250, 500, 1000, 2000, 4000 and 8000 Hz. This equipment was calibrated with a sound-level calibrator (TES-1356, TES Electronic Corp., Taipei, Taiwan) prior to environmental monitoring. The 8-h TWA Leq and its frequency components were col-lected by industrial hygienists at 14 locations around the company. Each subject was assigned a specific value of noise exposure and various fre-quency components based on the Leq measured in that subject's workplace.
To assess subjects' noise exposure more accurately, personal noise monitoring was conducted simultaneously using a personal noise do-simeter (Logging Noise Dose Meter Type 4443, Brüel & Kjær, Nærum, Denmark.). This equipment can report 5-min continuous Leq at an exchange rate of 3 dBA and TWA noise levels. The range of
50–120 dBA was used to measure all subjects' noise exposure with
5-min readings over 8 h.
To examine the association between occupational noise exposure and the prevalence rate of hypertension, the personal 8-h TWA Leq was used to classify 136 production-line workers into a
high-exposure group (n= 68; noise level≥80 dBA) and a low-exposure
group (n= 68; noise levelb80 dBA). The cut-off value of 80 dBA was se-lected because it was the median in the distribution of personal noise measurements among production-line workers. The same approach was applied to classify production-line workers into the high- and low-exposure groups according to environmental noise exposure and
workplace noise levels at various frequencies. In addition, 52 office
workers were chosen as the other reference group in the present study. The variability of noise exposure distribution, obtained from per-sonal and environmental measurements, was examined on grouping
strategy (Kromhout et al., 1995; Seixas and Sheppard, 1996;
Vermeulen and Kromhout, 2005). To investigate the effects of exposure
duration, production-line workers were also classified into less than
2 years, 2–4 years, 4–6 years and more than 6 years based on the first, second and third quartiles in the distribution of employment duration. 2.4. Statistical analysis
The Shapiro–Wilk test was first used to determine the normality of
the continuous variables of resting SBP and DBP, which were relevant to the prevalence of hypertension, as well as the independent variables of age, environmental and personal noise levels, employment duration, BMI, total cholesterol level and triglyceride level. Statistical p values for these variables were less than 0.001 among all participants, indicating a non-normal distribution. Therefore, multiple comparisons between the
three groups were performed using the Kruskal–Wallis test for
contin-uous variables and the Chi-square test for dichotomous variables. For
those groups with significant differences, the Mann–Whitney test and
the Chi-square test were used to compare the high-exposure group with the two reference groups.
Multiple logistic regression models were applied to calculate odds
between-group differences in the prevalence of hypertension for each of octave band frequencies and for total TWA noise exposure after controlling for potential confounding factors. These confounders
in-cluded significant factors in simple logistic regression models (i.e.,
sex, BMI and triglyceride level), significant variables between the
three groups (such as sex, educational level, triglyceride level, ciga-rette smoking and working activity) and important risk factors of hy-pertension reported in previous literature, including age, cholesterol level, alcohol drinking, regular exercise and family history of hyper-tension (Chobanian et al., 2003; Hajjar et al., 2006). These variables were selected manually and stepwise into multiple logistic regression models because only two variables of gender (p = 0.052) and BMI
(p = 0.002) were retained in thefinal step while using an automatic
stepwise procedure. Sensitivity analyses estimated the effects of one continuous variable of occupational noise exposure (instead of cate-gorical exposure) and two dichotomous variables of environmental noise measurements (instead of personal noise measurements) on the prevalence of hypertension. The SAS standard package for Win-dows version 9.1 (SAS Institute Incorporation, Cary, North Carolina,
USA) was used for statistical analyses. The significance level was set
at 0.050 for all tests. 3. Results
Table 1summarizes the demographic characteristics and potential
risk factors for the three groups of 188 subjects. Significant
differ-ences were identified in the mean values of resting SBP, resting DBP
and triglyceride level as well as the proportions of male subjects, ed-ucational level, cigarette smoking and high working activity between
the three groups. Workers in the high-exposure group had signi
fi-cantly higher mean values of resting SBP, resting DBP and triglyceride level as well as the higher proportions of male subjects, educational
levelb13 years, cigarette smoking and high working activity than
those in the office group. In addition, high-exposure workers had a
significantly larger proportion of high working activity compared
with low-exposure workers.
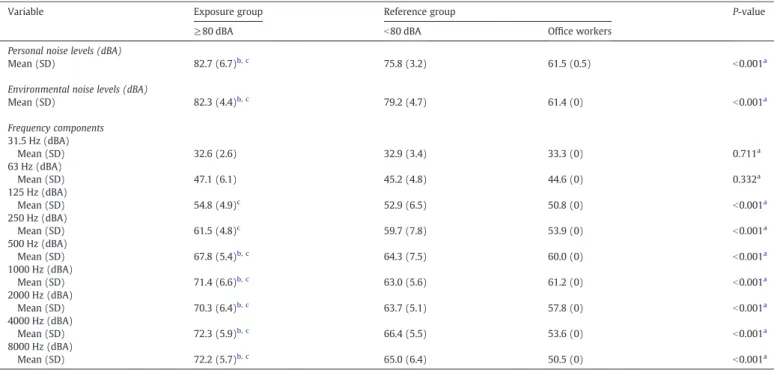
Table 2presents personal and environmental measurements of noise exposure as well as frequency components of environmental noise for the three groups. The grouping strategy based on personal sampling had lower between-group and within-group variances in the log-transformed noise exposure distributions compared with the grouping strategy based on environmental sampling (data not shown). Accordingly, the grouping strategy based on personal sam-pling had little higher resolution than one based on environmental
sampling (99.3% vs. 99.2%). Significant differences were identified in
the mean values of personal noise level, environmental noise level and frequency components at 125, 250, 500, 1000, 2000, 4000 and 8000 Hz between the three groups. High-exposure workers had
sig-nificantly higher mean values of personal noise level, environmental
noise level and frequency components at 500, 1000, 2000, 4000 and
8000 Hz than low-exposure workers and office workers. In addition,
workers in the high-exposure group had significantly higher mean
values of noise frequency components at 125 and 250 Hz than workers in the office.
Table 1
Demographic characteristics in three different study groups.
Characteristic Exposure group Reference group P-value
≥80 dBA b80 dBA Office workers
Subjects (no.) 68 68 52
Age (years)
Mean (SD) 32.4 (6.4) 31.9 (5.5) 33.4 (6.7) 0.479a
Employment duration (years)
Mean (SD) 3.8 (2.7) 3.8 (3.3) 4.2 (3.3) 0.657a
Body mass index (kg/m2
) Mean (SD) 23.5 (3.8) 24.2 (4.1) 22.9 (3.6) 0.172a Resting SBP (mmHg) Mean (SD) 129.2 (12.5)c 127.9 (10.8) 121.7 (15.9) 0.013a Resting DBP (mmHg) Mean (SD) 80.0 (8.7)c 80.1 (10.2) 75.8 (11.4) 0.027a Total cholesterol (mg/dl) Mean (SD) 187.3 (33.7) 197.0 (39.0) 186.4 (35.1) 0.317a Triglyceride level (mg/dl) Mean (SD) 135.0 (84.0)c 124.6 (71.8) 92.1 (45.3) 0.005a Gender Male (%) 66 (97.1)e 63 (92.7) 26 (50.0) b0.001b Educational level ≥ 13 years 15 (22.1)e 19 (27.9) 39 (75.0) b0.001b Cigarette smoking Yes (%) 27 (39.7)e 28 (41.2) 7 (13.5) 0.002b Alcohol drinking Yes (%) 12 (17.7) 11 (16.2) 6 (11.5) 0.641b Tea consumption Yes (%) 34 (50.0) 33 (48.5) 29 (55.8) 0.717b Coffee consumption Yes (%) 20 (29.4) 21 (30.9) 18 (34.6) 0.826b Regular exercise Yes (%) 6 (8.8) 10 (14.7) 9 (17.3) 0.364b
Family history of hypertension
Yes (%) 24 (35.3) 23 (33.8) 22 (42.3) 0.605b
Working activity
High (%) 62 (91.2)d,e
43 (63.2) 4 (7.7) b0.001b
dBA, A-weighted decibel; DBP, diastolic blood pressure; SBP, systolic blood pressure.
aKruskal–Wallis test of differences between groups. b
Chi-square test of differences between groups.
c
Mann–Whitney test of significant difference (pb0.050) compared with office workers.
d Chi-square test of significant difference (pb0.05) compared with the low-exposure (b80 dBA) group. e Chi-square test of significant difference (pb0.05) compared with office workers.
Table 3summarizes the association between occupational noise ex-posure and the risk of hypertension between two different subpopula-tions. In simple logistic regression models, three variables, male
gender, BMI≥23 kg/m2
and triglyceride level≥100 mg/dl, were
signifi-cantly associated with the prevalence of hypertension (pb0.050).
How-ever, there were no significant differences in the risk of hypertension between the high-exposure group and the two reference groups in mul-tiple logistic regression models. The same results were found when
workers were classified into smoking and non-smoking subgroups
(data not shown). In sensitivity analyses, one continuous variable of oc-cupational noise exposure was positively associated with the increased risk of hypertension, but it was not statistically significant (adjusted
odds ratio = 1.01; 95% confidence interval=0.95–1.07, p=0.820). The
effect estimates of using environmental sampling on the prevalence of hypertension were similar to those using personal sampling, but these results were also not significant (both p values>0.050).
Fig. 1shows the association between noise frequency components and the risk of hypertension among male production-line workers
(n = 129), classified by median values of noise levels. Workers
ex-posed to noise levels≥70 dBA at 2000 Hz (adjusted OR=1.92, 95%
CI = 0.76–4.82), 4000 Hz (adjusted OR=2.05, 95% CI=0.82–5.12)
or 8000 Hz (adjusted OR = 2.34, 95% CI = 0.89–6.16) had a higher
risk of hypertension compared with the reference workers after con-trolling for potential confounders. No significant results in any octave band frequencies were found in the present study.
To investigate the association between the effects of noise expo-sure and employment duration on the prevalence rates of hyperten-sion, ORs for male production-line workers exposed to noise
levels≥80 dBA for 2–4 years, 4–6 years and more than 6 years were
compared with those in the reference group, including 63 workers
exposed tob80 dBA and 19 workers exposed to ≥80 dBA for less
than 2 years. As shown inFig. 2, male production-line workers
ex-posed to≥80 dBA for 2–4 years (noise levels of 83.4±2.7 dBA;
ad-justed OR = 4.43, 95% CI = 1.21–16.15) had a significantly higher
risk of hypertension than did the reference group (noise levels of 77.6 ± 4.4 dBA) after adjusting for potential confounders. However,
there were no statistically significant associations between workers
exposed to noise levels greater than 80 dBA at other employment du-rations and the prevalence of hypertension. The examination of the duration of employment as a continuous variable showed that it
Table 2
Noise exposure and noise frequency components by study groups.
Variable Exposure group Reference group P-value
≥80 dBA b80 dBA Office workers
Personal noise levels (dBA)
Mean (SD) 82.7 (6.7)b, c 75.8 (3.2) 61.5 (0.5) b0.001a
Environmental noise levels (dBA)
Mean (SD) 82.3 (4.4)b, c 79.2 (4.7) 61.4 (0) b0.001a Frequency components 31.5 Hz (dBA) Mean (SD) 32.6 (2.6) 32.9 (3.4) 33.3 (0) 0.711a 63 Hz (dBA) Mean (SD) 47.1 (6.1) 45.2 (4.8) 44.6 (0) 0.332a 125 Hz (dBA) Mean (SD) 54.8 (4.9)c 52.9 (6.5) 50.8 (0) b0.001a 250 Hz (dBA) Mean (SD) 61.5 (4.8)c 59.7 (7.8) 53.9 (0) b0.001a 500 Hz (dBA) Mean (SD) 67.8 (5.4)b, c 64.3 (7.5) 60.0 (0) b0.001a 1000 Hz (dBA) Mean (SD) 71.4 (6.6)b, c 63.0 (5.6) 61.2 (0) b0.001a 2000 Hz (dBA) Mean (SD) 70.3 (6.4)b, c 63.7 (5.1) 57.8 (0) b0.001a 4000 Hz (dBA) Mean (SD) 72.3 (5.9)b, c 66.4 (5.5) 53.6 (0) b0.001a 8000 Hz (dBA) Mean (SD) 72.2 (5.7)b, c 65.0 (6.4) 50.5 (0) b0.001a
dBA, A-weighted decibel; SD, standard deviation.
aKruskal–Wallis test of differences between groups.
b Mann–Whitney test of significant difference (pb0.050) compared with the low-exposure (b 80 dBA) group. c
Mann–Whitney test of significant difference (pb0.050) compared with office workers.
Table 3
Associations between noise exposure and prevalence of hypertension.
Variable Hypertension (%) Simple logistic regression model Multiple logistic regression modela
Crude OR (95% CI) Adjusted OR (95% CI)
Subpopulation 1
≥80 dBA group vs. b80 dBA group 17 (25.0)/14 (20.6) 1.29 (0.58, 2.87) 1.37 (0.56, 3.36)
Subpopulation 2
≥80 dBA group vs. office workers 17 (25.0)/7 (13.5) 2.14 (0.82, 5.64) 1.11 (0.17, 7.08)
dBA, A-weighted decibel; OR, odds ratio; 95% CI, 95% confidence interval.
a
Multiple logistic regression model adjusted for significant factors in simple logistic regression models (i.e., gender, body mass index and triglyceride level (≥100 vs. b100 mg/ dl)), significant variables between the three groups (such as gender, educational level (≥13 years vs. b13 years), triglyceride level, current smoking and working activity (high vs. low)) and important risk factors reported in previous literature (i.e., age, cholesterol level (≥200 vs. b200 mg/dl), alcohol drinking, regular exercise and family history of hypertension).
was positively associated with the risk of hypertension among workers exposed to noise levels above 80 dBA, but this result was
not significant in the multiple logistic regression model (adjusted
odds ratio = 1.02; 95% confidence interval=0.87–1.20, p=0.785).
Such inverse “V-shaped” associations were found among male
production-line workers exposed to noise levels≥70 dBA at 1000,
2000, 4000 or 8000 Hz for 2–4 years, 4–6 years and more than
6 years, as shown inFig. 3. Only workers exposed to≥70 dBA at
4000 Hz for 2–4 years (noise levels of 75.1±2.3 dBA at 4000 Hz;
ad-justed OR = 4.00, 95% CI = 1.04–15.42) had a significantly higher risk
of hypertension compared with the reference group (noise levels of 67.0 ± 6.1 dBA at 4000 Hz) after controlling for potential confounding factors (Fig. 3(c)). These inverse“V-shaped” associations might dem-onstrate the healthy worker effect in the present study.
4. Discussion
The present study is thefirst to show the association between
noise frequency components and the prevalence of hypertension. We found that exposure to occupational noise at high frequencies (i.e., 2000, 4000 and 8000 Hz) was associated with an increased risk
of hypertension. In particular, workers exposed to ≥70 dBA at
4000 Hz for 2–4 years had a significantly higher OR of hypertension
compared with workers exposed tob70 dBA at 4000 Hz and those
ex-posed to≥70 dBA at 4000 Hz with seniority less than 2 years. One
possible reason for thisfinding may be that high-frequency noise
exposure has a greater effect than low-frequency noise exposure on the release of stress hormones through the activation of the sympa-thetic and endocrine systems. An experimental study reported that -1.0 0.0 1.0 < 35 dBA >= 35 dBA < 45 dBA >= 45 dBA < 55 dBA >= 55 dBA < 60 dBA >= 60 dBA < 65 dBA >= 65 dBA < 70 dBA >= 70 dBA < 70 dBA >= 70 dBA < 70 dBA >= 70 dBA < 70 dBA >= 70 dBA 31.5 Hz 63 Hz 125 Hz 250 Hz 500 Hz 1000 Hz 2000 Hz 4000 Hz 8000 Hz
Log OR
Fig. 1. Odds ratios and 95% confidence intervals for hypertension by median values of noise levels at different frequencies in male production-line workers (n=129). All analyses adjusted for age, body mass index, cholesterol level, triglyceride level, educational level, current smoking, alcohol drinking, regular exercise, working activity and family history of hypertension. -1.0 0.0 1.0 2.0 < 2 2-4 4-6 >=6
Threshold >=80 dB(A), male production-line workers (n = 129)
Duration of employment (years)
Log OR
Fig. 2. Odds ratios and 95% confidence intervals for hypertension by duration of employment in male workers. All analyses adjusted for age, body mass index, cholesterol level, triglyceride level, educational level, current smoking, alcohol drinking, regular exercise, working activity and family history of hypertension.
-1.0 0.0 1.0 2.0
< 2 2-4 4-6 >=6 < 2 2-4 4-6 >=6 < 2 2-4 4-6 >=6
Threshold >= 35 dB(A) at 31.5 Hz Threshold >= 45 dB(A) at 63 Hz Threshold >= 55 dB(A) at 125 Hz Duration of employment (years)
Log OR -1.0 0.0 1.0 2.0 < 2 2-4 4-6 >=6 < 2 2-4 4-6 >=6 < 2 2-4 4-6 >=6
Threshold >= 60 dB(A) at 250 Hz Threshold >= 65 dB(A) at 500 Hz Threshold >= 70 dB(A) at 1000 Hz Duration of employment (years)
Log OR -1.0 0.0 1.0 2.0 < 2 2-4 4-6 >=6 < 2 2-4 4-6 >=6 < 2 2-4 4-6 >=6
Threshold >= 70 dB(A) at 2000 Hz Threshold >= 70 dB(A) at 4000 Hz Threshold >= 70 dB(A) at 8000 Hz Duration of employment (years)
Log OR
a
b
c
Fig. 3. Odds ratios and 95% confidence intervals for hypertension at different frequencies by duration of employment in male workers. (a) Low frequencies; (b) medium frequen-cies; (c) high frequencies. All analyses adjusted for age, body mass index, cholesterol level, triglyceride level, educational level, current smoking, alcohol drinking, regular exercise, working activity and family history of hypertension.
a temporary elevation of saliva cortisol levels occurred in healthy male college students after pure tone exposure of 3000 Hz at
75 dBA (Yamamura et al., 1982). Another reason might be that men
had a higher auditory sensitivity to high-frequency noise exposure than to low-frequency noise exposure. A previous study showed a
dose–response association between high-frequency hearing loss at
4000 or 6000 Hz bilaterally and the risk of hypertension (Chang et
al., 2011b). The notch at 4000 Hz in hearing loss has been considered the damage of outer hair cells within the cochlea. However, the link of this mechanism within the cochlea between hypertension and noise exposure at 2000 or 8000 Hz is not clear due to the lack of measure-ments for stress biomarkers. Future studies are advised to investigate this association at different noise frequencies.
Our results revealed that workers exposed to occupational noise
with seniority of 2–4 years had a high prevalence of hypertension
re-gardless of noise exposure at 2000, 4000 or 8000 Hz. Because subjects with a previous diagnosis of hypertension prior to working in the
fac-tory were excluded, thisfinding might imply that the higher risk of
hypertension was observed only after occupational noise exposure over an empirical induction time (induction and latent periods). However, the risk of hypertension declined as seniority increased.
One possible reason for thisfinding might be that these workers
dem-onstrated healthier behaviors. For example, workers exposed to ≥70 dBA at 4000 Hz more than 6 years had lower proportions of cig-arette smoking (30.8% vs. 42.3%) and alcohol drinking (15.4% vs. 19.2%) compared with the reference group. Another reason might be that production-line workers with noise-induced hypertension
were transferred to the office. For instance, 2 out of 7 hypertension
cases among office workers (28.6%) had employment durations of
more than 6 years.
We also observed that workers exposed to noise levels≥80 dBA for
2–4 years had a significantly higher risk of hypertension than the
refer-ence group. Thisfinding was based on measurements of personal noise
exposure and the exclusion of the use of HPDs at work.Fogari et al.
(1994)reported that metallurgical workers exposed to environmental noise levels exceeding 80 dBA with employment durations of 11.6 ±
5.3 years had a significantly higher prevalence of hypertension than
those exposed to less than 80 dBA.Chang et al. (2009)found that
syn-thetic leather workers (55.6% using HPDs at work) exposed to 84.1
± 2.3 dBA with employment durations of 7.4 ± 1.3 years had a signi
fi-cantly higher OR for hypertension compared with those exposed to 72.8 ± 2.2 dBA. These consistent results imply that exposure to occupa-tional noise levels above 80 dBA might be associated with a risk of hy-pertension, although the noise exposure was less than the regulatory limit of 90 dBA in Taiwan.
The present study used results from personal sampling to classify subjects in an attempt to prevent non-differential misclassification of exposure, which might bias the risk estimate toward the null value (Checkoway et al., 2004). The exclusion of subjects who wore HPDs at work overcame an exposure bias that might produce a
non-significant difference in the prevalence of hypertension between the
noise-exposure and reference groups. It may be more effective to monitor occupational noise levels and related frequency components simultaneously to evaluate the association between noise frequency characteristics and hypertension.
A cross-sectional design of a temporal problem can potentially limit the causal inference between noise frequency components and the risk of hypertension. Although study subjects without a previous diagnosis of hypertension were recruited, the exposure history of par-ticipants prior to employment at this factory was unknown, which limited the ability to elaborate upon the between-group differences in the prevalence of hypertension due to occupational noise exposure.
Furthermore, inverse“V-shaped” associations between
occupa-tional noise exposure and employment duration might reveal the healthy worker effect, which is one of the main drawbacks in cross-sectional studies. Because employees working in December 2009
were recruited as study subjects, some workers exposed to noise levels above 80 dBA may have previously quit their jobs due to hyper-tension or noise-induced cardiovascular diseases. Therefore, the remaining workers may have been healthier employees or those more tolerant to noise exposure.
Additionally, the absence of time-activity logs in personal noise
measurements may have limited the source identification and
ex-cluded some peak values at workplaces that are useful information to reduce workers' noise exposure in this study.
Finally, some confounders were not considered as covariates in the data analyses. These confounders are hypothesized to be associat-ed with noise exposure and are important risk factors of hyperten-sion, including low-density lipoprotein cholesterol and glycemia
(i.e., blood glucose) (Babisch, 2002; Laurenzi et al., 1990; Lemne et
al., 1994; Sowers et al., 1993). These unmeasured factors might con-tribute to the overestimate of the noise-exposure effect on the prev-alence of hypertension.
5. Conclusions
The present study showed an association between occupational
noise exposure during specific periods and the prevalence of
hyper-tension in screw-manufacturing workers. This association was pro-nounced in noise frequency components at 4000 Hz. Occupational noise exposure at different frequencies may be associated with the variation in the risk of hypertension. Both exposure intensity and fre-quency characteristics should be considered to investigate the
rela-tionship between noise exposure and the development of
hypertension in future studies. Acknowledgments
We thank the National Science Council, Taiwan (NSC
100-2221-E-039-004) forfinancial support. We also thank all of the individuals
who volunteered to participate in this study. In addition, we thank Dr. Hans Kromhout for his consultation on the grouping strategy and the anonymous reviewers for their valuable suggestions. References
ACOEM. ACOEM evidence-based statement: noise-induced hearing loss. J Occup Envi-ron Med 2003;45:579–81.
Babisch W. The noise/stress concept, risk assessment and research needs. Noise Health 2002;4:1-11.
Barregard L, Bonde E, Ohrstrom E. Risk of hypertension from exposure to road traffic noise in a population-based sample. Occup Environ Med 2009;66:410–5. Bengtsson J, Waye KP, Kjellberg A. Evaluations of effects due to low-frequency noise in
a low demanding work situation. J Sound Vib 2004;278:83–99.
Berglund B, Hassmen P, Job RF. Sources and effects of low-frequency noise. J Acoust Soc Am 1996;99:2985–3002.
Bodin T, Albin M, Ardo J, Stroh E, Ostergren PO, Bjork J. Road traffic noise and hyperten-sion: results from a cross-sectional public health survey in southern Sweden. Envi-ron Health 2009;8:38.
Chang TY, Jain RM, Wang CS, Chan CC. Effects of occupational noise exposure on blood pressure. J Occup Environ Med 2003;45:1289–96.
Chang TY, Wang VS, Hwang BF, Yen HY, Lai JS, Liu CS, et al. Effects of co-exposure to noise and mixture of organic solvents on blood pressure. J Occup Health 2009;51:332–9.
Chang TY, Liu CS, Bao BY, Li SF, Chen TI, Lin YJ. Characterization of road traffic noise ex-posure and prevalence of hypertension in central Taiwan. Sci Total Environ 2011a;409:1053–7.
Chang TY, Liu CS, Huang KH, Chen RY, Lai JS, Bao BY. High-frequency hearing loss, oc-cupational noise exposure and hypertension: a cross-sectional study in male workers. Environ Health 2011b;10:35.
Checkoway H, Pearce N, Kriebel D. Precision and validity in study design. Research Method in Occupational Epidemiology. New York: Oxford University Press; 2004. p. 83-121. Chobanian AV, Bakris GL, Black HR, Cushman WC, Green LA, Izzo Jr JL, et al. The Seventh
Report of the Joint National Committee on Prevention, Detection, Evaluation, and Treatment of High Blood Pressure: the JNC 7 report. JAMA 2003;289:2560–72. de Kluizenaar Y, Gansevoort RT, Miedema HM, de Jong PE. Hypertension and road
traf-fic noise exposure. J Occup Environ Med 2007;49:484–92.
Eriksson C, Rosenlund M, Pershagen G, Hilding A, Ostenson CG, Bluhm G. Aircraft noise and incidence of hypertension. Epidemiology 2007;18:716–21.
Eriksson C, Bluhm G, Hilding A, Ostenson CG, Pershagen G. Aircraft noise and incidence of hypertension–gender specific effects. Environ Res 2010;110:764–72. Fogari R, Zoppi A, Vanasia A, Marasi G, Villa G. Occupational noise exposure and blood
pressure. J Hypertens 1994;12:475–9.
Fouriaud C, Jacquinet-Salord MC, Degoulet P, Aime F, Lang T, Laprugne J, et al. Influence of socioprofessional conditions on blood pressure levels and hypertension control. Epide-miologic study of 6,665 subjects in the Paris district. Am J Epidemiol 1984;120:72–86. Green MS, Schwartz K, Harari G, Najenson T. Industrial noise exposure and ambulatory
blood pressure and heart rate. J Occup Med 1991;33:879–83.
Hajjar I, Kotchen JM, Kotchen TA. Hypertension: trends in prevalence, incidence, and control. Annu Rev Public Health 2006;27:465–90.
Hwang LC, Chen CJ, Tsieng WP. A nested case control study on multiple risk factors for acute fatal cerebrovascular accident and coronary heart disease. Chin J Fam Med 1997;7:121–30. Taiwan.
Ising H, Kruppa B. Health effects caused by noise: evidence in the literature from the past 25 years. Noise Health 2004;6:5-13.
Jarup L, Babisch W, Houthuijs D, Pershagen G, Katsouyanni K, Cadum E, et al. Hyperten-sion and exposure to noise near airports: the HYENA study. Environ Health Per-spect 2008;116:329–33.
Kromhout H, Loomis DP, Mihlan GJ, Peipins LA, Kleckner RC, Iriye R, et al. Assessment and grouping of occupational magneticfield exposure in five electric utility com-panies. Scand J Work Environ Health 1995;21:43–50.
Laurenzi M, Mancini M, Menotti A, Stamler J, Stamler R, Trevisan M, et al. Multiple risk fac-tors in hypertension: results from the Gubbio study. J Hypertens Suppl 1990;8:S7-S12. Lee JH, Kang W, Yaang SR, Choy N, Lee CR. Cohort study for the effect of chronic noise exposure on blood pressure among male workers in Busan, Korea. Am J Ind Med 2009;52:509–17.
Lemne C, Hamsten A, Karpe F, Nilsson-Ehle P, de Faire U. Dyslipoproteinemic changes in borderline hypertension. Hypertension 1994;24:605–10.
Leon Bluhm G, Berglind N, Nordling E, Rosenlund M. Road traffic noise and hyperten-sion. Occup Environ Med 2007;64:122–6.
Lercher P, Hortnagl J, Kofler WW. Work noise annoyance and blood pressure: com-bined effects with stressful working conditions. Int Arch Occup Environ Health 1993;65:23–8.
May JJ. Occupational hearing loss. Am J Ind Med 2000;37:112–20.
McBride DI, Williams S. Audiometric notch as a sign of noise induced hearing loss. Occup Environ Med 2001;58:46–51.
Pawlaczyk-Luszczyniska M, Dudarewicz A, Waszkowska M, Szymczak W, Sliwinska-Kowalska M. The impact of low-frequency noise on human mental performance. Int J Occup Med Environ Health 2005;18:185–98.
Pawlaczyk-Luszczynska M, Dudarewicz A, Waszkowska M, Sliwinska-Kowalska M. As-sessment of annoyance from low frequency and broadband noises. Int J Occup Med Environ Health 2003;16:337–43.
Pawlaczyk-Luszczynska M, Dudarewicz A, Waszkowska M, Sliwinska-Kowalska M. An-noyance related to low frequency noise in subjective assessment of workers. J. Low Freq. Noise Vib. Act. Control. 2009;28:1-17.
Pawlaczyk-Luszczynska M, Dudarewicz A, Szymczak W, Sliwinska-Kowalska M. Evalu-ation of annoyance from low frequency noise under laboratory conditions. Noise Health 2010;12:166–81.
Persson Waye K, Rylander R, Benton S, Leventhall HG. Effects on performance and work quality due to low frequency ventilation noise. J. Low Freq. Noise Vib. Act. Control. 1997;205:467–74.
Persson Waye K, Bengtsson J, Kjellberg A, Benton S. Low frequency noise“pollution” in-terferes with performance. Noise Health 2001;4:33–49.
Pickering TG, Hall JE, Appel LJ, Falkner BE, Graves J, Hill MN, et al. Recommendations for blood pressure measurement in humans and experimental animals: Part 1: blood pressure measurement in humans: a statement for professionals from the Subcom-mittee of Professional and Public Education of the American Heart Association Council on High Blood Pressure Research. Hypertension 2005;45:142–61. Rosenlund M, Berglind N, Pershagen G, Jarup L, Bluhm G. Increased prevalence of
hy-pertension in a population exposed to aircraft noise. Occup Environ Med 2001;58:769–73.
Sbihi H, Davies HW, Demers PA. Hypertension in noise-exposed sawmill workers: a co-hort study. Occup Environ Med 2008;65:643–6.
Seixas NS, Sheppard L. Maximizing accuracy and precision using individual and grouped exposure assessments. Scand J Work Environ Health 1996;22:94-101. Sowers JR, Standley PR, Ram JL, Jacober S, Simpson L, Rose K. Hyperinsulinemia, insulin
resistance, and hyperglycemia: contributing factors in the pathogenesis of hyper-tension and atherosclerosis. Am J Hypertens 1993;6:260S–70S.
Spreng M. Central nervous system activation by noise. Noise Health 2000;2:49–58. Talbott EO, Gibson LB, Burks A, Engberg R, McHugh KP. Evidence for a dose–response
relationship between occupational noise and blood pressure. Arch Environ Health 1999;54:71–8.
Tomei F, Fantini S, Tomao E, Baccolo TP, Rosati MV. Hypertension and chronic exposure to noise. Arch Environ Health 2000;55:319–25.
Verbeek JH, van Dijk FJ, de Vries FF. Non-auditory effects of noise in industry. IV. Afield study on industrial noise and blood pressure. Int Arch Occup Environ Health 1987;59:51–4.
Vermeulen R, Kromhout H. Historical limitations of determinant based exposure groupings in the rubber manufacturing industry. Occup Environ Med 2005;62: 793–9.
Yamamura K, Maehara N, Sadamoto T, Harabuchi I. Effect of intermittent (traffic) noise on man–temporary threshold shift, and change in urinary 17-OHCS and saliva cor-tisol levels. Eur J Appl Physiol Occup Physiol 1982;48:303–14.
Zhao YM, Zhang SZ, Selvin S, Spear RC. A dose response relation for noise induced hy-pertension. Br J Ind Med 1991;48:179–84.