Subscriber access provided by NATIONAL TAIWAN UNIV
Industrial & Engineering Chemistry Research is published by the American Chemical Society. 1155 Sixteenth Street N.W., Washington, DC 20036
Crystal Growth and Agglomeration of Calcium Sulfite Hemihydrate Crystals
Clifford Y. Tai, and Pao-Chi ChenInd. Eng. Chem. Res., 1995, 34 (4), 1342-1351 • DOI: 10.1021/ie00043a040 Downloaded from http://pubs.acs.org on November 25, 2008
More About This Article
The permalink http://dx.doi.org/10.1021/ie00043a040 provides access to: • Links to articles and content related to this article
1342 I n d . Eng. C h e m . Res. 1995,34, 1342-1351
Crystal Growth and Agglomeration of Calcium Sulfite Hemihydrate
Crystals
Clifford
Y.
Tai*Department of Chemical Engineering, National Taiwan University, Taipei, Taiwan 1061 7, ROC Pao-Chi
Chen
Department of Chemical Engineering, Long-Hau Junior College, Tao-Yuan, Taiwan, ROC
Crystal growth and agglomeration of calcium sulfite hemihydrate crystals from solution were
studied by reacting Ca(OH)2 with NaHS03 in a pH-stat semibatch crystallizer. Single platelet
crystals and agglomerates of platelet crystals were produced in
the
pH range from 5.80 to 6.80.The crystallization mechanism changed from primary nucleation to crystal growth in the progressive precipitation. Using the titration curves, the growth rate was calculated from the
titration rate at the final stage of operation. The crystal growth rates of calcium sulfite
hemihydrate crystals were found to obey the parabolic rate law in the low supersaturation range. Another point to be noted is that the precipitates of calcium sulfite hemihydrate in agitated suspensions have a tendency to form agglomerates. It was found that the degree of agglomeration
is a weak function of relative supersaturation and magma density, while the pH value is a key
factor t h a t affects the degree of agglomeration. Addition of EDTA also has a n effect on the agglomeration of calcium sulfite hemihydrates.
Introduction
Flue gas desulfurization (FGD) processes are most
commonly utilized to remove sulfur dioxide from stack
gases of coal- or oil-fired plants. Many FGD processes, including throwaway processes, gypsum processes, and regenerative processes, have been developed over the last 30 years, and several processes are being used successfully in full scale. In the simple slurry technol-
ogy, SO2 is absorbed by a slurry of limeflimestone to
form calcium sulfite crystals of acicular habit and its
strong agglomeration, requiring large clarifiers and
filters to dewater the sludge to make an acceptable
landfill. On the other hand, the double alkali processes
are being investigated to overcome the scaling, plugging,
erosion, and dewatering problems that have been as- sociated with the 1imeAimestone systems. Besides, high SO2 removal efficiencies and high limeflimestone utili- zations are easily achieved with alkaline sodium scrub- bing solutions by simply adjusting the scrubber oper- ating pH (Valencia, 1982).
In the lime dual-alkali process, the absorption of SO2 with chemical reaction in the scrubber is
Na2S0,
+
SO,+
H 2 0-
2NaHS0,Then, the scrubber solution is pumped into a crystallizer
and reacts with Ca(OH)2 solution transported from a storage tank. The major reaction equation in the crystallizer is
2NaHS0,
+
Ca(OH),-
CaS0,.1/2H20(s)+
3/2H20
+
Na2S03 The clear solution, NaZS03 solution in the crystallizer, is repumped into the scrubber for reusing. The calcium salt of CaS0&2H20(s) was obtained with good settling and filtration characteristics in a pilot scale operation (LaMantia et al., 1975; Satriana, 1981).Crystal morphology and size affect the dewatering process, including sedimentation and filtration, and they
are key factors leading to a successful operation of a
FGD process (Tseng and Rochelle, 1986; Dirksen and Ring, 1991). Crystal morphology could be modified by solution composition, additives, and solution pH, which also influence the crystal growth rate (Dirksen and Ring, 1991; Chen et al., 1992). The dewatering process proceeded more easily for crystals in platelet form as compared with crystals in acicular form (Ottmers, 1974; Phillips, 1978).
Agglomeration complicates the analysis of crystal size
distribution (CSD) when using the batch and MSMPR
crystallizer data. Several methods were proposed to
investigate the effect of agglomeration on the CSD, such
as agglomeration kernel functions (Beckman and Farmer,
1987; Hostomsky and Jones, 1991; Tavare and Garside,
1993) and the degree of agglomeration (Budz et al.,
1986; Sohnel and Mullin, 1992; Tai and Chen, 1994).
In those studies, they found that the degree of ag-
glomeration was a function of relative supersaturation,
stirring speed, and solid concentration. In order to
characterize the changes in CSD, the parameters, such
as the total number of crystals, Nt, the number of large
crystals greater than some arbitrary size,
LO,
and themass-weighted average size, L4,3, are utilized to quantify
the degree of agglomeration (Hark1 et al., 1986). When the agglomeration occurs, a decrease in the total number of particles, an increase in the number of large particles, and hence an increase in the mass-weighted average size would be observed.
To study the crystal growth of sparingly soluble salts, such as calcium sulfide hemihydrate and calcium car- bonate, unseeded experiments (Klepetsanis and Kout- soukos, 1989; Kralj et al., 1990) and seeded experiments (Christoffersen and Christoffersen, 1990; Tai et al., 1993) have been applied. In these experiments, the pH- stat apparatus is most commonly employed (Tseng and Rochelle, 1986; Christoffersen and Christoffersen, 1990; Tai et al., 1993). From the titration curve (Klepetsanis
Ind. Eng. Chem. Res., Vol. 34, No. 4, 1995 1343
Figure 1. pH-stat semibatch crystallization system: 1, pH and temperature indicator; 2, reagent bottle; 3, pumping system of reagent; 4, reagent deliver line; 5 , burette; 6, thermometer; 7, water bath; 8, crystallizer; 9, temperature controller; 10, motor; 11, glass electrode; 12, reference electrode; 13, thermocompensator; 14, axial-flow impeller; 15, rotameter; 16, sparging tube.
and Koutsoukos, 1989; Tai et al., 1993) and the concen- tration-time curve (Kazmlerczak et al., 19821, the growth rates can be calculated.
The aim of this work was t o search for the operating
conditions that would form the platelet crystals of
calcium sulfite hemihydrate and to determine the
growth mechanism of platelet CaSO&H20 using a pH-
stat apparatus. The Ca(OH)flaHSOdH20 reacting system was performed without seeding. The crystal- lization process began with an increase of primary nuclei followed by crystal growth. The growth rate of calcium sulfite hemihydrate was calculated from the titration curves using the method proposed in this work.
In addition, the degree of agglomeration of calcium
sulfite hemihydrate crystals was assessed and cor-
related with operating variables in order to have a
better understanding of the agglomeration mechanism.
Experimental Apparatus and Procedure
The crystallization system of the semibatch study of
calcium sulfite hemihydrate is shown in Figure 1. The acrylic plastic crystallizer was placed in a thermostated water bath at 25 "C. The diameter and height of the crystallizer are 120 and 140 mm, respectively. The
crystallizer is baMed with four longitudinal baffles, of
which the thickness is 10 mm each, at 90" spacing. The diameter of the stirrer, an axial-flow glass-made agita-
tor, is 50 mm. The stirring rate was set a t 400 rpm to
suspend, the crystals. One liter of supersaturated
solution of calcium sulfite was prepared by adding
calcium hydroxide solution to the sodium bisulfite
solution already in the crystallizer. Before operation,
the electrodes were standardized with buffers of pH 4.01
and 6.86, respectively. Subsequently, the solution was
adjusted to a desired pH value by adding 0.1 M NaOH
or 0.1 M HC1 solution. All the chemicals were extra pure reagent grade from Kokusan Chemical Works.
Nucleation was initiated by the introduction of a known
amount of titrant into the supersaturated solution, and the crystallization process changed t o crystal growth at the latter stage of operation. The pH was kept constant during operation using a pH-stat apparatus (Kyoto
Electronic AT 200) to control the amount of calcium
hydroxide solution added into the crystallizer. In order to prevent the oxidation of sulfite ion in the solution, sparging of nitrogen was continued during the precipi- tation operation. The operating variables were pH, solution concentration, and concentration of EDTA. To
Table 1. Operating Conditions and Crystal Properties in the Crystallization of Calcium Sulfite Hemihydrate Crvstals
Operating Conditions total sulfite concentration 40-80 mM total calcium concentration 2.80-3.75 mM concentration of EDTA 0-2.45 mM
temperature 25 "C
agitation rate 400 rpm
operating time 120-130 min
crystal habit platelet
crystal system orthorhombic
main peak strength
crystal density 1390 kg/m3
mass weight mean size BET specific surface area (SSA)
a t initial stage (TSO) a t initial stage (TCA)
pH range 5.8-6.8
Crystal Properties
2.62, 3.16, 3.81, 5.35, 5.56A 33.86-68.34 pm
0.32-1.40 m2/g
simulate the industrial scrubbing liquor composition
(LaMantia et al., 19751, the concentration of total sulfite
was kept in large excess. In addition, the operating pH
range, from 5.80 t o 6.80, was similar to that of the
scrubbing solution. All the operating conditions were listed in Table 1.
At the end of operation, the slurry was filtered and the solids were dried in an oven a t 110 "C for at least 1 h. Particle morphology and solid composition were examined by SEM, IR spectroscopy, and X-ray powder diffraction. In addition, particle size distribution was analyzed by the Microtrac sizer. The calcium ion concentration was determined by EDTA potentiometric titration using a combined F-2002 calcium ion selective
electrode and a K-401 reference electrode connected to
a PHM 82 digital pH meter, all from the Radiometer
Co. The specific surface area of the grown crystals was determined by the multiple-point BET technique (Mi- cromeritics, 2100D). Besides, the titration curve ob-
tained automatically at the latter stage of operation was
employed to calculate the crystal growth rates.
Determination of Relative Supersaturation and Crystal Growth Rate
Toft (1984) is given by
1344 Ind. Eng. Chem. Res., Vol. 34, No. 4, 1995
Table 2. Equilibrium Equations and.Stability Constants for the Ca(OH)2/NaHSOs System at 25 "C (Lowell, 1970)
Mass Balance Equations
TCA = [Ca2+]
+
[CaOH']+
[CaSO,'] (2) TSO = [H,SO,l+
[HSO,-l+
+
[CaSO;] (3)TNA = [Na']
+
[NaOH] (4)TCI = [Cl-] ( 5 )
Mass Action Equations
pK, = -logy,' [H+l[OH-I = 14.00 ( 6 )
pKz = -log (yl'[H+l[HS03-l) y,[H,SO,] = 1.88
pK3 = -log ~ ' [ ~ ~= ~7.21 ~ ~ - ' ) = 3.39 = 1.37 pK, = -log pK5 = -log (y&a2'l[OH-l) [CaOH'l
pK6 = -log (y12[Na+l[OH-l) y,[NaOHl = -0.57
(7)
pKsp = - l ~ g ( r ~ [ C a ~ + l [ S O , ~ - I ) = 6.61 (12)"
a The value was calculated from the data that were reported
where IP = (Ca2+)(S032-) and Ksp is the solubility
product. Using mass action equations, which are pre- sented in Table 2, and mass balance equations, the
concentrations of all species in solution were computed
from the measured pH, total calcium concentration, total sulfite concentration, and total sodium concentra- tion by successively approximating the ionic strength (Nancollas, 1966). The ionic activity coefficients were estimated from the modified Debye-Huckel equation:
by Brewer (1982) in Flue Gas Desulfurization.
(13)
logy, =
-AZ2(-)
f i
- 0.31l + f i
where yz is the activity coefficient of the ion with charge
z and A is a constant.
The growth rate of Cas03 can be expressed as the
consumption rate of total sulfite concentration (TSO):
J
d[TSOl V dt --=--
d[CaSO:l+ d[H2S031 d[HS03-l + + dt - dt dt d[S032-l dt (14)where J and V are molar growth rate and solution
volume, respectively. Because the change of total sulfite
concentration in the crystallizer is equal to the con- sumption of calcium concentration in the burette of the pH-stat apparatus and the total concentration of calcium ion in the crystallizer, the material balance
on the total calcium ion is
d[CaSO&)I dt (15)
Because the growth rate d[CaS03(s)l/dt is equal to the
consumption rate of TSO, i.e. d[TSOYdt, the molar
growth rate can be derived (see Appendix)
(16)
and the growth rate per unit crystal surface area is defined as
(17)
where f is a constant and is calculated from the
concentration of ion species using eq A-19,
cb
is theconcentration of titrant, and dVddt is the titration rate,
which is the slope of the titration curve. In addition,
Mt and SSA are magma density and the corresponding
specific surface area of crystals, respectively.
Results and Discussion
Solid Composition of Platelet Crystals. Twenty- one runs were conducted in this work. The precipitate produced a t given conditions was examined by IR spectroscopy and X-ray powder diffraction. In all runs, the IR spectra showed that the major band appeared at 990 cm-' which is a standard peak (Vandeberg, 1983)
for calcium sulfite hemihydrate. No trace of calcium
sulfate was found in this work. The X-ray diffraction pattern has also demonstrated that calcium sulfite hemihydrate was the only crystal present in the system
throughout the experiments. A typical spectrum of an
X-ray pattern is shown in Figure 2. The main peaks as indicated are close to the standard values for calcium sulfite hemihydrate (McClune, 1983).
The SEM photographs show that the crystals are
platelets and their agglomerates, which are presented
in Figure 3, in all runs. The platelet form of calcium
sulfite hemihydrate crystal was found in a supersatu- rated solution in which the total sulfite concentration
ranges from 40 t o 80 mM and the pH values were in
the range of 5.8-6.8. The result is similar to that
reported by Tseng and Rochelle (1986) where the morphology of calcium sulfite hemihydrate is a spherical agglomerate of thick platelet from a different reaction system, CaCldNazSOflz0, in the absence of sulfate.
Titration Curves and Induction Period. Upon mixing of the calcium hydroxide solution with the sodium bisulfite solution, the precipitation process
started within 20 min for most runs. As shown in
Figure 4, which shows the titration curves, the induction time varied from run t o run, about 8 min for runs 7 and
5 but no appreciable induction time for run 14. The
difference was caused by the starting supersaturation, which is higher for run 14. Such a result has been suggested by Mullin (1972). The titration curves for all
runs can be divided into two regions as indicated in
Figure 4, a faster titration rate followed by a slower one. The steep slope of the titration curve in the first region indicated the occurrence of spontaneous nucleation,
Ind. Eng. Chem. Res., Vol. 34, No. 4, 1995 1345
6 00
500
4
00
Y CJaJ
a;
2 0 0
1 0 0
0
I
N bo 4 -io
- 2
10
20
30
40
Diffraction angle,
28
Figure 2. X-ray powder diffraction pattern of calcium sulfite hemihydrate crystals for run 2.
( C )
(a) (b)
Figure 3. SEM photographs of calcium sulfite hemihydrate crystals: (a) a mixture of platelets and agglomerates, (b) platelet crystal,
and (c) agglomerate crystal.
which was similar to that reported by Klepetsanis and The amount of titration volume a t the first region
Koutsoukos (1989) for the precipitation of calcium within 30 min for run 14 was higher than that for runs
sulfate dihydrate and Frhche and Heughebaert (1989) 5 and 7. The possible reason was that a large amount
for calcium phosphate precipitation. The spontaneous of nuclei was induced immediately for run 14 a t a high
nucleation stopped until the relative supersaturation supersaturation level (ai = 1.36) and the pH became
became a lower value where the crystal growth was lower due t o the consumption of reactants. Therefore,
prevailing. The primary nuclei produced in the crys- a compensation of more basic solution (titrant, Ca(OH)2
tallizer were utilized as the seed crystals for further solution) by the autotitrator was required to keep the
1346 Ind. Eng. Chem. Res., Vol. 34, No. 4, 1995 E c 5 0 . 0 2 5 6o
-
R u n n o . 5 a A A Run no. 7 , 0 ~ 0 . 8 8 0 0 0 R u n no. 5 , 0 ~ 0 . 9 9 o o o Run n o . 1 4 , D z 1 . 3 6 h AE
-
4 0 - c 8 ce
-
c '2 3 0 - \c 0 0 0 30 60 90 120 150 T i me (min)
Figure 4. Titration curves of Ca(OH)2 a t different pH levels: curve A, pH = 6.20; curve B, pH = 6.50; and curve C, pH = 6.80.
other hand, fewer nuclei were induced at moderate
supersaturation for runs 5 and 7.
As a result, the consumptions of basic solution for the
two runs were smaller than that for run 14, but it was
enough to keep the pH constant. The second region of
the titration curves with a slower titration rate, which
is probably due to crystal growth, begins a t 30,70, and
80 min for runs 14, 5, and
7,
respectively. The crystalgrowth process occurred at an early stage of operation
for
run
14 because excess nuclei with large surface areaswere induced to reduce the supersaturation to a lower
level, which was unable to cause nucleation. The final supersaturation was 0.05,0.34, and 0.46 for runs 14,5,
and
7,
respectively.Crystal Size Distribution
and Degree
of Ag-glomeration. The crystal size distribution data de- termined by the Microtrac particle size analyzer on the
volume basis were converted to weight intensities as
shown in Figures 5 and 6. A bimodal distribution was
observed at the final stage of operation. The first population peak appeared between 0 and 20 pm, while the size range of the second population peak was between 20 and 100 pm. Under different pH values and
EDTA concentrations, the change of CSD indicated the
occurrence of agglomeration. Evidence in Figure 3c
shows that the agglomerates are many small platelets growing out from a common center to form a spherelike particle and contain many internal void spaces. How- ever, parts of the agglomerates show multiple platelets growing out from one platelet, but not enough to form a sphere.
The degree of agglomeration can be assessed either in terms of the number-based degree of agglomeration (Budz et al., 1987; Hartel et al., 1986) or in terms of the dominant size of the particles, i.e. the higher the particle size, the higher the agglomeration rate (Budz et al., 1987). The agglomerates of calcium sulfite comprising many platelet crystals were mostly growing out from a common center as shown in Figure 3c. The number of crystals involved in one agglomerate was
-
0.030 E q0.025-
Run n0.3 c-
0.020 : A .L .-g
0.015-
d .E 0.0102
m 0.005-
-
.- 0,3
0.000,- Crystal size( p m )
(a) 0.0301
-
0.020 Run no. 7 - . +.' U .5 0.010E
.- 01 0.005 Q, 40 80 1 v 0.020 '5 0.015 .G 0.010I
m 0.005 c UE
s
0.000.-
0 40 80 120 Crystal size(LG)
(C)Figure 5. Effect of pH on the CSD a t the same concentration level with TSO = 40 mM and TCA = 3.75 mM: (a) run 3 with pH
= 5.80, (b) run 7 with pH = 6.20, and ( c ) run 5 with pH = 6.50.
difficult to estimate. Therefore, instead of the number-
based degree of agglomeration, the mass-based degree of agglomeration was utilized, which is defined as
weight of particles larger than 16 p m
P =
weight of product (18)The particle size larger than 16 pm was considered as agglomerate because the weight intensity was the
lowest around 16 pm in most of the cases in Figures 5
and 6. Meanwhile, the mean size, L4,3, was also used
to assess the degree of agglomeration as adopted by Budz et al. (1987) and Hartel et al. (1986). It was inferred that the degree of agglomeration was a function
of magma density, Mt, initial relative supersaturation,
ai, and pH value. From the data of
CSDs,
P and L4,3were calculated and are listed in Table 3. Values of L?,3
Ind. Eng. Chem. Res., Vol. 34, No. 4, 1995 1347 *0.025 0.020 c v c
.-
2
0.01 5 Run no. 13 Crystal size (pm) (a)2
0.030I
Crystal size( p m )
( b ) Crystal size(pm)
( 4
Figure 6. Influence of EDTA on the CSD a t pH = 6.80 and the same concentration with TSO = 40 mM and TCA = 3.75 mM: (a) run 13 with EDTA = 0 mM, (b) run 17 with EDTA = 1.50 mM, (c) run 18 with EDTA = 2.45 mM.
work. When agglomeration occurs, a decrease in the
total number of particles, N , and a n increase in the
number of large particles would be observed, while the
mass-weighted average size, L 4 , 3 , would be increased
with an increase in the number of large particles. Thus,
a smaller N or a larger L 4 , 3 indicates a strong ag-
glomeration behavior in the crystallization process.
A multiple linear regression analysis from the ag-
glomeration data gave the following correlations:
P = 0.6755ai0,0634Mto.0515 exp[0.0548 pH] (19)
and
L4,3
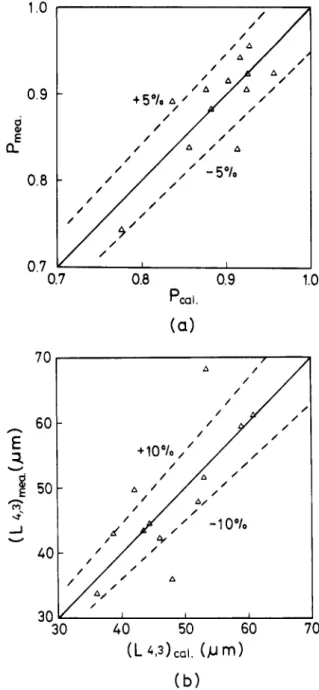
= 4.84960~.0695M~0453 exp[0.3746 pH1 (20)The measured values, I'm,, and ( L 4 , 3 ) m e a , are compared
with the calculated values,
Peal
and ( L 4 , 3 ) c a l , as shown1
.o
0.9
f
a
0.8
n 7 -..0.7
0.8
0.9
1.0 Pca I.(a)
7060
nE
2
U$
50 n 23
v 4c30
40 5060
70
(L
4,3)ca1.(N
m )
( b )
Figure 7. Calculated values vs measured values for P and L4,3
(a) using eq 19 for P and (b) using eq 20 for L4,3.
in Figure 7; most data points fall within f 1 0 % of the calculated values. The low values of the parameters in
these correlations show that the influence of supersatu-
ration and magma density on the degree of agglomera- tion is not great. This can be explained as follows. In the ranges of operating conditions, the changes in and Mt0.0453 are 1.05 for the former and 1.10 for the latter, while the changes in exp[0.0548 pH1 and exp-
L0.3746 pH1 are 1.06 and 1.45 for P and L 4 , 3 , respec-
tively. This indicated that the effects of ai and Mt on
the degree of agglomeration are not significant. On the other hand, the pH value is the most sensitive factor affecting the degree of agglomeration during the pre-
cipitation.
As
shown in Figure 5, the CSD was afunction of pH a t the same solution concentration. It
was found that the bimodal CSD was significant and
disappeared gradually when the solution pH increased. In addition, the weight intensity of the large crystal size
was also increased with increasing solution pH.
This
was caused by agglomeration. The dependence of agglomeration on pH is probably due to the change of
1348 Ind. Eng. Chem. Res., Vol. 34, No. 4, 1995
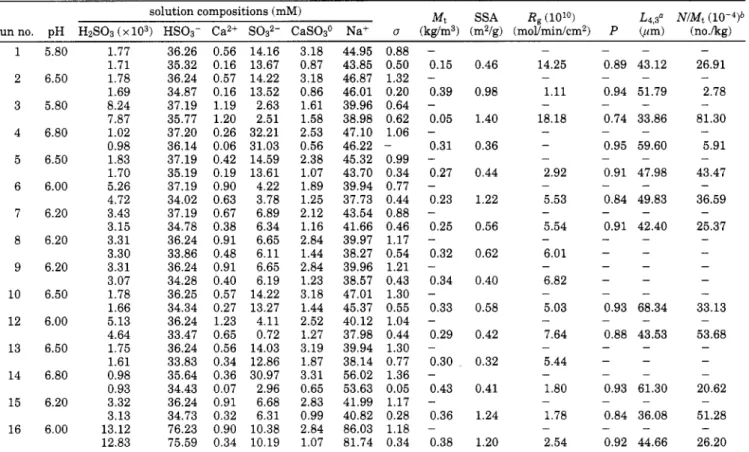
Table 3. Operating Variables, Growth Rates, and Agglomeration Parameters of Calcium Hemihydrate Crystals at Initial and Final Stages
80 1 2 3 4 5 6 7 8 9 10 12 13 14 15 16
-
\"
- 0.46 14.25 0.98 1.11 1.40 18.18 0.36 0.44 2.92 1.22 5.53 0.56 5.54 0.62 6.01 0.40 6.82 0.58 5.03 0.42 7.64 0.32 5.44 0.41 1.80 1.24 1.78 1.20 2.54 - - - - - - - - - - - - - - - - - 0.89 43.12 0.94 51.79 0.74 33.86 0.95 59.60 0.91 47.98 0.84 49.83 0.91 42.40 - - - - - - - - - - - - - - - - - - - - - - 0.93 68.34 0.88 43.53 - - - - - - - - 0.93 61.30 0.84 36.08 0.92 44.66 - - - - - 26.91 2.78 81.30 5.91 43.47 36.59 25.37 --
- - - - - - - - - 33.13 53.68 - - - - 20.62 51.28 26.20 - - ~~~ ~ Mt SSA Rg(10") ~ ~ N I M ~ , ~( 1 0 - 4 ) b a solution compositions (mM)runno. pH HzS03(x103) HS03- Ca2+ s03'- CaS03O Na+ u (kg/m3) (m2/g) (moL"idcm2) P @m) (no./kg) 5.80 1.77 36.26 0.56 14.16 3.18 44.95 0.88 - 1.71 6.50 1.78 1.69 5.80 8.24 7.87 6.80 1.02 0.98 6.50 1.83 1.70 6.00 5.26 4.72 6.20 3.43 3.15 6.20 3.31 3.30 6.20 3.31 3.07 6.50 1.78 1.66 6.00 5.13 4.64 6.50 1.75 1.61 6.80 0.98 0.93 6.20 3.32 3.13 6.00 13.12 12.83 35.32 36.24 34.87 37.19 35.77 37.20 36.14 37.19 35.19 37.19 34.02 37.19 34.78 36.24 33.86 36.24 34.28 36.25 34.34 36.24 33.47 36.24 33.83 35.64 34.43 36.24 34.73 76.23 75.59 0.16 0.57 0.16 1.19 1.20 0.26 0.06 0.42 0.19 0.90 0.63 0.67 0.38 0.91 0.48 0.91 0.40 0.57 0.27 1.23 0.65 0.56 0.34 0.36 0.07 0.91 0.32 0.90 0.34 13.67 14.22 13.52 2.63 2.51 32.21 31.03 14.59 13.61 4.22 3.78 6.89 6.34 6.65 6.11 6.65 6.19 14.22 13.27 4.11 0.72 14.03 12.86 30.97 2.96 6.68 6.31 10.38 10.19 0.87 3.18 0.86 1.61 1.58 2.53 0.56 2.38 1.07 1.89 1.25 2.12 1.16 2.84 1.44 2.84 1.23 3.18 1.44 2.52 1.27 3.19 1.87 3.31 0.65 2.83 0.99 2.84 1.07 43.85 46.87 46.01 39.96 38.98 47.10 46.22 45.32 43.70 39.94 37.73 43.54 41.66 39.97 38.27 39.96 38.57 47.01 45.37 40.12 37.98 39.94 38.14 56.02 53.63 41.99 40.82 86.03 81.74 0.50 0.15 1.32 - 0.20 0.39 0.64 - 0.62 0.05 1.06 - 0.31 0.99 - 0.34 0.27 0.77 - 0.44 0.23 0.88 - 0.46 0.25 1.17 - 0.54 0.32 1.21 - 0.43 0.34 1.30 - 0.55 0.33 1.04 - 0.44 0.29 1.30 - 0.77 0.30 1.36 - 0.05 0.43 1.17 - 0.28 0.36 1.18 - 0.34 0.38 -
a L 4 , 3 = JzL4n(L) dL/GL3n(L) dL which was evaluated by the numerical integration. N = J;n(L) dL which was evaluated by the numerical integration.
electrical charge on the crystal surface. At higher pH,
more HS03- ions are shifted t o
sCh2-,
thus giving ahigher relative supersaturation and reducing the amount
of HSO3- adsorbed on the crystal surface. The solutes
higher in supersaturation would induce more nuclei
which would give the ions more chances t o collide with
each other. Subsequently, the collision between crystals may begin t o create agglomerates, thus yielding more large agglomerates, because the electrical charge is neutralized with a decrease in calcium ion. Further evidence about the degree of agglomeration is that the L4,3, mass weight mean size, increased with decreasing NIMt, particle numbers per unit product of solid, as shown in Figure 8. The small particle numbers with a
large mean particle size, L4,3, were due to the ag-
glomeration of crystals (Hartel et al., 1986; Budz et al., 1987).
The addition of EDTA was found to be a factor that
influenced the CSD. Figure 6 illustrates the effect of
EDTA on the CSD at the same pH and initial solution concentration. A bimodal CSD was observed as the
concentration of EDTA increased. On the other hand,
the ratio NIMt increased with increasing EDTA as indicated in Figure 9. This evidence shows that the degree of agglomeration is attenuated by the addition of EDTA. Theoretically, one EDTA molecule chelates one calcium ion to reduce the free calcium ion in the
solution and thus to decrease the supersaturation.
Another possible reason is that the adsorption of anionic ion (EDTA) on the positively charged surfaces of calcium sulfite crystals affects the electrical potential of the salt nuclei. Once the nuclei are brought into contact by collision, the adsorbed EDTA might reduce the ag- glomeration rate by altering the electrical double layer (Dirksen and Ring, 1991).
n Y CSI \ 0 C v n
7
0-
W cz
\ Z 7 0 1\
70-
60
-
50-
4 0-
30-
2 0-
1 0 - 0 0 I I I 1 20 30 40 50 60 70 I 3 L4,3 (" Figure 8. Plot of NIMt vs L4,3. .Growth Rate of Calcium Sulfite Hemihydrate.
The growth rates of calcium sulfite hemihydrate crystals
were calculated from the titration curves, by example,
shown in Figure 4. The titration curves in Figure 4 are
almost linear in the second region. The slopes obtained
for curves A, B, and C in the second region are 0.075,
0.036, and 0.034 mumin, respectively. These values
together with the values off and c b can be utilized to
calculate the molar growth rates using eq 16. Then, the molar growth rates of crystals per unit surface area of crystals, calculated by eq 17, are summarized in Table
Ind. Eng. Chem. Res., Vol. 34, No. 4,1995 1349 VzH20 at low supersaturation obeyed the parabolic rate
law, which is the same as that of many sparingly soluble
substances, including calcium carbonate, gypsum, cal- cium fluorite, and barium sulfate (Nielsen, 1984). A different result was reported by Ottmers (1974) and Phillips (1978) who found that the linear rate law was
observed for the crystal growth of CaSO&HzO. The
BCF theory states that the linear rate law occurs at higher relative supersaturation, while the parabolic rate
law occurs in most cases of lower relative supersatura-
tion. The different rate laws obtained in this work and
others may be due to different techniques and reactants
utilized in the experiments to determine the growth rate
data. 1 00
1
1
90
nz
80 70 \ 0 C-
60 OY-
s
c v \z
/
O//6
/
01 1 I 1 I IConc.
of EDTA (mM)
0.00.5
1.0 1.5' 2.0 2.53.0
Figure 9. Effect of EDTA on the degree of agglomeration: 0 , TSO
= 80 mM and TCA = 3.75 mM; 0 , TSO = 40 mM and TCA = 3.75
mM. -7.0
-8.0
am
-9.0 0-
-1 0.0 - 1 1.o
-
This work 0oono Tseng & Rochelle (1986)
0 0
0
8 -0.6
-0.4 -0.2 0.0 0.2log
OfFigure 10. Overall growth rate of calcium sulfite hemihydrate crystals at 25 "C: A, this work; 0, recalculated data from Figure
6 of Tseng and Rochelle (1986).
3. For sparingly soluble salts, the growth rate is usually
expressed as follows:
R,
=kS
(21)Generally, the growth data of calcium sulfite hemihy-
drate crystals are plotted as In R, vs In a. In order to
compare the data obtained from Tseng and Rochelle (19861, recalculation of supersaturation is required. The growth rate data of both works were plotted in Figure
10. In the supersaturation range under investigation,
a between 0.05 and 0.77, the linear plot gave n = 2.26
and lz = 3.68 x moVmin cm2. The data are quite
close to the values reported by Tseng and Rochelle (1986) in the low supersaturation range, where it obeys a parabolic rate law. The growth mechanism of CaS03.
Conclusion
The semibatch precipitation of calcium sulfite hemi-
hydrate from aqueous solution is successfully conducted
in a pH-stat apparatus t o study the degree of ag-
glomeration and crystal growth of calcium sulfite hemi- hydrate. The precipitates were platelets and their
agglomerates in all runs under the operating conditions
listed in Table 1. The crystal growth kinetics was found
to obey the parabolic rate law, in agreement with BCF
theory at lower relative supersaturation. The effect of relative supersaturation and magma density on the degree of agglomeration is not significant at the final stage of operation, while the pH factor has a significant
effect. Besides, the addition of EDTA is also a factor
that affects the degree of agglomeration.
Nomenclature
A = area, m2
cb
= concentration of Ca(OH)2 added from burette,f = constant in eq 16
fi
= constant defined in Appendix AI = ionic strength, kmoVm3
IP = ionic product
J = molar growth rate, mol/min
lz = growth rate constant, mol/min cm2
Ki = stability constant in Table 2
Ksp = solubility product
L4,3 = mass weight mean size, pm
Mt = magma density, kg/m3
n = population density, no./pm m3
nb = molar number of Ca(OH)2 added from burette,
N = total particle numbers, n0./m3
R,
= growth rate per unit area, mol/min cm2SSA = specific surface area, m2/g
TCA = total calcium ion concentration, kmol/m3
TCI = total chloride ion concentration, km01/m3
TNA = total sodium ion concentration, km01/m3
TSO = total sulfite ion concentration, km01/m3
t = time, min
V = volume of solution, m3
VI, = volume of Ca(OH)2 added from burette, mL
yz = activity coefficient of an ion with charge 2
2 = charge number
km01/m3
mol
Appendix A
Derivation of Eq 17 for Estimating Crystal Growth Rate. From eqs 7-9 in Table 2, the following
1360 Ind. Eng. Chem. Res., Vol. 34, No. 4, 1995 relationships are obtained:
2 [ ~ a 2 + ~ [ ~ ~ : - ~
[ C ~ S O ~ ~ I = y2 (A-3)
KO0
We substitute the above equations into eq 3 to give
where
and
The growth rate of calcium sulfite hemihydrate is equal
to the consumption of
TSO:
d[CaS03(s)l
-
d[TSO] dt dt d[CaSO,'] + d[HzS031 d[HS03-l+
-
+ dt - dt dtEquation A-7 is substituted into eq 15 to give
-
1 dn,
-
d[Ca2+] d[CaSO:l d[CaOH+lV
dt dt + dt + dt From eq 10, we have [Cazfl[OH-1+
-yz (A-9) [CaOH1 -
K5Then, [CaS03°1, [S032-l, [H2S031, and [CaOH+l in eq
A-8 were eliminated by using eqs A-1-A-3 and A-9. The
resultant equation is
1 dn, dLHSO3-I d[Ca2+l (A-10)
V dt = f 3 dt
+
f 4 3 -Y12rH+l
2[CaZ+b,2) (A-ll)f 3 =
(
1+-KO0 KO0
and
The electroneutrality of nonreacting components in the crystallizer is
d[S03'-1 d[HSOJ d[CaZf] + d[CaOH+]
dt
+
dt dt dtWhen eqs A-2 and A-9 are substituted into eq A-13, the following relationship is obtained:
= 2 -(A-13) (A-14) d[HSO,-I d[CaZf] dt = f 5 7 where
Substituting eq A-14 into eqs A-4 and A-10 to eliminate
d[HSOs-Ydt, we obtain the following equations:
and
V
dtCompare eqs A-16 and A-17 to give
dnb
J=f-
dt where f=- flf5+
fz fd5+
f4The molar growth rate per unit area is E = - =
J
f d n b-
g A A d t (A-18) (A-19) (A-20) AppendixB
Calculation of
KP
of CaSO&HzO at 298 K. The solubility product of calcium sulfite hemihydrate crys- tals was obtained from thermal data reported by Brewer. The reaction equation isCaS03~1/2HzO(s)
-
CaZf+
SO3'-+
l/zHzO(l) (B-1)The solubility product was evaluated by the following equation:
In K s p = -AG"IRT = -A(G"
-
H",,,lRT)-
(W298/RT) (B-2) where
Ind. Eng. Chem. Res., Vol. 34, No. 4, 1995 1351
Table B-1. T h e r m a l D a t a Adopted from B r e w e f l
-(Go - p2g8)/RT components -(Go - P 2 4 8 ) / R T (T = 298 K or 25 "C) (M"29dRT) CaSO&zHzO -528.18 Ca2+ -6.75
+
1.0 x 10⁻³t - 2.2 x+
2 x ( t i n "C) -6.24 -219.03 -257.18so32-
H2O 18.025 - 8.867 x 10⁻²T+
2.8856 x 1 0 - 4 p - 8.41 -115.36 22.5 - 6.24 x 10⁻²T+
1.53 x 10⁻⁴TQ - 1.07 x l O - ' F ( T i n K) -4.4+
1.18 x 10⁻²t - 1.98 x 10⁻⁴t2+
3.2 x 10⁻⁷t3 ( t in "C) 14.66 -4.22 3.9505 x 1 O - V+
2.08 x 10-loT4 ( T i n K)a In Flue Gas Desulfurization, Chapter 1, ACS Symposium Series 188, edited by Hundson and Rochelle (1982).
where data (Go
-
H02g8)/RT and (AH029$R) were thevalues reported by Brewer as shown in Table B-1.
Therefore, values of -A(Go
-
H0298)/RT and - ( M 0 2 9 $R!!7 were estimated as follows:
-A[(@
-
W2,,)/RT] = -6.24-
4.22+
1/2(8.41)-
14.66 = -20.92 and -(AHO2g8IRT) = -219.03-
257.18-
'/2(115.36)+
528.18 = -5.71Substituting the two values into eq B-2, the Ksp was
obtained:
Ksp
= 2.47 x at 298K
Literature Cited
Beckman, J. R.; Farmer, R. W. Bimodal CSD Barite Due t o Agglomeration in a n MSMPR Crystallizer. AZChE Symp. Ser.
1987, 83 (2531, 85-94.
Brewer, L. Thermodynamic Values for Desulfurization Processes.
Flue Gas Desulfurization; Hudson, J. L., Rochelle, G. T., Eds.;
ACS Symmsium Series 188; American Chemical Society: Wash- ington; DC, 1982; pp 1-30:
Budz. J.: Jones. A. G.: Mullin. J. W. Effect of Selected ImDurities on'the Continuous 'Precipitation of Calcium Sulfate (Ghsum).
J . Chem. Technol. Biotechnol. 1986, 36, 153-161.
Budz, J.; Jones, A. G.; Mullin, J. W. Agglomeration of Potassium Sulfate Crystals in an MSMPR Crystallizer. AZChE Symp. Ser.
Chen, P. C.; Tai, C. Y.; Shih, S. M. Control of Crystal Habit and Particle Morphology of Calcium Sulfite Hemihydrate Crystals.
J . Cryst. Growth 1992, 123, 277-286.
Christoffersen, J.; Christoffersen, M. R. Kinetics of Spiral Growth of Calcite Crystals and Determination of the Absolute Rate Constant. J . Cryst. Growth 1990, 100, 203-211.
Dirksen, J . A,; Ring, T. A. Fundamentals of Crystallization: Kinetic Effects on Particle Size Distributions and Morphology.
Chem. Eng. Sci. 1991,46,2389-2427.
FrBche, M.; Heughebaert, J. C. Calcium Phosphate Precipitation in The 60-80 "C Range. J. Cryst. Growth 1989, 94, 947-
954.
Hartel, R. W.; Gottung, B. E.; Randolph, A. D.; Drach, G. W. Mechanisms and Kinetic Modeling of Calcium Oxilate Crystal Aggregation in a Urinelike Liquor. M C h E J . 1986,32, 1176-
1185.
1987, 83 (2531, 78-84.
Hostomsky, J.; Jones, A. G. Calcium Carbonate Crystallization, Agglomeration and Form During Continuous Precipitation from Solution. J. Phys. D: Appl. Phys. 1991,24, 165-170.
Kazmlerczak, T. F.; Tomson, M. B.; Nancollas, G. H. Crystal Growth of Calcium Carbonate. A Controlled Composition Kinetic Study. J . Phys. Chem. 1982,86, 103-107.
Klepetsanis, P. G.; Koutsoukos, P. G. Precipitation of Calcium Sulfate Dihydrate a t Constant Calcium Activity. J . Cryst. Growth 1989,98,480-486.
Kralj, D.; Brecevic, L.; Nielsen, A. E. Vaterite Growth and Dissolution in Aqueous Solution. I. Kinetic of Crystal Growth.
J . Cryst. Growth 1990, 104, 793-800.
LaMantia, C. R.; Lunt, R. R.; Shah, I. S. Dual Alkali Process for SO2 Control. AZChE Symp. Ser. 1975, 71 (148), 324-330.
McClune, W. F. Powder Difiactwn File Search Manual; Hanawalt
Method Inorganic: International Centre for Diffraction Data, 1983.
Mullin, J. W. Crystallization; Buttenvorth & Co.: London, 1972; Chapter 6.
Nancollas, G. H. Interactions in Electrolyte Solution; Elsevier:
Amsterdam, 1966; Chapter 2.
Nielsen, A. E. Electrolyte Crystal Growth Mechanisms. J . Cryst. Growth 1984, 67, 289-310.
Nielsen, A. E.; Toft, J. M. Electrolyte Crystal Growth Kinetics. J .
Cryst. Growth 1984,67,278-288.
Ottmers, D. A Theoretical and Experimental Study of the Lime/ Limestone Wet Scrubbing Process. EPA Report 650/2-75-006; U S . Government Printing Office: Washington, DC, 1974. Phillips, J. L. Development of a Mathematical Basis for Relating
Sludge Properties to FGD-Scrubber Operating Variables. EPA Report 600/7-78-072; US. Government Printing Office: Wash- ington, DC, 1978.
Satriana, M. New Developments in Flue Gas Desulfurization Technology; Noyes Data Corp.: Park Ridge, NJ, 1981.
Sohnel, 0.; Mullin, J. W. Agglomeration in Batch Precipitated Suspensions. AZChE Symp. Ser. 1992,87 (2841, 182-190.
Tai, C. Y.; Chen, P. C. Nucleation, Agglomeration and Crystal Mor- phology of Calcium Carbonate. AZChE J . 1995, 41, 68-77.
Tai, C. Y.; Chen, P. C.; Shih, S. M. Size-Dependent Growth and Contact Nucleation of Calcite Crystals. AZChE J . 1993, 39,
1472-1482.
Tavare, N. S.; Garside, J. Silica Precipitation in a Semi-batch Crystallizer. Chem. Eng. Sci. 1993, 48, 475-488.
Tseng, P. C.; Rochelle, G. T. Calcium Sulfite Hemihydrate: Crystal Growth Rate and Crystal Habit. Environ. Prog. 1986,5,5-11.
Valencia, J. A. The Limestone Dual Alkali Process for Flue Gas Desulfurization. ACS Symp. Ser. 1982, 188, 325-347.
Vandeberg, J. T. An Infrared Spectroscopy ATLAS for the Coatings
Industry; Federation of Societies for Coatings Technology:
Philadelphia, PA, 1983.
Received for review March 28, 1994
Revised manuscript received December 30, 1994 Accepted J a n u a r y 13, 1995@
IE940207Z @ Abstract published i n Advance A C S Abstracts, March 15, 1995.