A Rule Discovery Comparison of Stastics to Induction: KENDALL's vs. ID3 in the Dermatology and Liver Disorder DIAGNOSIS DOMAIN
5
0
0
全文
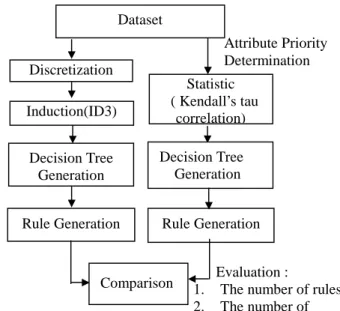
(2) coefficient to use in a study but are unaware of the strengths and weakness of the alternative correlation measures when using statistical analysis on the selection of attributes. They compare Pearson, Spearman and Kendall’s correlation coefficient using a large sample of subjects with schizophrenia spectrum disorders who were evaluated with 7 different psychiatric rating scales. The result suggests that Kendall’s tau has many advantages over Pearson’s and Spearman’s. Moreover, Rudolfer et al. [5] compare and contrast two types of model-logistic regression and decision tree induction for the diagnosis of carpal tunnel syndrome using four ordered classification categories. Result shows that there is no significant difference between the two methods. Further to this investigation, it presents a detailed comparison of the structure of bivariate versions of the models. The result indicates that the classification accuracy of the bivariate model is slightly higher than that of the multivariate ones. Although these approaches based on induction and statistics were proposed, most of them focused on providing a way to solve the problems in data mining instead of discussing effectiveness. In fact, not only the capability but effectiveness also plays an important role in the process of rule generation. In this research, we compare ID3, a methodology in induction domain [6] with Kendall’s tau correlation, a methodology in statistics domain [4] as to their effectiveness in the process of rule generation. For consistency, the continuous data is converted into discrete data with fuzzy membership function while applying ID3 to generate rules. The datasets include a set of real diagnosis records in the domain of dermatology and liver disorder. And the criterion used to evaluate these two methods is the number of rules and the number of levels generated. This paper is organized as follows. In section 2, the research framework and methodology are described in detail. The results of comparison are expressed in section 3. The conclusion is made and future work is proposed in final section. 2. Research Framework Although several methods that based on induction, statistics, etc. were proposed in the past, the comparison of effectiveness was always ignored. In this research we take two methods, one based on induction and another based on statistics, to compare their effectiveness of rule generation. First, we choose the methods to be the targets of comparison. One method we choose is ID3, an induction-based technique and another one is Kendall’s tau correlation, a statistics-based technique. Before the decision tree is generated, the root has to be decided. The ID3 chooses the attribute which gains maximum entropy as the root. On the other hand, the Kendall’s tau correlation chooses the attribute which has maximum correlation coefficient as the root. Because of the restriction of ID3, the trained dataset must be discrete. Consequently, the attributes are supposed to be converted into discrete if they are continuous. After generating the decision tree, we can compare the results get from the above two different ways. according to their evaluation criterion: the number of rules and the number of attributes used. The whole process about this research architecture is described as Figure 1. Dataset Attribute Priority Determination. Discretization Induction(ID3) Decision Tree Generation Rule Generation. Statistic ( Kendall’s tau correlation) Decision Tree Generation Rule Generation. Comparison. 1. 2.. Evaluation : The number of rules The number of. Figure 1: The research architecture 2.1 ID3 Quinlan [6] presents an ID3 (Interactive Dichotomizer 3) algorithm to help generating decision tree as a mechanism of knowledge discovery. The ID3 algorithm is a data-driven approach that uses top-down induction technique to generate its decision tree. ID3 algorithm basically adopts the information theory to determine the nodes of the decision tree. That is, the position of each node is determined by the gained entropy. It resolves the problems of selecting the attributes as the nodes of the decision tree. 2.2 Kendall’s tau correlation coefficient In Kendall’s tau correlation, a nonparametric measure of association for ordinal or ranked variables that take ties into account [4]. The sign of the coefficient indicates the direction of the relationship, and its absolute value indicates the strength, with larger absolute values indicating stronger relationships. Possible values range from -1 to 1, but a value of -1 or +1 can only be obtained from square tables. 2.3 Membership function The data used in ID3 must be discrete so that data conversion is needed when the data is numeric. In this research, the technique of triangle membership functions with three levels is used in converting data. First, the maximum value and the minimum value of the attribute have to been found out. Then, the triangle membership functions are determined according to the level number. Once the membership functions are decided, every value on the function will reflect the probability from zero to one. For example, a membership functions defined for an 2.
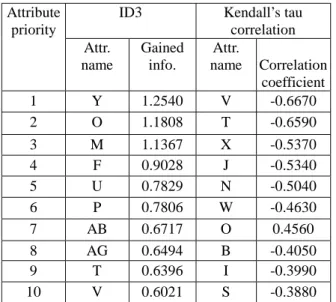
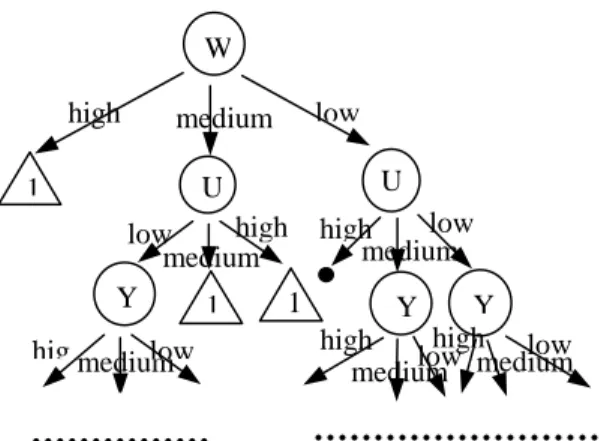
(3) attribute “Age” illustrated in Figure 2. The maximum and minimum values from the observed values are 75 and 0. Therefore, each linear equation can be determined via two points. The observed numeric data can be then converted to the corresponding level with the probability of the event happens. Table 1 shows the discrete level and its probability that get from the equation line. If the patient is 30 years old, he will be viewed as “medium” with probability 0.7. After the conversion, all the data will be processed with ID3 algorithm, the root of decision tree will first be selected according to the maximum entropy. All the decending node of the tree will then be determined.. include Dermatology [7] and Bupa [7]. The dermatology dataset exists 34 attributes : 33 of which are linear valued and the rest is nominal. The differential diagnosis of erythemato-squamous diseases is a real problem in dermatology. It contains 366 instances and 6 classes that entail 6 different kinds of dermatology diseases. Another dataset, Bupa, collected from BUPA Medical Research Ltd. It contains seven attributes and five of them are the data of blood tests. In additions, the rest attributes are the number of half-pint equivalents of alcoholic beverages drunk per day and the classification. This dataset contains 345 instances and 2 classes. 3.2. Attribute priority determination. 1 young 0. 0. medium. 18.75 12.5 25. 37.5. old 50. 56.25 75 62.5. Figure 2: Triangle membership Function for Attribute “Age”. Table 1. Different level and its corresponding probability Age (x) 0 ≤ x ≤ 12.5. Probability y= - 0.04 x +1. 12.5 ≤ x ≤ 18.75 y = max (- 0.04 x + 1 , 0.04 x – 0.5) 18.75 ≤ x ≤ 25. y = max (- 0.04 x + 1 , 0.04 x – 0.5). 25≤ x ≤ 37.5. y = 0.04 x - 0.5 ,. 37.5 ≤ x ≤ 50. y = - 0.04 x + 2.5. 50 ≤ x ≤ 56.25. y = max (- 0.04 x + 2.5 , 0.04 x – 2). 56.25 ≤ x ≤ 62.5 y = max (- 0.04 x + 2.5 , 0.04 x – 2) 62.5 ≤ x ≤ 75. y = 0.04 x - 2. 3. Data description and research results For comparing the performance of ID3 and Kendall’s tau correlation, this research choose two databases which contains continuous data. After data conversion with triangle membership function, ID3 chooses the attribute pertaining the most gain entropy as a root. On the other hand, Kendall’s correlation chooses the attribute having the most significant correlation coefficient as the root. After building the decision tree, the comparison will be made according to the number of rules and the number of levels. The databases description and the result will be illustrated in detailed as follows. 3.1 Data description The datasets used to test the performance of mining power. After calculating information gain and pertaining correlation coefficient, we determine the attribute priority. Table 2 shows the attribute priority from ID3 and Kendall’s tau correlation for the dermatology databases. From the left part of the result, we choose the attribute with the highest priority in ID3 as the root of the decision tree. The attribute with second priority is chosen as the determination of level two in the decision tree, etc. Figure 3 shows part of generated decision tree of dermatology with ID3. On the other hand, the highest priority in Kendall’s tau correlation, shown in the upper right in Table 2, is chosen as the root of the decision tree too. The generated decision tree of dermatology with Kendall’s correlation is illustrated in Figure 4. We repeat the same way to generate the decision trees for the dataset of Bupa according to the results listed in Table 3. After generating the decision trees, we begin to compare the above different technique according to the criteria – the number of rules and the number of levels. Table 4 is the result of the comparison. This table indicates that ID3 perform better than Kendall’s tau correlation in discovering rules for the dermatology and bupa database. Especially, in the dataset of dermatology, the number of rules that ID3 generates is much less than that Kendall’s tau correlation dose.. Table 2. Attribute priority of dermatology database ID3. Attribute priority Attr. name. Gained info.. 1 2. Y O. 1.2540 1.1808. 3 4 5 6 7 8 9 10. M F U P AB AG T V. 1.1367 0.9028 0.7829 0.7806 0.6717 0.6494 0.6396 0.6021. Kendall’s tau correlation Attr. name Correlation coefficient V -0.6670 T -0.6590 X J N W O B I S. -0.5370 -0.5340 -0.5040 -0.4630 0.4560 -0.4050 -0.3990 -0.3880 3.
(4) 11 12 13 14 15 16 17 18 19 20 21 22. L AC AA H I C J D B E S G. 0.5767 0.5751 0.5686 0.4713 0.4503 0.3940 0.3429 0.3134 0.3021 0.3011 0.2949 0.2644. U Z G AE AD C P AB A K AH Y. -0.3830 -0.3700 0.3600 0.3490 0.3420 -0.3260 0.2650 0.2270 -0.2084 -0.1700 -0.1630 0.1230. 23 24 25 26 27 28 29 30 31. AE X N AD AH Z K W Q. 0.2582 0.2546 0.2448 0.2144 0.2043 0.1995 0.1684 0.1486 0.1447. AC L AG F H AA Q D R. 0.1190 0.1160 0.1160 0.1150 0.1130 0.1100 0.0990 0.0700 -0.0680. 32 33 34. A AF R. 0.1420 0.0957 0.0876. E AF M. -0.0640 -0.0370 -0.0130. Table 3. Attribute priority of Bupa database Attribute priority 1 2. Attr. name C D. 3 4 5 6. A F B E. ID3 Gained info. 0.0230 0.0220 0.0171 0.0051 0.0003 0.0002. Kendall’s tau correlation Attr. Correlation name coefficient E 0.181 D 0.121 C B A F. -0.111 -0.101 -0.087 0.034. Y high low medium 3. 3 high 5. O low medium. 5 high. M low medium. …………..… Figure 3: Decision tree generated in ID3 for dermatology. W high. low. medium. U low high high low medium medium Y 1 Y 1 Y high high low hig medium low low medium medium U. 1. ……………………. ……………. Figure 4: Decision tree generated in Kendall’s correlation for dermatology. Table 4: The evaluation results Database name\. Dermatology. Evaluation criteria. ID3. Bupa. Kendall’s ID3 Kendall’s. The number of rules. 54. 96. 16. 20. The number of levels. 25. 28. 5. 6. 4. Conclusion and future work Recently, many researches have proposed different methodologies of knowledge discovering which based on either induction or statistics. But the comparison of the method is seldom discussed. In this research, we choose ID3, induction-based method, and Kendall’s tau correlation, statistics-based method, to compare their performance of rule generation. To prove the confidence, we choose the real databases, dermatology and Bupa, as the comparison targets. The evaluated criterions in this research are the number of rules and the level of decision tree. It is obvious that ID3 performs better than Kendall’s tau correlation in respect to the selected criterions. In addition to the above criterions, more criteria such as run time, accuracy and the number of nodes seems to be taken into consideration. In this research, run time is not measured due to the lack of computerization and systemization. Accuracy is not considered for ID3 because of the entire checking for the dataset while building the decision tree. The research, therefore, concentrates on the concision that is used to reflect the number of nodes in the tree. In this paper we use two different databases in this research and conduct the comparison. However, it is necessary to test several different domain datasets separately for the reliability in the future. On the other hand, the annual rule discovery from a set of data is a time consuming task because of the high computation process. It will be helpful to develop a system that can carry out the entire processes from reading dataset, discretization, determination of the attributes, and decision tree generation. 4.
(5) Reference [1] Ming-Syan Chen, Jiawei Han, and Philip S. Yu, “Data mining : an overview from a database perspective”, IEEE Transactions on knowledge and data engineering, Vol. 8, No.6, December 1996 [2] Kang Chang, Chien-Hsing Wu, “Decision tree generation using fuzzy measure theory”, Journal of the Chinese Institute of Industrial Engineers, Vol.14, No.2, pp115-122, 1997 [3] Charalambos Tsatsaraskis, D. Sleeman, “Supporting preprocessing and postprocessing for machine learning algorithms: a workbench for ID3”, Knowledge acquisition, Vol. 5, No. 4, December 1993 [4] Stephan Arndt, Carolyn Turvey, and Nancy C. Andreasen, “Correlating and predicting psychiatric symptom ratings : Spearman’s r versus Kendall’s tau correlation “, Journal of Psychiatric Research 33, pp97-104, 1999 [5] Stephan M. Rudolfer, Georgios Paliouras, and lan S. Peers, “A comparison of logistic regression to decision tree induction in the diagnosis of carpal tunnel syndrome”, Computers and biomedical research, Vol.32, No. 5, October 1999 [6] Quinlan, J. R., “Induction of Decision Tree”, Readings in Machine Learning, Shavlik, J. W. and Dietterich, T. G., eds., Morgan Kaufmann Publishers, Inc., California, pp57-69, 1986 [7] http://www.ics.uci.edu/~mlearn. 5.
(6)
數據
相關文件
Department of Mathematics National Cheng Kung
Department of Mathematics National Cheng Kung
Department of Mathematics National Cheng Kung
Department of Mathematics National Cheng Kung
Department of Mathematics National Cheng Kung
Department of Mathematics National Cheng Kung
Department of Mathematics National Cheng Kung
Department of Mathematics National Cheng Kung
