12-lead ECG Delineation by Clinical Database
4
0
0
全文
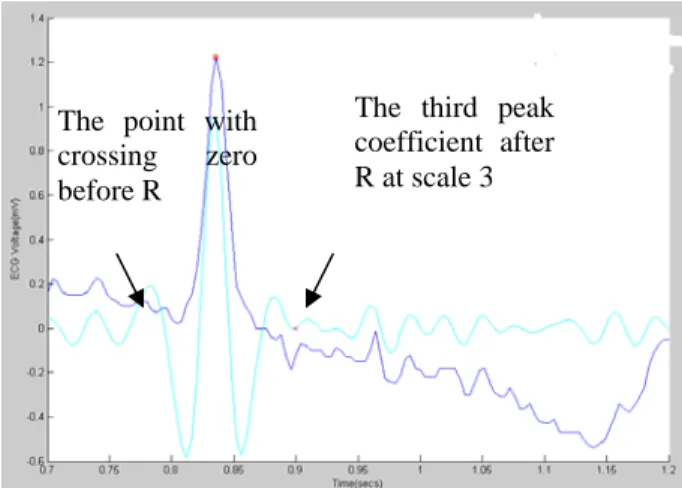
(2) ECG signals were compressed at section 128 of SCP binary format. The bit-length, which was used to compress ECG, was decode in our previous study [10] shown in Table 1. Table 1: Bit length for ECG signal compression in SCP-ECG files. Figure 1: Illustration of R wave identification by lead V1 ECG with baseline wandering. J point is much crucial than S point to clinical diagnosis of 12-lead ECG. It should be the first reflective point after S in normal ECG. We detected the J point instead of S point. The J point was determined at the third peak coefficient at scale 3 after R wave. The Q point was located at the coefficient with crossing zero value before R wave. In Figure 2A, a noise interfered ECG and its coefficient at scale 3 of wavelet were shown. The detection of Q and J points were indicated in Figure 2B.. The point with crossing zero before R. The third peak coefficient after R at scale 3. 3: RESULTS In the process of ECG delineation, R wave was identified at first, followed by Q and J points, T and P waves. In the procedure of R wave identification, the coefficients at scales 3 and 4 were selected and their multiplication was as the indicator of R wave. In Figure 1, the illustration of R wave identification was shown. The original ECG at lead V1 was shown at the top panel of Figure 1. The coefficients at scales 3 and 4 were shown at the second panel in Figure 1. The multiplication of coefficients at scales 3 and 4, as well as the multiplication above a pre-setting threshold selected as R wave indicator, were shown at the third panel. The exact location of R wave can be found at the neighborhood of the selected indicator. In Figure 1, the R wave can be identified correctly despite of baseline drift, which was commonly observed in ECG.. Figure 2A: Illustration of Q and J points detection by the coefficient at scale 3.. Figure 2B: Q and J point detection in lead V4 ECG. By the multiplication of coefficients at scales 4 and 5, the peak of T wave (Tpeak) was determined by the absolute peak coefficient at scale 4, which was nearest to the multiplication. Once the T peak was located, the starting point of T (Ton) and the end point of T wave (Tend) were determined. The Ton was located on the right side of Tpeak and responded to the absolute peak coefficient at scale 5. Ton was found on the left side of T peak with the first coefficient crossing zero value at scale 4. In Figure 3, a standard 2.3 sec V4 lead in 12-lead ECG was shown. The T wave in Figure 3 was. - 1294 -.
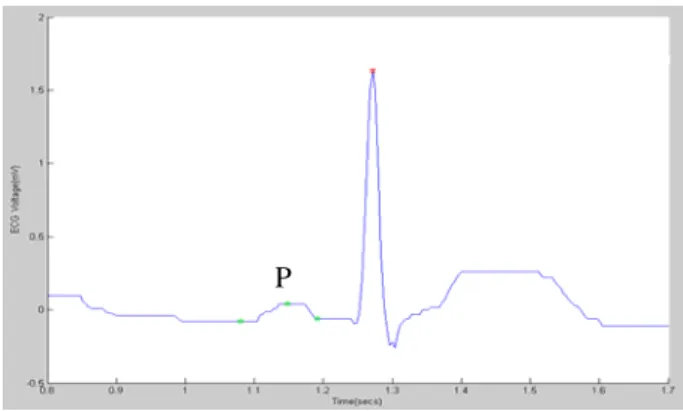
(3) inverted due to acute myocardial infarction and the T wave was interfered by relative high frequency noise. The T wave was delineated by identifying the locations of Ton, Tpeak, and Tend.. P. Figure 4B: P wave delineation by normal lead II ECG.. 4: CONCLUSIONS. Figure 3 T wave delineation by the example of acute myocardial infarction. By finding the peak of P wave (Ppeak), the end point of P wave (Pend), and the starting point of P wave (Pon), the P wave can be delineated. The Ppeak was determined by the absolute peak of the first derivate of coefficients at scale 4. The Pend was located on the right side of Ppeak with the crossing zero values at scale 4. The Pon can be found on the left side of Ppeak with the second crossing zero value at scale 4. In Figure 4A, the coefficients and the first derivative of coefficient of lead II ECG at scale 4 were shown. In Figure 4B, the delineated P wave was located by the proposed procedures as shown in Figure 4A.. The first derivate of coefficient at sale 4. As shown in Tables 2A to 2E, this study showed that the sensitivity and specificity of ECG feature detection are high, especially on Q, J, T, and P detection as compared to other studies [5-7]. This study adopted three categories, including acute myocardial infarction (AMI), hyperkalemia, and normal ECG. The average sensitivity of R wave in these three categories is above 99%, and its average specificity is above 99.9%, as shown in Table 2A. As shown in Table 2B, the average sensitivity of Q point is about 97%, and its specificity is about 99.9%. The average sensitivity of J is about 97%, and its specificity is about 99.9%. The results showed that our study improved the accuracy of P and T wave feature detection as compared to Li’s report [5]. With the methods proposed in this study, the asymmetric T wave and P wave can be detected more effectively. The sensitivity and specificity of P and T waves are shown in Tables 2D and 2E. In conclusion, we recommend the use of this type of more accurate assessment of national clinical 12-lead ECG data, which can facilitate more rapid development of 12-lead ECG interpreters made in Taiwan, Table 2A Accuracy of R wave detection Sensitivity. Coefficient at scale 4. Figure 4A: The first derivate of coefficient at scale 4 was used to indicated the peak of P wave.. Specificity (total=[Q]+[J]+[P]+[T]) (1961/1963)=99%. AMI. (547/556)=98.4 %. Hyper -kale mia norma l. (879/889)=98.9 %. (3014/3014)=100%. (364/364)=100 %. (1439/1439)=100%. Table 2B Accuracy of Q wave detection Sensitivity. AMI. - 1295 -. (536/556)=96.4 %. Specificity (total=[R]+[J]+[P]+[ T]) (1963/1963)=100%.
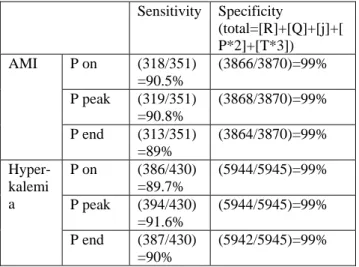
(4) Hyper-kalem ia normal. (857/889)=96.4 % (360/364)=98.9 %. (3003/3014)=99%. normal. (1349/1349)=100%. P on P peak P end. Table 2C Accuracy of J wave detection Sensitivity. AMI Hyper-kalem ia normal. (538/556)=96.7% (873/889)=98.2%. Specificity (total=[R]+[Q]+[P] +[T]) (1963/1963)=100% (3014/3014)=100%. (351/364)=96.4%. (1349/1349)=100%. Table 2D Accuracy of T wave detection Sensitivity. AMI. T on T peak T end. Hyperkalemi a. normal. T on T peak T end T on Tpeak. (463/500)= 92.6% (452/500)= 91% (459/500)= 91.8% (773/806)= 96% (761/806)= 94% (767/806)= 95% (357/364)= 98% (356/364)= 97.5%. Specificity (total=[R]+[Q]+[j]+[P *3]+[T*2]) (3489/3499)=99% (3484/3499)=99% (3489/3499)=99% (5564/5569)=99% (5554/5569)=99% (5545/5569)=99% (2860/2861)=99% (2853/2861)=99%. Table 2E Accuracy of P wave detection Sensitivity. AMI. P on P peak P end. Hyperkalemi a. P on P peak P end. (318/351) =90.5% (319/351) =90.8% (313/351) =89% (386/430) =89.7% (394/430) =91.6% (387/430) =90%. Specificity (total=[R]+[Q]+[j]+[ P*2]+[T*3]) (3866/3870)=99% (3868/3870)=99% (3864/3870)=99% (5944/5945)=99% (5944/5945)=99% (5942/5945)=99%. (325/347) =93.3% (325/347) =94% (323/347) =93%. (2878/2878)=100% (2878/2878)=100% (2877/2878)=99%. REFERENCES [1] Brailer DJ, Kroch E, Pauly MV: The impact of computer –assisted test interpretation on physician decision making. Med Decis making. 1997;17:80-86. [2] Goodacre S, Webster A: Do computer generated ECG reports improve interpretation by accident and emergency senior house officier. Postgrad Med J.2001;77:455-457. [3] Salerno SM, Alguire PC, Waxman HS: Trainin and competency evaluation for interpretation of 12-lead ECG: Recommendations from the American college of physicians. Ann Intern Med. 2003,747-750. [4] Pan J, Tompkins WJ. A real-time QRS detection algorithm.IEEE Trans. Biomed Eng. 1985 ; 32(3):230-236. [5] Li C. et al. Detection of ECG characteristic points using wavelet transforms. IEEE Trans Biomed Eng. 1995;42(1):21-28. [6] Martinez JP, Almeida R,Olmos S Laguna P. A wavelet-based ECG delineator: evaluation on standard databases. IEEE Trans Biomed Eng. 2004,51(4):570-581. [7] Sahambi JS, Tandon SN, Bhatt RK. Using wavelet transforms for ECG characterization. IEEE Engineering in Medicine and Biology. 1997(Jan), 77-83. [8] Hsieh JC[1], Tzeng WC,Yang YC, Shieh SM: Detecting ECG Characteristic Points by Novel Hybrid Wavelet Transforms:: Computers in Cardiology. 2005,32:751-754 [9]MIT/BIH arrhythmic database available at http://www.physionet.org. [10] Chiang CC, Hsieh JC et. al. An SCP Compatible 12-LeadElectrocardiogram Database for Signal Transmission,Storage and Analysis. Computers in Cardiology 2004;31:621-624. [11] Hsu JQ et al: The Extraction of characteristic Points of 12-lead ECG based on wavelet transform. Hua-Tung Normal University Journal. 2005(May), 27-32. [Chinese print].. Correspondence Jui-chien Hsieh, Ph.D. Department of Information Management Yuan ZeUniversity, Chung Li, Taiwan jchsieh@saturn.yzu.edu.tw. - 1296 -.
(5)
數據
相關文件
During the Italian Renaissance, women wore white powder made of lead on their faces.. Of course, doctors now know lead is like a poison for
• “Greedy”: always makes the choice that looks best at the moment in the hope that this choice will lead to a globally optimal solution. • When to
Other instruments and appliances, used in dental sciences, with low-frequency, high-frequency, ultrasonic and ultra-short wave
“Greedy”: always makes the choice that looks best at the moment in the hope that this choice will lead to a globally optimal solution. When to
The PE curriculum contributes greatly to enabling our students to lead a healthy lifestyle with an interest and active participation in physical and aesthetic
This research was based on a 12-year compulsory education syllabus in the field of mathematics, and it integrated mathematical culture to develop game-based lesson plans to
In this paper, we extended the entropy-like proximal algo- rithm proposed by Eggermont [12] for convex programming subject to nonnegative constraints and proposed a class of
In this paper, a novel subspace projection technique, called Basis-emphasized Non-negative Matrix Factorization with Wavelet Transform (wBNMF), is proposed to represent
