MATERIALS CHARACTERIZATION 43:217–226 (1999)
© Elsevier Science Inc., 1999. All rights reserved. 1044-5803/99/$–see front matter 655 Avenue of the Americas, New York, NY 10010 PII S1044-5803(99)00043-1
217
A
pplicability of Ultrasonic Testing for the
Determination of Volume Fraction of Particulates in
Alumina-Reinforced Aluminum Matrix Composites
C.-K. Fang,* R. L. Fang,
†W. P. Weng,
‡and T. H. Chuang
§*Department of Mechanical Engineering, China Institute of Technology, 245 Yen-Chu-Yuan Rd., Sec. 3, Nankang, Taipei, Taiwan 115; †Quality Control Division, Tang-Eng Iron Works Co., LTD.,
Kaohsiung, Taiwan 812; ‡Loyalty Founder Enterprise, Co. LTD., Taoyuan, Taiwan 330; and §Institute of Materials Science and Engineering, National Taiwan University, Taipei,
Taiwan 106
An ultrasonic testing technique was employed to determine the volume fraction of alumina particulate reinforcement in 6061 aluminum matrix composites. This study was performed on various composites with Al2O3 nominal volume fractions of 10, 15, and 20%. For
com-parison, other techniques were employed as well, including the Archimedes method, met-allographic image analysis, X-ray diffraction, and acid dissolution. Observations indicated that ultrasonic testing and acid dissolution methods are more reliable than the other tech-niques, while ultrasonic testing is faster than the acid dissolution method. © Elsevier Sci-ence Inc., 1999. All rights reserved.
INTRODUCTION
A metal matrix composite (MMC) is nor-mally fabricated using a ductile metal (e.g., aluminum, titanium, and nickel as the base material), which is reinforced by a ceramic (e.g., alumina, silion carbide, and graphite). Combining the metallic properties (good ductility and toughness) of the matrix with the ceramic properties (high strength, hard-ness, and elastic modulus) of the reinforce-ment, excellent material performance can be achieved, with the composite exhibiting high toughness, specific strength and stiff-ness, and good wear resistance. The MMC can also have low thermal and electric con-ductivity, and low sensitivity to tempera-ture variation and thermal shock. Conse-quently, MMCs have recently engendered extensive interest from defense, aerospace, and automotive industries, and have be-come very promising engineering materials for other structural applications as well.
The MMC microstructures may be subdi-vided according to whether the reinforce-ment is in the form of continuous fibers, short fibers (whiskers), particulates, or platelets. Although continuous fiber- and whisker-reinforced MMCs have better ma-terial properties under certain conditions, the cost of raw materials and fabrication are relatively high compared to those for particulate-reinforced MMCs. Particulate-reinforced MMCs are promising because of their homogeneous and isotropic material properties, low cost, and ability to be formed using conventional metal processing tech-niques.
The many factors related to the proper-ties of MMCs include: (1) the properproper-ties of the base material [1,2], (2) the type, shape, dimensions, geometric arrangement, and volume fraction of the reinforcement [3–6], and (3) the wettability at the interface of the reinforcement and matrix, and the pres-ence/absence of voids. Among these
fac-218 C.-K. Fang et al. tors, the volume fraction of reinforcement
is particularly crucial because it is directly related to the strength, ductility, elastic modulus, and wear resistance of MMCs.
The most popular methods for determin-ing the volume fraction of ceramic rein-forcements include point counting, metallo-graphic image analysis, and acid dissolution. A brief description of these and other tech-niques is described below.
POINT COUNTING
ASTM E562-83 gives the standard practice for performing the point-counting technique. The specimens need to be prepared using standard metallographic techniques. Using a square grid pattern, the number of grid inter-sections with the particles is counted. The re-sult is obtained through dividing the num-ber of grid intersections by the total numnum-ber of the points in the grid. Averaged results from many sampling fields need to be taken to minimize measurement errors. The disad-vantage of this method is, however, that it is time consuming.
METALLOGRAPHIC IMAGE ANALYSIS Metallographic image analysis is accom-plished by a computerized analysis of the digitized image on a computer monitor. The gray levels corresponding to the stud-ied reinforcement are selected using a com-puter mouse. The regions with the selected gray levels are colored on the screen. Com-puting the area fraction of the colored re-gions by computer, the volume fraction of the reinforcement is obtained. This tech-nique has the advantage of saving time, particularly for a fully automated system.
ACID DISSOLUTION
A composite specimen is immersed in an etching solution. The solution is selected such that the matrix is soluble in the solu-tion, whereas the reinforcement is not. The retained insoluble ceramic reinforcement is dried and weighed. The calculated weight fraction of the reinforcement can be converted to a volume fraction.
Liang et al. [7] assessed the above three methodologies, viz.; point counting, metal-lographic image analysis, and acid dissolu-tion. It was noted that the accuracy of these methods might be influenced by the differ-ing matrix characteristics. To show the ef-fects of the matrix and reinforcement com-position on the results, two different matrices and two types of reinforcement were used in their study. It was found that a reasonably accurate volume fraction can be determined using all three techniques. For time-saving considerations, metallo-graphic image analysis was preferred over the other two methods.
ARCHIMEDES’ METHOD
This technique is based on the well-known Archimedes’ principle. Let the weights of MMC in the air and in the water be Wa and Ww, respectively, and the densities of the
matrix material and the reinforcement be
dm and dr, respectively. The total volume of
the composite is:
(1) according to Archimedes’ principle, where
dw is the density of the water (dw 5 1 g/
cm3). If no voids are present in the MMC,
the weight of the composite in the air is (2) where Vr is the total volume of the
rein-forcement. Solving Eqs. (1) and (2), the vol-ume fraction of the reinforcement is obtained:
(3) X-RAY DIFFRACTION
An X-ray diffraction technique is useful in the analysis of the elements present in the composite as well as in the determination of the percent phases present. According to the intensities of characteristic lines corre-sponding to the reinforcement material, the volume fraction of the reinforcement can be estimated. V = (Wa–Ww)⁄dw, Wa = dm(V–Vr)+drVr, Xr Vr⁄V dwWa dr ( –dm)(Wa–Ww) --- dm dr–dm ---– = =
Ultrasonic Testing in Aluminum Matrix Composites 219
ULTRASONIC TESTING
Because of modulations of ultrasonic waves resulting from material variables, micro-structures of materials influence ultrasonic wave propagation. Ultrasonic characteriza-tion according to the volume fraccharacteriza-tion of re-inforcement in MMCs is thus possible. Be-cause the variations in wave speed and energy losses are associated with the varia-tions in microstructure, ultrasonic velocity and attenuation measurement can be used to estimate particle concentration in MMCs.
Using the ultrasonic technique, Delebarre et al. [8] estimated local particle concentra-tion in MMCs through histogram process-ing techniques (based on the study of the mean value and standard deviation of the histograms). Measuring the longitudinal wave velocity at 100MHz frequency, they obtained an approximately linear slope for the velocity vs. the volume percent of SiC inclusions.
EXPERIMENTAL PROCEDURE
Alumina particulate-reinforced 6061 alumi-num alloy composites (Al2O3/Al) were
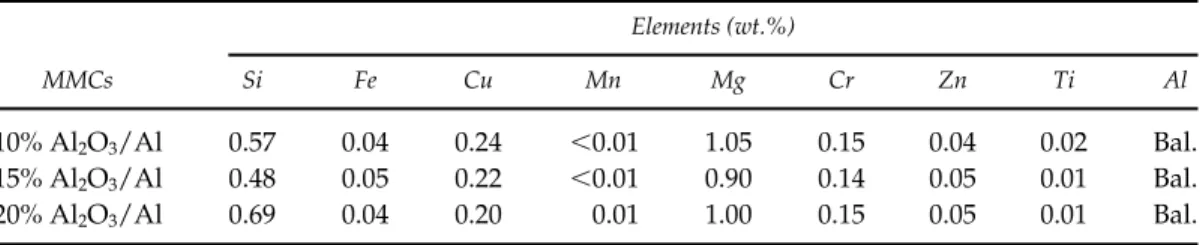
used in the present work. Different nomi-nal volume fractions of the reinforcement in the composites were prepared, viz.; 10, 15, and 20%. The MMCs were supplied by the Dural Aluminum Composites Co. in the United States. Their chemical composi-tions are listed in Table 1. The as-cast mate-rials in billet form of 200mm in diameter were hot extruded into bars of 30mm in di-ameter. Typical micrographs after extru-sion are shown in Fig. 1.
In ultrasonic testing, the volume fraction of ceramic particles in the aluminum ma-trix composites was determined by mea-suring the ultrasonic wave speeds. A 5MHz straight-beam, single-crystal transducer was utilized to generate longitudinal stress waves. The thickness, d, of the MMC speci-men and the time difference, Dt, between the transmitted and the back-reflected waves were measured. The wave speed in the MMC, vmmc, can be readily obtained using
Eq. (4):
(4) If the volume fraction of the particles is
Xp, the wave speed in the MMC can be
ex-pressed as:
(5) where vm and vr are wave speeds in the
ma-trix material (6061 Al) and in the reinforce-ment material (Al2O3), respectively.
Mea-suring vm and vr, the volume fraction Xr is
readily obtained by solving Eq. (5).
To investigate the applicability of the ul-trasonic testing method for the determina-tion of the volume fracdetermina-tion of particulates, the results were compared with those ob-tained from other methods, including Archimedes’ principle, metallographic im-age analysis, acid dissolution, and X-ray diffraction. The experimental procedures for these methods are described as follows.
ARCHIMEDES’ METHOD
Fifteen specimens were cut for each com-posite. They were ultrasonically cleaned with acetone, and then weighed in air (Wa) vmmc = 2d⁄Dt.
vmmc = vm(1–Xr)+vrXr,
Table 1 Chemical Compositions of the Aluminum Matrix in the Tested MMCs
MMCs Elements (wt.%) Si Fe Cu Mn Mg Cr Zn Ti Al 10% Al2O3/Al 0.57 0.04 0.24 ,0.01 1.05 0.15 0.04 0.02 Bal. 15% Al2O3/Al 0.48 0.05 0.22 ,0.01 0.90 0.14 0.05 0.01 Bal. 20% Al2O3/Al 0.69 0.04 0.20 0.01 1.00 0.15 0.05 0.01 Bal.
220 C.-K. Fang et al.
and in water (Ww). The densities of water,
the matrix material (6061 Aluminum alloy), and the particles (Al2O3) are 1, 2.7 and
3.986g/cm3, respectively. Substituting these
values into Eq. (3), the volume fraction of the reinforcement, Xr, can be readily obtained.
METALLOGRAPHIC IMAGE ANALYSIS The surface of the specimens was polished with emery paper. Final polishing was done using a rotary polishing cloth consist-ing of water-suspended 1mm alumina par-ticles. After etching, the specimens were
observed using an optical microscope con-nected to a computer. Using an image ana-lyzer, several areas on the specimen were investigated. The image on the screen was divided into 64 gray levels. The gray level distribution contained two peaks, corre-sponding to the reinforcement particles and the matrix, respectively. A gray level thresh-old was chosen as the average gray level of the two peaks. The regions with the gray levels of interest were colored on the screen. The volume fraction of the ceramic phase was obtained through computation of the area fraction of the colored regions using an image analyzer.
Care must be taken to ensure that a flat surface is obtained, as different polishing rates can expose more or less of a given phase. Although the use of alumina as a polishing medium does present a difficulty because it has a similar hardness to the re-inforcing phase, it was preferred over SiC. Wilson and Ball [9], for example, have found that abraded SiC particulates tend to become embedded in the Al 6061 alloy. However, if a satisfactory polish could be achieved with SiC, a reduction in the stan-dard deviation for the data would probably be obtained. In the present experiments, er-rors were considered relatively small as a result of using alumina, when compared with potential errors from poor differentia-tion between reinforcement and matrix in the MMCs.
ACID DISSOLUTION
Fifteen specimens were used for each MMC. Each specimen was weighed and denoted as Wa, before acid dissolution. After
ultra-sonically rinsing with acetone, each speci-men was immersed and stirred in aqua re-gia, a mixture of three parts hydrochloric acid and one part nitric acid by weight. The specimen was first immersed in the solu-tion and periodically stirred until the metal matrix was completely dissolved. After 6 h, the solution was filtered through filter pa-per, initial weight, Wf. After filtering, the
filter paper was dried in an oven, and then FIG. 1. Scanning electron micrographs of the polished
surface on the MMCs with different particulate vol-ume fractions: (a) 10%; (b) 15%; (c) 20%.
Ultrasonic Testing in Aluminum Matrix Composites 221
weighed,WF. The weight of the Al2O3
parti-cles is thus Wr5 WF2 Wf, and the volume
fraction of the particles [Eq. (6)] is:
(6)
X-RAY DIFFRACTION
The MMC specimens were sanded and pol-ished before testing. An X-ray diffractome-ter was utilized to analyze the volume frac-tion of the reinforcement in the composites.
Xr Wr 3.986 ---Wr 3.986 --- Wa–Wr 2.7 ---+ ---=
RESULTS AND DISCUSSION
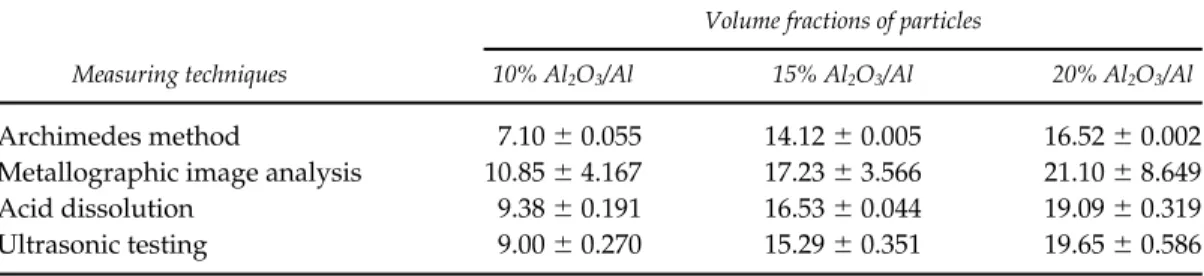
Table 2 lists the measured results of the particulate volume fraction in three alumi-num matrix composites using four different techniques, viz.; the Archimedes method, metallographic image analysis, acid disso-lution, and ultrasonic testing. The standard deviation of the data is indicated. The re-sults obtained from X-ray diffraction are not shown in Table 2 because they are semiquantitative. However, the results ob-tained from different techniques are dis-cussed as follows.
Table 2 Measured Volume Fractions (%) of the Reinforcement Using Different Measuring Techniques
Volume fractions of particles
Measuring techniques 10% Al2O3/Al 15% Al2O3/Al 20% Al2O3/Al
Archimedes method 7.10 6 0.055 14.12 6 0.005 16.52 6 0.002
Metallographic image analysis 10.85 6 4.167 17.23 6 3.566 21.10 6 8.649
Acid dissolution 9.38 6 0.191 16.53 6 0.044 19.09 6 0.319
Ultrasonic testing 9.00 6 0.270 15.29 6 0.351 19.65 6 0.586
222 C.-K. Fang et al. THE ARCHIMEDES METHOD
Although the measured results of the par-ticulate volume fraction using the Archi-medes method have very low standard de-viations, the mean values are much lower than the nominal values, as indicated in Ta-ble 2. This may be due to the porosity in the composites. If the total volume of the po-rosity is denoted as Vp, Eqs. (2) and (3)
should be modified to Eqs. (7) and (8) (7)
(8) where Xp is the volume fraction of the
po-rosity. Because the results for the Archimedes method shown in Table 2 were obtained from Eq. (3), they were underesti-mated by Xpdm/(dr2 dm). Owing to the fact
that the densities of the matrix material and ceramic particulate reinforcement are dm5 Wa = dm(V–Vr–Vp)+drVr, Xr dwWa dr ( –dm)(Wa–Ww) ---dm dr–dm --- dm dr–dm ---Xp, + – =
2.7 and dr 5 3.986, respectively, the error
due to the existence of porosity is 2.1Xp. In
other words, the error in the volume frac-tion of the reinforcement due to the exist-ence of porosity is approximately twice the volume fraction of the porosity in the MMC. For a composite with 10% reinforce-ment particles, the error percentage is 21% if the composite contains 1% porosity.
Overall, this method may result in very large errors due to the porosity in compos-ites. In addition, if any of the pores are sur-face connected, water may progressively enter the porosity network during weigh-ing, giving variable readings. A possible solution to the problem caused by surface-connected pores is to coat the sample with a thin layer of a lacquer impervious to wa-ter [10]. As for controlling inwa-ternal porosity, no solution is available thus far.
Despite the advantages of speed, ease, and minor errors in the operation process (low standard deviations), this technique is not reliable if the tested composite contains pores. Unfortunately, porosity is inevitable
Ultrasonic Testing in Aluminum Matrix Composites 223
for most of the metal matrix composites, particularly for those fabricated by casting. The Archimedes principle is, consequently, not very suitable, in practice, for the deter-mination of the volume fraction of the rein-forcement in composites.
METALLOGRAPHIC IMAGE ANALYSIS Because the image analyzer can mistakenly identify impurities (e.g., pores and inclu-sions) as reinforcement particles, the mea-sured volume fractions are larger than the nominal values, as illustrated in Table 2. In addition, large standard deviations are ob-served in the results. Unless the image of the reinforcement contrasts well with that of the matrix, it is difficult to define the range of the gray levels to be selected as the reinforcement. Unfortunately, a good con-trast between the reinforcement and the matrix is normally unobtainable in most of the metal matrix composites. As a result, the volume fraction is usually estimated with a large error. Despite its advantage of
saving time, using image analysis to deter-mine the reinforcement volume fraction in MMCs is sometimes not very reliable.
ACID DISSOLUTION
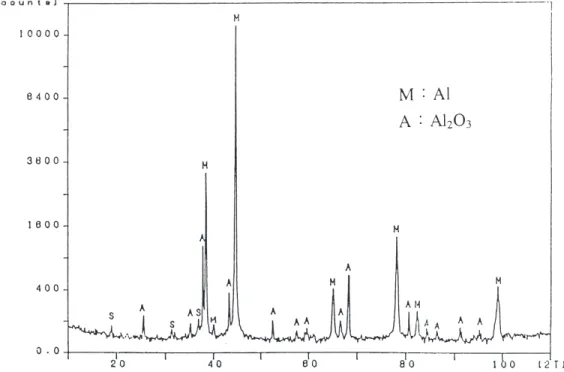
The measured results using the acid disso-lution method are very close to the nominal values, as indicated in Table 2. Theoreti-cally, the acid dissolution technique can al-low a precise measurement of the volume fraction of the reinforcement. In practice, some errors can occur due to improper op-erations. For instance: (1) the ceramic parti-cles are easily lost during filtering; (2) the filtered reinforcement will be overweighed if the filter paper is not washed by distilled water during filtering, and the acid thus re-mains on the filter paper; (3) the particles will be overweighed if the filter paper is not fully dried after filtering. These prob-lems can be overcome by taking special care during the experimental process. Also, the results will be influenced by the forma-tion of interfacial products due to the reac-FIG. 4. X-ray diffraction spectrum of the 15% Al2O3/Al composite.
224 C.-K. Fang et al.
tion of the reinforcement and the matrix materials. Figure 2 shows the X-ray diffrac-tion spectrum of the powder obtained from acid dissolution. It was found that the pow-der contains an interfacial product MgAl2O4
due to the reaction of the Al2O3 particles
and the aluminum matrix. The accuracy of this method depends on the relative amount of interfacial product to that of reinforce-ment particles. Overall, this method is rela-tively reliable, with both accurate mean values and low standard deviations, as long as the amount of interfacial product is negligibly small and the measuring process is conducted with special care.
X-RAY DIFFRACTION
The X-ray diffraction spectra of the tested MMCs are illustrated in Figs. 3–5. The char-acteristic lines (sharp intensity maxima) of Al and Al2O3 appear in each spectrum.
Ta-ble 3 shows the relative intensities of some major Al2O3 peaks. It was found that the
relative intensity of Al2O3 peaks somehow
increases with the increasing volume frac-tion of reinforcement, although some ex-ceptions are observed. A mathematical function for the relationship between the spectrum and the particulate concentration is, however, not available. Consequently, the X-ray diffraction method can provide
Table 3 Relative Intensities of the Al2O3 Peaks in the Spectra of Three MMCs in This Study 2u (degrees)
MMCs 25.548 35.148 37.808 43.368 68.158 80.638
10% Al2O3/Al 0.2% 0.4% 3.6% 0.9% 6.2% 1.0%
15% Al2O3/Al 1.1% 1.1% 7.3% 2.0% 8.5% 0.6%
20% Al2O3/Al 0.7% 0.7% 10.2% 2.7% 8.8% 1.3%
Ultrasonic Testing in Aluminum Matrix Composites 225
only a semiquantitative result for the vol-ume fraction of the reinforcement in MMCs.
ULTRASONIC TESTING
Solving Eq. (5), the volume fractions of the reinforcement were obtained, and are given in Table 2. The calculated results for both ultrasonic testing and acid dissolution are very close to the nominal values, with both accurate mean values and low standard de-viations.
Ultrasonic testing is reliable for the deter-mination of particle concentration in MMCs if good wetting conditions exist in the inter-face of the reinforcement and matrix. How-ever, some problems may occur if large pores exist in the MMCs. The ultrasonic waves will be scattered by the pores, result-ing in noise on the screen of the ultrasonic tester. The sound pressure, PF, of the
re-flected waves from a spherical pore can be expressed as:
(9) where Po is the transmitted sound pressure
from the transducer, A and D are the cross-sectional area and the diameter, respectively, of the transmitter (piezoelectric element) in the transducer, l is the wavelength, and x is the distance between the piezoelectric ele-ment and the pore. Minimizing the re-flected stress waves from pores requires the use of a smaller transducer and an
ultra-PF Po Ad 4λx2 ---= d 0.4λx D ---< ,
sound of lower frequency, according to Eq. (9). In general, PF/Po% 5% is acceptable. In
the present study, a 5MHz transducer with a piezoelectric element of 7mm in diameter was utilized. The longitudinal wave speed and wavelength in the aluminum are 6320m/s and 1.264mm, respectively. If a pore exists at x 5 10mm from the piezoelec-tric element, the diameter of the pore should not exceed 0.66mm.
CONCLUSIONS
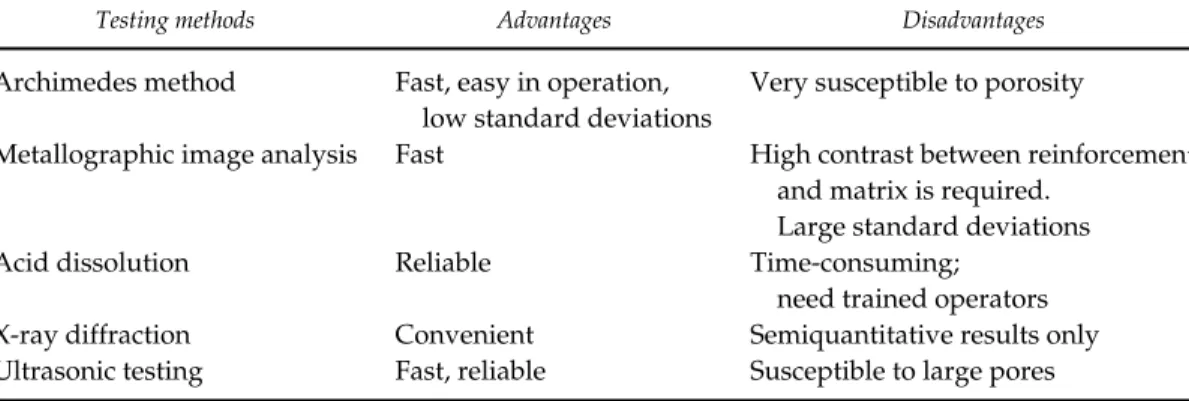
Table 4 gives a comparison of the five tech-niques used in the present study to deter-mine the volume fraction of reinforcement in MMCs. The results for acid dissolution and ultrasonic testing have accurate mean values and low deviations. As for time-sav-ing considerations, the latter is preferred. Overall, ultrasonic testing is a reliable and fast technique if the pores in the MMCs are not too large in size.
References
1. J. England and I. W. Hall: On the effect of the strength of the matrix in metal composites. Scripta Met. 20:697 (1986).
2. C. M. Friend: The effect of matrix properties on re-inforcement in short alumina fibre–aluminum metal matrix composites. J. Mater. Sci. 22:3005 (1987).
3. T. C. Dragone and W. D. Nix: Geometric factors
Table 4 Comparison of the Techniques Used in the Present Study to Determine the Volume Fraction of Particulates in Al2O3/Al Composites
Testing methods Advantages Disadvantages
Archimedes method Fast, easy in operation,
low standard deviations
Very susceptible to porosity
Metallographic image analysis Fast High contrast between reinforcement
and matrix is required. Large standard deviations
Acid dissolution Reliable Time-consuming;
need trained operators
X-ray diffraction Convenient Semiquantitative results only
226 C.-K. Fang et al.
affecting the internal stress distribution and high temperature creep rate of discontinuous fiber rein-forced metals. Acta. Met. 38:1941 (1990).
4. D. M. Stefanescu, A. Moitra, A. S. Kacar, and B. K. Dhindaw: The influence of buoyant forces and volume fraction of particles on the particle push-ing/entrapment transition during directional so-lidification of Al/SiC and Al/Graphite compos-ites. Metall. Trans. A 21A:231 (1990).
5. J. B. Brockenbrough, S. Suresh, and H. A. Wieneck: Deformation of metal–matrix composites with continuous fibers: Geometrical effects of fiber dis-tribution and shape. Acta. Met. 39:735 (1991). 6. D. L. McDaniels: Analysis of stress–strain, fracture,
and ductility behavior of aluminum matrix com-posites containing discontinuous silicon carbide reinforcement. Metall. Trans. A 16A:1105 (1985).
7. X. Liang, J. C. Earthman, J. Wolfenstine, and E. La-vernia: A comparison of techniques for determin-ing the volume fraction of particulates in metal matrix composites. Mater. Char. 28:173–178 (1992). 8. C. Delebarre, I. Baquet, C. Bruneel, J. M. Rouvaen,
and Z. Derouiche: Quantitative characterization of metal matrix composites using histogram process-ing techniques. NDT & E Int. 25:195–200 (1992). 9. S. Wilson and A. Ball: Advances in Composite
Tribol-ogy, K. Friedrich, ed., Elsevier, New York, pp. 311– 366 (1993).
10. T. W. Clyne and P. J. Withers: An Introduction to Metal Matrix Composites. Cambridge University Press, New York, p. 441 (1993).