National Sun Yat Sen University
國立中山大學企業管理學系碩士班
Master Thesis
碩士論文
Feasibility Study of Separate Gas Turbine Generator
Market in India – A Case Study of Green Power
Engineering Company
Author: Ranjit Dash
研究生:
任捷特
Advisor: Prof. Yu-Shan Chang
指導教授:
張玉山 搏士
中華民國 九十七 年 六月
Acknowledgement
________________________________________________________________________
My thanks and appreciation to Dr. Yu–Shan Zhang (張玉山 博士) for persevering with me as my advisor throughout the time it took me to complete this study and write the dissertation. The inspiration for doing this research came from his idea of doing something realistic and applicable. It’s my privilege and honor to have worked under his guidance.
The members of my dissertation committee, Dr. Liu Chang-Young (劉常勇 博士), and Dr. Zhao Ping-Yi (趙平宜 博士), have generously given their time and expertise to better my work. I thank them for their contribution and their good-natured support.
I must acknowledge as well the friends, Ms. Lisa Hong and Mr. Zi Wei Wang. Especially, I need to express my gratitude and deep appreciation to the President of the Green Power Engineering Corporation, Mr. William Chen whose hospitality, knowledge, and wisdom have supported this dissertation. They have consistently helped me keep perspective on what is important in the research.
Dedication
________________________________________________________________________
This dissertation is dedicated to my family. My loving wife Ildiko Zsuzsa Gaspar (Susan), and our daughter Geetika Aisa Dash. They stood beside me and gave me their unconditional support and encouragement. I am thankful to them for all the time they have forgiven me for spending so much time on this work and stealing away family time.
Their sacrifice and help facilitated my research. Susan encouraged me in hard times and she unquestionably took care of our daughter all by herself and made time available for me to pursue this task. Geetika Aisa missed me on the weekends and play-time and yet never complained.
I also dedicate this dissertation to my parents (mother Laxmipriya Dash and father Dharanidhar Dash) whose advices have always given me strength and faith. Their life taught me a new appreciation for the meaning and importance of struggle, and kept me working when I wanted to give up. It is they who taught me the importance of knowledge and value of wisdom.
Abstract
________________________________________________________________________
The Government of India has an ambitious mission of ‘power for all by 2012’. This mission would require that the installed generation capacity should be at least 200,000 MW by 2012 from the present level of 114,000 MW. To be able to deliver this power to the entire nation, an expansion of the regional transmission grid-network and inter regional capacity to transmit power would be essential. The latter is required because resources are unevenly distributed in the country and power needs to be transmitted through great distances to areas where load centres exist.1
Indian government’s ambitious plan can be met. Power generation is one thing but distribution and last mile delivery is a real challenge in remote rural India. 70% of India still lives in such rural settings. India is also notorious for loss of power in
distribution due to its out dated distribution infrastructure and mismanagement. A lot is being done to improve the situation however to fast remedy the problem; government and private players can play an important role in setting up small power plants that are based on eco-friendly and efficient mode of power generation. India’s western states and North eastern states are rich in natural gas. Unfortunately these areas are also remote, especially the North Eastern sector. Delivering power is quite a challenge. In search for a solution to this challenge we could be wise to choose greener solutions than otherwise. In the quest of which solution would be suitable for the chosen project, one could look across an array
1 Annual report, Ministry of Power, India
of available conventional and non-conventional sources of energy. Utilizing the locally available natural gas would be a right strategy. It also suits as a green choice. To exploit the availability of natural gas we would need technologies that are of right scale and are easily executable. A multi-million dollar mega gas power generation plant is neither plausible nor executable in those rural settings; however something of a smaller scale could be a good fit. There we see an opportunity for a green technology that may work wonder. Taiwan based Green Power Engineering Corporation has a solution in the form of their cutting edge gas turbine generator. With ease of setup and efficiency coupled with eco-friendly technology, the Gas turbine generators has the potential to be the solution to the much needed rural development by providing them continuous power.
Keywords: Alternative energy, gas turbine generator, heat exchanger, generator set, energy efficiency, LPG or LNG.
Abstract In Chinese 論文摘要
印度政府對於「2012 年全體國民皆有能源可用」(Power for all by 2012)有野心勃勃的 使命感。這個使命需要於 2012 年時,將裝設的發電能力從現在的 114,000 百萬瓦特至少提 升到 200,000 瓦特。為了能夠將這些能源傳遞到整各國家中,地方輸配電網絡(grid-network) 的拓展與地區內傳送能源的能力,都將變成是基本要求。後者是相當必須的,因為國家的 資源並非平均分布,再加上有許多需要大量電力的地區卻沒有自己的電力來源,導致電力 被傳送的距離常常遙遠。 印度政府野心勃勃的計畫是能夠被達成的。發電雖然是一項重要的事情,但真正的挑 戰是區域分佈的問題,與如何將其傳遞到印度的每一個偏遠農村地區。目前,印度仍有 70%的人生活在相當簡陋的農村環境中。印度也因為其老舊的電力分配方式與管理不當讓 電力傳輸相當無效率而惡名昭彰。印度為了改善這樣的情況而做了執行了許多改善措施, 但都只是快速的解決問題;政府與私人機關在於建立一個以生態保育(eco-friendly)與高效 率發電方式為基礎的小型發電廠中,能夠扮演一個相當重要的角色。印度的西方及東北方 皆富有豐富的天然氣。不幸的是,這些地方都相當的偏僻,特別是東北方那一區塊。因此 傳遞能源就變成是一個相當大的挑戰。在尋求這個挑戰的解決方法時,我們能夠更明智的 去選擇比較環保的方法。在為專案尋求最佳的解決方法時,可以透過仔細衡量常見與非常 見的電力來源,來找出最佳解。最佳的策略當然是運用當地的天然氣,這亦是個符合環保 的選擇。在於挖掘可利用的天然氣,我們所需要的技術是正確的規範並容易執行的。一個 數百萬元的龐大瓦斯能源發電廠在偏遠農村中是不可能被完成或執行的;但是一些較小規 模的設施可能更加適合。 在此,我們便看到了一個環保綠化技術可能執行的更好的機會。台灣的克瑪里能源科技股 份有限公司在於組成先鋒氣輪機發電器就有他們自己的解決方法。簡易設定與效率被與生 態環保(eco-friendly)技術聯想在一起,氣輪機發電器透過提供不間斷的能源,在於有大量 需求的農村發展中,可被視為是一個潛在的解決方案。 關鍵字:替代性能源、氣輪機發電器、熱轉換器、發生器裝置、節能、液化石油氣(LPG) 或 液化天然氣(LNG)
Table of Contents
Abstract ... 4
Chapter 1: Introduction ... 12
1.1 Background and Research Motivation... 12
1.1.1: My Ancestral Village: ... 12
1.1.2: Issues of small village ... 12
1.1.3: Persistence Problem ... 13
1.1.4 The Central Electricity Authority:... 13
1.1.5: A brief introduction to Indian power sector:... 14
1.1.6: Efficiency is increasing ... 16
1.1.7: Per capita consumption is increasing too ... 17
1.1.8: The demand – supply gap is growing... 18
1.2: Root of the Problem... 18
1.2.1: Cause #1- Insufficient Generation Capacity ... 19
1.2.2: Cause#2- Dismal T&D infrastructure ... 19
Chapter 2: Definitions of Key Words, and Review of Literature ... 21
2.1: Definition of Key Words... 21
2.2: Supportive literature... 25
2.2.1: Literature On Feasibility Study ... 25
2.2.2 Literature of Distributed Generation Systems... 30
2.2.3: Literature on Utility Market Deregulation ... 47
Chapter 3: Methodology ... 56
Chapter 4: Technical Feasibility ... 58
4.1: Technical feasibility ... 58
4.2: Pilot Project ... 58
Conclusion: ... 62
4.4: Micro Gas turbine generator ... 64
4.5: CHP & DG systems ... 64
4.5.1: CHP System ... 64
4.7: GPE’s MGT-150 the generator comes into the picture- ... 67
4.8: Introduction to Green Power Engineering Corporation. (GPE) Firm’s Background ... 67
4.9: Introduction to the MGT 150MW Generator’s technical specifications ... 68
4.9.1: MGT-150 Product technical specification:-... 69
4.9.2: Product Features-... 70
4.10: Cross comparison of Micro Gas Turbine with oil based generator sets- Specific features and comparison with alternative system ... 71
Chapter 5: Feasibility with respect to Government Policies and Regulations:... 75
5.1 Section I. Feasibility with respect to Electricity Policies ... 75
5.1.1 Post-2003 Era- EA2003 ... 75
5.2: Section II. Feasibility with respect to Natural Gas Policy... 80
5.2.1: Natural Gas Policies & Regulations ... 80
5.3: The Petroleum and Natural Gas Regulatory Board (PNGRB) ... 83
Chapter 6: Financial Feasibility ... 85
6.1: Financial Feasibility... 85
6.1.1: Project operational factors consideration ... 86
6.1.2 : Project Cost-Calculation considerations: ... 87
6.1.3: Cost Calculation ... 87
6.3: Conclusion of Financial feasibility Analysis-... 90
Chapter 7: Marketing... 91
7.1: Marketing the MGT-150 in India ... 91
7.2: Target Market- ... 93
Chapter 8: Conclusion... 95
8.1: Suggestions for Indian Government: ... 95
8.2: Suggestions for entrepreneurs:... 96
Bibliography ... 98
Website Sources ... 102
Table of figures, tables, and pictures
Figure 1.1: Indian power sector has multi-tier institutional arrangement... 14
Figure 1.2: Generation of power over the two decades. ... 15
Figure 1.3: sector wise installed capacity. ... 15
Figure 2.4: Installed capacity percentage wise. ... 16
Figure 1.5: Capacity as per generation type... 16
Figure 1.6: Generation type as percentage of installed capacity. ... 16
Figure 1.7: Plant load Factor has been increasing over the last decade... 17
Figure 1.8: Consumption of power per capita. ... 17
Figure 1.9: Demand & supply gap... 18
Figure 1.10: Demand & supply gap... 19
Figure 1.11: High losses suffered during Transmission & Distribution... 20
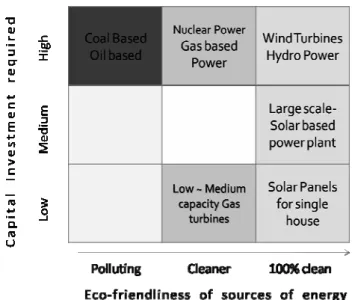
Figure 4.2: Evaluation matrix for different sources of power generation as per capital investment needed and eco-friendliness of the source... 61
Figure 4.3: Flow diagram of Gas Turbine Generator and its subsystem- heat exchanger.68 Figure 4.4- Heat Energy usage (Note: a total of 80% of energy is utilized for output, with an addition of a recuperation system the efficiency is enhanced even further.) ... 68
Figure 7.1: Supply-Location-Convenience Matrix. ... 92
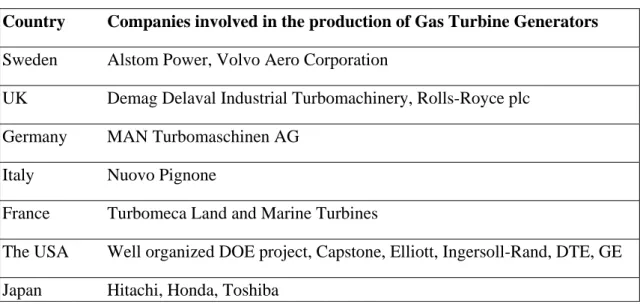
C:\Users\Zsofi\Desktop\Master Thesis- Ranjit Dash - Separate Gas Turbine- Feasibility study. v1.docx - _Toc207362836 List of tables Table 4.1: International provider of MGTG sets. ... 65
Table 4.2 comparative cost and benefit analysis of comparable MTGT sets………66
Table 4.5: Micro Gas Turbine, Piston-Used-Engine generator and Steam Turbine
comparison……….72
Table 4.6: Advantages and disadvantages of Micro Gas Turbine and Diesel-Fueled System... 73
Table 6.1: Project parameters and financial implications... 85
Table 6.2: MGT-150 parameters... 86
Table 6.3: table of costs ... 87
Table 6.4: Net Cash Flow for thirteen years. Net Present value of the OCF... 89
Table 7.1: Regional installed capacity of thermal power projects by type of generation in India. ... 1
Table 1.5: Net cash flow, working capital changes, NPV,IRR, breakeven point, ROI workout table……….90
Table of pictures Picture 4.1: A pictorial presentation of different sources of power generation arranged in a matrix……….………….59
Picture 4.2: Delays in power projects………63
Chapter 1: Introduction
1.1 Background and Research Motivation
1.1.1: My Ancestral Village:
My ancestral village is in the eastern state of Orissa. The village was electrified some forty five years ago and ever since electricity has been playing hide and seek. Come summer the power cuts just get worse and worse. In not so distance past, not being able to withstand the demand load the local transmission sub-station use to blow up, leaving the village dark for weeks and months at times.
However with the economic liberalization came the liberalization of power sector. All the four stages of power industry, i.e. generation, transmission, distribution and trading were deregulated and opened up to the private players. Following which the Orissa State Electricity Board was privatized. With better management followed better load management of grid and the village better of. However rolling power cuts is still as normal as day following night.
1.1.2: Issues of small village
Though the village is small its problems are not that small. The fall out of this grim situation is all the more devastating than it is visible.
The village experiences rolling power cuts. Families are affected. They can run their appliances half the time. The farmers can’t run their pump sets and agriculture suffers. Students are affected. As the night falls so does there productive time. Students often have to study in candle light or under oil lamps. Using IT tools or computers for
enhancing educational output is out of question. The whole scenario is thrown back to the Stone Age.
The brass industry’s work is split into two parts. During the day hours the village folks get busy with melting, alloy making, casting, shaping and other activities that require hard physical labor. In evening hours are reserved for finishing or touch up work. In the absence of electricity the touch up work doesn’t go very far. As a result business suffers. Development of the village is held hostage to the power shortage.
1.1.3: Persistence Problem
Why after all? Why does this situation still exist even after 60 years of
independence? On my last visit to my ancestral village I was confronted by the dismal situation. The village is just about seventy kilometers from the township where I grew up, without having to face a chronic power shortage like my village does. I got tired of the situation and I was desperate to find the reason and answers to this issue.
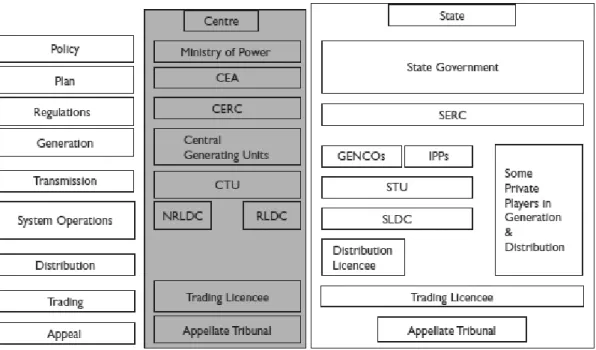
1.1.4 The Central Electricity Authority:
I looked around the Internet and thanks to the Indian government’s e-governance drive; a heap of data is available on the Internet. The CEA (the Central Electricity Authority) website revealed some interesting data to show the magnitude of problem, root cause and a lot of statistics. CEA falls under the ministry of power in the
multilayered structure as shown in the figure below.
The sector has multi-tier institutional arrangement. The primary agency responsible for the power sector in India is the Ministry of Power, which started functioning with effect from second of July 1992.
Figure 1.1: Indian power sector has multi-tier institutional arrangement.2
1.1.5: A brief introduction to Indian power sector:
I learned that the Indian Power Sector has a less than 100 year history. Even with nearly a hundred years into operation Indian power sector could not have its acts together resulting in a huge crisis that has plagued India all these decades.
From humble beginnings in the 1880s, the Indian Power Sector has come a long way From one small unit in 1880s to 1362 MW in 1947 to over 550 Billion Units in 2006-07. According to CEA report demand outruns supply. Generation has increased over the years. From humble beginnings in the 1880s, the Indian power sector has come a long way. From one small unit in 1880s to 1362 MW in year 1947 to over 550 billion units in year 2006-07.
Figure 1.2: Generation of power over the two decades.3
Generation installed capacity in terms of installed capacity, the state sector accounts for the most, followed by the central and private sectors.
Figure 1.3: sector wise installed capacity.4
3 Source: www.ibef.org (India Brand Equity Foundation) 4 Source: www.ibef.org (India Brand Equity Foundation)
Figure 2.4: Installed capacity percentage wise.
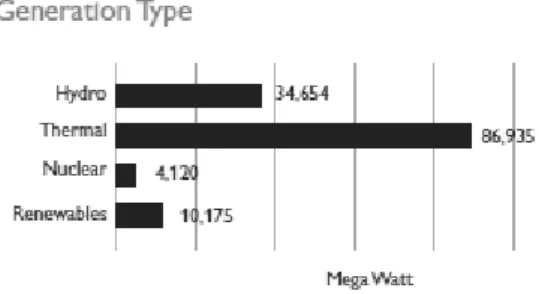
Thermal power accounts for much of the power produced in India, followed by hydro. Other means of generation are negligible in comparison.
Figure 1.5: Capacity as per generation type.
Figure 1.6: Generation type as percentage of installed capacity.
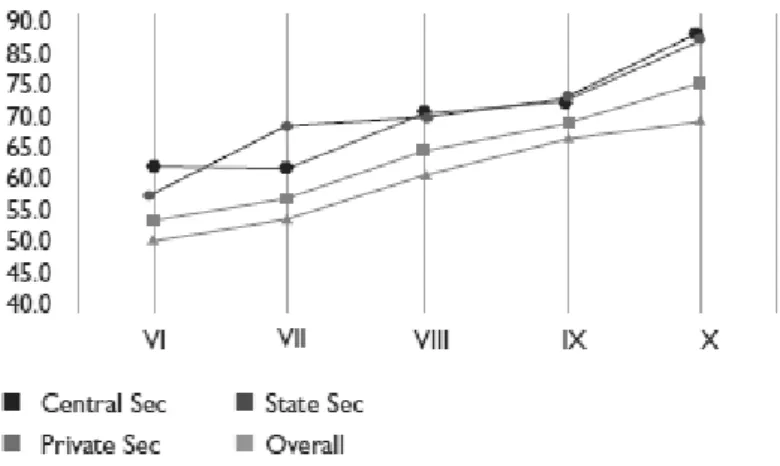
1.1.6: Efficiency is increasing
Generation plant load factor has been improving. Plant load factor (PLF) of generating plants has improved consistently over the last few years. The all India average PLF on January 2007 stood at 75.6 % compared to 53.8 % in 1990-91. PLF of central
plants in 07 stood at 83.3% while the average PLF of the state sector units in 2006-07 was 69.5 %. The PLF increase is shown in the figure below.
Figure 1.7: Plant load Factor has been increasing over the last decade.
1.1.7: Per capita consumption is increasing too.
Per capita consumption of power in India has gone up significantly since the 1990s.1
Figure 1.8: Consumption of power per capita has been increasing consistently. It will reach a 1000 unit her capita by 2012.
1.1.8: The demand – supply gap is growing
Energy requirement during 2006-07 (up to Jan 07) stood at 572,812 MU and energy availability during the same period was 519,656 MU resulting in energy shortage of 53,156 MU (9.3%). Peak demand for energy in 2006-07 (up to Jan 07) was 100,403 MW whereas peak demand met during the same period was 86,425 MW and hence the peak shortage stood at 13,978 MW (13.9%).
Figure 1.9: Demand & supply gap has been keeping up against each other and widening.
1.2: Root of the Problem
So despite the increase in installed power and increase in plant load factor why do we still have such a dismal situation? Analysis points out two factors are responsible for this situation-
1. Inadequate generation of power
1.2.1: Cause #1- Insufficient Generation Capacity
From one small unit in 1880s to 1362 MW in 1947 to over 550 billion units in
2006-07. Per capita consumption of power in India has gone up significantly since the 1990s. According to these graphs and tables demand outruns supply creating a perennial problem that only deepens in the peak hours.
Figure 1.10: Demand & supply gap has been keeping up against each other and widening.
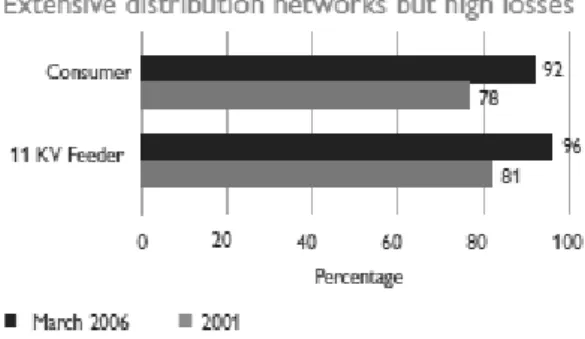
1.2.2: Cause#2- Dismal T&D infrastructure
A significant proportion of power is lost due to poor T&D infrastructure. It not only results in terrible loss of revenue but also it leaves an already power starved nation all the more power deficient.
Extensive network of sub-transmission and distribution systems have been set up in India. T & D losses have been consistently on the higher side and are presently in the range of 18 percent to 62 percent in various states. APDRP was identified in 2000-01 as
the key area to bring about the efficiency and improve financial health of the power sector - payoffs beginning to trickle in.
Chapter 2: Definitions of Key Words, and Review of Literature
2.1: Definition of Key Words
Alternative Sources of energy: In the context of subject matter, sources of energy other than conventional sources i.e. fossil fuel such as petroleum and coal. Some examples of alternative sources of power are solar power, geo-thermal power, wind power, nuclear power etc.
Gas Turbine5: A gas turbine is a rotary machine, similar in principle to a steam turbine. It consists of three main components - a compressor, a combustion chamber and a turbine. The air after being compressed into the compressor is heated either by directly burning fuel in it or by burning fuel externally in a heat exchanger. The heated air with or without products of combustion is expanded in a turbine resulting in work output, a substantial part, about two-thirds, of which is used to drive the compressor. The rest, about one-third, is available as useful work output.
Gas turbines for electricity generation6: Industrial gas turbines range in size from truck-mounted mobile plants to enormous, complex systems. They can be particularly efficient-up to 60%- when waste heat from the gas turbine is recovered by a heat recovery steam generator to power a conventional steam turbine in a combined cycle configuration. They can also be run in a cogeneration configuration: the exhaust is used for space or water heating, or drives an absorption chiller for cooling or refrigeration. A cogeneration configuration can be over 90% efficient. The power turbines in the largest industrial gas turbines operate at 3,000 or 3,600 rpm to match the AC power grid frequency and to avoid the need for a reduction gearbox. Such engines require a dedicated enclosure.
5 http://en.wikipedia.org/wiki/Gas_turbine#Gas_turbines_for_electrical_power_production
Advantages of gas turbine engines7
• Very high power-to-weight ratio, compared to reciprocating engines (ie. most road vehicle engines);
• Smaller than most reciprocating engines of the same power rating. • Moves in one direction only, with far less vibration than a reciprocating
engine.
• Simpler design.
• Low operating pressures. • High operation speeds.
• Low lubricating oil cost and consumption. Disadvantages of gas turbine engines
• Cost is much greater than for a similar-sized reciprocating engine (very high-performance, strong, heat-resistant materials needed);
• Use more fuel when idling compared to reciprocating engines. • Slow response to changes in power settings.
(These disadvantages explain why road vehicles, which are smaller, cheaper and follow a less regular pattern of use than tanks, helicopters, large boats and so on, do not use gas turbine engines, regardless of the size and power advantages imminently available. However gas turbine engines are suitable for constant rpm output situations such as generators.)
7 http://en.wikipedia.org/wiki/Gas_turbine
Distributed Generation (DG)8: Distributed generation generates electricity from many small energy sources. It has also been called on-site generation, dispersed generation, embedded generation, decentralized generation, decentralized energy or distributed energy. Instead of generating power in bulk on a single site and then carrying it through a grid for distribution, DG relies on generating power on or near the site of consumption thus eliminating the loss of power due to grid issues as well as the by-product (usually hot or cold water) can also be used for heating or cooling purpose.
Heat exchanger: Is a device or a sub-device built for efficient transfer of heat from one medium to another. It helps in extracting the heat in a medium which would otherwise go waste, thus enhancing the overall energy efficiency of a device.
Diesel generator set: An electric generator that depends on a internal combustion engine to rotate its shaft. The internal combustion engine uses diesel as fuel, thus bearing the name diesel generator set.
Energy efficiency: It pertains to any device that consumes a form of energy to transform it to either another form of energy or work output. The ration of input that is consumption of fuel or input energy to the output or output energy, determines the efficiency. An gas-turbine based generator when coupled with a heat exchanger can reach an efficiency of about 90%.
Picture 1.1: A rendering diagram of Micro Turbine generator and accompanying systems working synchronously, demonstrating the working of Distributed Generation system9
LPG10: Stands for Liquefied Petroleum Gas. It is a gas consisting primarily of propane, propylene, butane, and butylene in various mixtures, stored as a liquid by increasing pressure.
CNG: Compressed Natural Gas also called as liquefied natural gas (LNG).
9 Source: (Source: University of California, Irvine, Fuel Cell Research Centre.) 10 Source: www.energy.ca.gov/lng/glossary.html
2.2: Supportive literature
2.2.1: Literature On Feasibility Study
Definition of Feasibility Study-
In the article published by Hofstrand, Co-Director, Ag Marketing Resource Center, and Mary Holz-Clause, Co-Director, Ag, of Iowa State University- Don, the authors explain the mechanism of a feasibility study. q11As the name implies, a feasibility study is an analysis of the viability of an idea. The feasibility study focuses on helping answer the essential question of “should we proceed with the proposed project idea?” All activities of the study are directed toward helping answer this question.
Feasibility studies can be used in many ways but primarily focus on proposed business ventures. Farmers and others with a business idea should conduct a feasibility study to determine the viability of their idea before proceeding with the development of the business. Determining early-on that a business idea will not work: save time, money and heartache later.
A feasible business venture is one where the business will generate adequate cash-flow and profits, withstand the risks it will encounter, remain viable in the long-term and meet the goals of the founders. The venture can be a new start-up business, the purchase of an existing business, an expansion of current business operations or a new enterprise for an existing business. A feasibility study is only one step in the business idea
assessment and business development process.
Evaluate Alternatives
A feasibility study is usually conducted after producers have discussed a series of business ideas or scenarios. The feasibility study helps to “frame” and “flesh-out”
11 With inputs from Hofstrand, Co-Director, Ag Marketing Resource Center, and Mary Holz-Clause, Co-Director, Ag, of Iowa State University- Don,
specific business alternatives so they can be studied in-depth. During this process the number of business alternatives under consideration is usually quickly reduced.
During the feasibility process one may investigate a variety of ways of organizing the business and positioning ones product in the marketplace. It is like an exploratory journey and one may take several paths before one reaches ones destination. Just because the initial analysis is negative does not mean that the proposal does not have merit if organized in a different fashion or if there are market conditions that need to change for the idea to be viable. Sometimes limitations or flaws in the proposal can be corrected.
Pre-Feasibility Study12
A pre-feasibility study may be conducted first to help sort out relevant alternatives. Before proceeding with a full-blown feasibility study, one may want to do some pre-feasibility analysis of one’s own. If one finds out early-on that the proposed business idea is not feasible, it will save time and money. However, if the findings lead to proceed with the feasibility study, your work may have resolved some basic issues. A consultant (http://www.agmrc.org/agmrc/directories/agmrcdir/agmrcdir.htm) may help one with the pre-feasibility study, but one should be involved. This is an opportunity for one to under-stand the issues of business development.
Market Assessment13
A market assessment may be conducted to help determine the viability of a proposed product in the marketplace. The market assessment will help you identify opportunities in a market or market segment. If no opportunities are found, there may be no reason to proceed with a feasibility study. If opportunities are found, the market assessment can give focus and direction to the construction of business alternatives to
12
With inputs from Hofstrand, Co-Director, Ag Marketing Resource Center, and Mary Holz-Clause, Co-Director, Ag, of Iowa State University- Don,
http://www.extension.iastate.edu/agdm/wholefarm/html/c5-66.html
13With inputs from Hofstrand, Co-Director, Ag Marketing Resource Center, and Mary Holz-Clause,
Co-Director, Ag, of Iowa State University- Don,
investigate in the feasibility study. A market assessment will provide much of the information for the marketing section of the feasibility study.
Results and Conclusions
The conclusions of the feasibility study should outline in depth the various alternatives examined and the implications and strengths and weaknesses of each. The project leaders need to study the feasibility study and challenge its underlying
assumptions. This is the time to be skeptical.
One doesn’t expect an alternative to “jump off the page” as being the best one. Feasibility studies do not suddenly become positive or negative. As one accumulates information and investigates alternatives, neither a positive nor negative outcome may emerge. The decision of whether to proceed often is not clear cut. Major stumbling blocks may emerge that negate the project. Sometimes these weaknesses can be
overcome. Rarely does the analysis come out overwhelmingly positive. The study helps one assess the tradeoff between the risks and rewards of moving forward with the business project.
It is not the purpose of the feasibility study or the role of the consultant to decide whether or not to proceed with a business idea, it is the role of the project leaders.
Go/No-Go Decision
The go/no-go decision is one of the most critical in business development. It is the point of no return. Once you have definitely decided to pursue a business venture, there is usually no turning back. The feasibility study would be a major information source in making this decision. This indicates the importance of a properly developed feasibility study.
Feasibility Study vs. Business Plan14
14With inputs from Hofstrand, Co-Director, Ag Marketing Resource Center, and Mary Holz-Clause,
Co-Director, Ag, of Iowa State University- Don,
A feasibility study is not a business plan. The separate roles of the feasibility study and the business plan are frequently misunderstood. The feasibility study provides an investigating function. It addresses the question of “Is this a viable business venture?” The business plan provides a planning function. The business plan outlines the actions needed to take the proposal from “idea” to “reality.”
The feasibility study outlines and analyzes several alternatives or methods of achieving business success. So the feasibility study helps to narrow the scope of the project to identify the best business model. The business plan deals with only one alternative or model. The feasibility study helps to narrow the scope of the project to identify and define two or three scenarios or alternatives. The consultant conducting the feasibility study may work with the group to identify the “best” alternative for their situation. This becomes the basis for the business plan.
The feasibility study is conducted before the business plan. A business plan is prepared only after the business venture has been deemed to be feasible. If a proposed business venture is considered to be feasible, then a business plan constructed that provides a “roadmap” of how the business will be created and developed. The business plan provides the “blueprint” for project implementation. If the venture is deemed not to be feasible, efforts may be made to correct its deficiencies, other alternatives may be explored, or the idea is dropped.
Reasons Given Not to Do a Feasibility Study
Project leaders may find themselves under pressure to skip the “feasibility analysis” step and go directly to building a business. Individuals from within and outside of the project may push to skip this step.
Situations when a feasibility analysis is not required are:
• When we know a business plan is feasible. An existing business is already doing it. • When a feasibility study was done just a few years ago, so why do another one?
• When it is amply clear that the feasibility studies are just a way for consultants to make money.
• When a feasibility analysis has already been done by the business that is going to sell us the equipment.
• When one business can just hire a general manager who can do the study.
• Feasibility studies are a waste of time when a business needs to buy the building, tie up the site and bid on the equipment.
The reasons given above should not dissuade one from conducting a meaningful and accurate feasibility study. Once decisions have been made about proceeding with a proposed business, they are often very difficult to change. One may need to live with these decisions for a long time.
Reasons to Do a Feasibility Study
Conducting a feasibility study is a good business practice. If one examines successful businesses, one will find that they did not go into a new business venture without first thoroughly examining all of the issues and assessing the probability of business success.
Below are other reasons to conduct a feasibility study. • It gives focus to the project and outline alternatives • It narrows business alternatives
• It surfaces new opportunities through the investigative process • It identifies reasons not to proceed
• It enhances the probability of success by addressing and mitigating factors early on that could affect the project
• It helps to increase investment in the company
• It provides documentation that the business venture was thoroughly investigated • It helps in securing funding from lending institutions and other sources
http://www.puc.state.tx.us/electric/business/dg/dgmanual.pdf
2.2.2 Literature of Distributed Generation Systems
Distributed energy resources (DER) or Distributed Generation (DG)
15
Distributed energy resource (DER) refers to systems that are small-scale power generation technologies (typically in the range of 3 kW to 10,000 kW) used to provide an alternative to or an enhancement of the traditional electric power system. The common problem with distributed generators are their high costs. The one exception is probably micro-hydropower. A well-designed plant has nearly zero maintenance costs per kWh, and generates useful power for many years.
One favored source is solar panels on the roofs of buildings. The production cost is $0.99 to 2.00/W (2007) plus installation and supporting equipment unless the
installation is DIY bringing the cost to $6.50 to 7.50 (2007). This is comparable to coal power plant costs of $0.582 to 0.906/W (1979), adjusting for inflation. Nuclear power is higher at $2.2 to $6.00/W (2007). Most solar cells also have waste disposal issues, since solar cells often contain heavy-metal electronic wastes, (CdTe and CIGS), and need to be recycled. The plus side is that unlike coal and nuclear, there are no fuel costs, pollution, mining safety or operating safety issues. Solar also has a low duty cycle, producing peak power at local noon each day. Average duty cycle is typically 20%.
Another favored source is small wind turbines. These have low maintenance, and low pollution. Construction costs are higher ($0.80/W, 2007) per watt than large power plants, except in very windy areas. Wind towers and generators have substantial insurable liabilities caused by high winds, but good operating safety. Wind also tends to be
complementary to solar; on days there is no sun there tends to be wind and vice versa. Many distributed generation sites combine wind power and solar power such as Slippery Rock University, which can be monitored online.
Distributed cogeneration sources use natural gas-fired microturbines or
reciprocating engines to turn generators. The hot exhaust is then used for space or water heating, or to drive an absorptive chiller for air-conditioning. The clean fuel has only low pollution. Designs currently have uneven reliability, with some makes having excellent maintenance costs, and others being unacceptable.
Co-generators are also more expensive per watt than central generators. They find favor because most buildings already burn fuels, and the cogeneration can extract more value from the fuel.
Some larger installations utilize combined cycle generation. Usually this consists of a gas turbine whose exhaust boils water for a steam turbine in a Rankine cycle. The condenser of the steam cycle provides the heat for space heating or an absorptive chiller. Combined cycle plants with cogeneration have the highest known thermal efficiencies, often exceeding 85%.
In countries with high pressure gas distribution, small turbines can be used to bring the gas pressure to domestic levels whilst extracting useful energy. If the UK were to implement this countrywide an additional 2-4 GWe would become available. (Note
that the energy is already being generated elsewhere to provide the high initial gas pressure - this method simply distributes the energy via a different route.)
DER/DG systems may include the following devices/technologies: • Combined heat power (CHP)
• Fuel cells
• Micro combined heat and power (MicroCHP) • Microturbines
• Photovoltaic Systems • Reciprocating engines • Small Wind power systems • Stirling engines
Summary of DG Technologies
This Appendix provides brief descriptions of leading DG technologies. For context, it includes generic cost and performance information. Readers should note that for any given situation it is important to consult with vendors or their agents or dealers regarding actual price. To assist, this Appendix includes a list of links to World Wide Web sites for many leading DG equipment vendors.
Introduction
Distributed generation (DG) systems may be comprised of one or more primary technologies such as internal combustion engines, combustion turbines, photo-voltaics,
and batteries. Innumerable combinations of DG technology/fuel options are possible, to take advantage of synergies between individual technologies, making them as robust and/or cost-effective as possible.
Most DG systems operate on gaseous or liquid hydrocarbon fuel to produce electricity as needed; natural gas fuel is piped in; diesel fuel is stored on-site. Battery systems store electric energy from the grid for use when needed. Renewable energy DGs use solar or wind energy as fuel.
One important DG type category is the duty cycle for the DG is used:
1) for “peaking” duty cycle applications DGs only operate for a small portion of the year, usually between 50 – 600 hours annually, and
2) for “baseload” duty cycle DGs operate for many hours per year for.
Peaking duty distributed generation tends to have relatively low installed cost and can take on load in just a few minutes (or less). It tends to be relatively inefficient and have significant air emissions per hour operated. Peak duty cycle DGs usually operate for just a few hundred hours between overhauls. Typical installed costs range from about $200 – $500/kW and non-fuel operating cost ranges from 1¢ - 5¢/kWh. Primary distributed generation technologies used for base load duty cycle (when compared to peaking duty cycle described above) tend to be fuel efficient, reliable, and clean burning combustion-based options. Typical installed costs range from about $400 – $800/kW and non-fuel operating cost ranges from ½¢ - 3¢/kWh. 4 Perhaps one of the best examples is an uninterruptible power supply (UPS) that can carry a facility’s load for several minutes combined with a diesel engine generator that takes a few minutes to come on line. Batteries are an expensive way to store/provide a significant amount of electric energy.
So in this case the synergy is that once running, the diesel generator provides much lower cost energy.
Most types of distributed generation can provide useful and valuable thermal energy. To do so, additional equipment (e.g., pipes and pumps) is added to the generation system so that during electricity generation otherwise wasted heat energy is captured and used to heat water or air, or for processes. This concept is often referred to as combined heat and power (CHP) or cogeneration. Depending on type of generator used, existing thermal energy infrastructure in the facility, and many other project specific factors, equipment for CHP can add 25% - 100% to the installed cost for a generation-only system. Important “enabling” subsystems include: • power conditioning equipment such as electricity generator, transformer, and inverters
• controls
• communications
• fuel handling and/or fuel storage • emission controls
• sound attenuation enclosures.
Internal Combustion/Reciprocating Engine Generators
An internal combustion reciprocating (piston-driven) engine generator set (genset) includes an internal combustion engine as prime mover coupled with an electric generator and often control and power conditioning subsystems. Sound attenuation enclosures may be also needed.
1) compression ignition of fuel — the diesel cycle in which fuel combustion occurs as fuel is compressed causing heat leading to ignition.
2) “spark-ignited” combustion of fuel — the Otto cycle characterized by how fuel spark ignition of fuel (gasoline fueled automobile engines employ the Otto cycle).
These are described in more detail below.
Diesel Engine Generators
Diesel engine generator sets (gensets) consists of a diesel cycle reciprocating engine prime mover, burning diesel fuel, which is coupled to an electric generator. The diesel engine operates at a relatively high compression ratio and at relatively low rpm (compared to Otto cycle/spark engines and to combustion turbines described below). Diesel engine gensets are very common, especially in areas where grid power is not available or is unreliable. They are manufactured in a wide range of sizes up to 15 MW; however, for typical distributed energy applications multiple small units, rather than one large unit, are installed for added reliability. These power plants can be cycled frequently and operate as peak load power plants or as load-following plants. In some cases, usually at sites not connected to a power grid, diesel gensets are used for baseload operation (sometimes referred to as "village" power). Diesel gensets are proven, cost-effective, and extremely reliable, and should have a service life of 20 to 25 years if properly maintained. Installed cost for diesel engines varies significantly. Used/refurbished models can cost as little as $200/kW and newer, more robust, more efficient machines costing $500/kW or more. Depending on duty cycle and engine design, non-fuel O&M for diesel gensets operating on diesel fuel can vary widely, typically ranging from 2.5¢/kWh - 4¢/kWh, with an allowance for overhauls. Frequent cycling increases O&M costs considerably.
Though fuel conversion efficiency for diesels engines can exceed 43% (fuel input of about 7,900 Btu/kWhe, HHV), typical heat rates range widely from 8,000 Btu/kWhe to 10,000 Btu/kWhe (HHV).
“Dual Fuel” Diesel Engine Generators
A dual-fuel engine is a diesel (cycle) engine modified to use mostly natural gas. Diesel cycle engines cannot operate on natural gas alone because natural gas will not combust under pressure like diesel fuel does, so they must operate in what is called “dual fuel” mode. For that, natural gas is mixed with a small portion of diesel fuel so that the resulting fuel mixture (i.e., 5 – 10% diesel fuel) does combust under pressure. This requires de-rating of and modest modifications to a diesel cycle engine. (Note: for the same displacement a diesel engine operating on natural gas generates less power than the same sized engine operating on diesel fuel only).
Although diesel engines are common, dual fuel versions are not. But because the underlying technology is commercial and well known, in theory natural gas fired versions (for power generation) could become much more common in sizes ranging from
kilowatts to megawatts. For distributed energy systems small multiple unit systems would probably be installed, rather than one single large unit, to improve electric service
reliability. Dual fuel gensets can be cycled frequently to provide peaking power or “load-following” or they can be used for baseload or cogeneration applications. They employ mostly well-proven technology and are very reliable. Service life should be at least 20 to 25 years if properly maintained.
Non-fuel O&M cost is similar to that for diesel gensets. It typically ranges from 2 – 4 ¢/kWh including allowance for overhauls. Typical heat rates (HHV) also have a wide range, from 8,200 Btu/kWhe to 10,000 Btu/kWhe.
Spark Ignited/Otto Cycle Engine Generators
Spark-ignited combustion (Otto cycle) reciprocating engines are very common. They range in power output of less than a horsepower to megawatts. Perhaps the most familiar use for these engines is for automobiles. For stationary power applications including DG a system includes the engine, internal combustion engine as prime mover coupled with an electric generator. The engine prime mover is usually one of two types: Although spark-ignition engines designed to use gasoline are common, natural gas fueled versions are not so common. However, because the underlying technology is commercial and well known, in theory, natural gas fired versions (for power generation) could become much more common for a variety of applications and load sizes. Natural gas-fueled reciprocating engine gensets can be cycled frequently to provide peaking power or “load-following” or they can be used for baseload or cogeneration applications. They employ mostly well-proven technology and are very reliable. Service life should be at least 20 to 25 years if properly maintained. Installed cost tends to range between
$400/kW – $600/kW. O&M cost is similar to and possibly somewhat lower than that for diesel gensets. It typically ranges from 2¢/kWh –4.5¢/kWh. Typical heat rates (HHV) also have a wide range, from 8,800 to 10,500 Btu/kWh.
Combustion Turbines
Combustion turbines (also called gas turbines) burn gaseous or liquid fuel to produce electricity in a relatively efficient, reliable, cost-effective, and in some instances
clean manner. Generically, combustion turbines s are "expansion turbines" which derive their motive power from the expansion of hot gasses—heated with fuel—through a turbine with many blades. The resulting high-speed rotary motion is converted to electricity via a connected generator using the Brayton heat cycle. A full generation system consists of the turbine itself, a compressor, a combustor, power conditioning equipment (usually electricity generator and transformer), a fuel handling subsystem, and possibly other subsystems. They may also include a sound attenuation enclosure.
Combustion turbine generation systems are commonplace as electricity generators and are available in sizes from hundreds of kilowatts to very large units rated at hundreds of megawatts.
Combustion turbine systems have a moderate capital cost, but they often are used to burn relatively high cost distillate oil or natural gas. Combustion turbine generation systems should have a minimum service life of 25 - 30 years if properly maintained and depending on how and how often they are used. Depending on the size, type, and application, full-load heat rates (HHV) for commercial equipment can range from 8,000 Btu/kWh to 14,000 Btu/kWh. Non-fuel O&M costs are relatively low – typically ranging from ½ ¢/kWh - 5 ¢/kWh. Variation is a function of criteria such as turbine size, turbine age, turbine materials, turbine complexity/simplicity, reliability required, availability of components, and maintenance protocol/frequency. Combustion turbines can start and stop quickly and can respond to load changes rapidly making them ideal for peaking and load-following applications. In many industrial cogeneration applications they would also make excellent sources of baseload power, especially at sizes in the 5 to 50 MW range.
“Conventional” Combustion Turbine Generators
Conventional combustion turbine generators vary significantly in price, size, and are designed for a wide range of duty cycles. Typical sizes range from 1 to 300 MW. Smaller turbines used for stationary power generation are often those developed for transportation applications, especially for marine vessels and airplanes. (Note that for those applications reliability and in some cases fuel efficiency are important performance criteria.) Installed costs range from as low as $300/kW for refurbished units and lighter duty machines to 700 - $800/kW for heavier duty/more efficient versions, with non-fuel O&M ranging from .75¢/kWh - 4¢/kWh depending in large part on the intended duty cycle and on maintenance practices.
Microturbine Generators
Microturbines are small versions of traditional gas turbines, with very similar operational characteristics. They are based on designs developed primarily for
transportation-related applications such as turbochargers and power generation in aircraft. In general, electric generators using microturbines as the prime mover are designed to be very reliable with simple designs, some with only one moving part. Typical sizes are 20 to 300 kW. Microturbines are "near-commercial" with many demonstration and
evaluation units in the field. Several companies, some of which are very large, are committed to making these devices a viable, competitive generation option. One key characteristic of microturbines is that their simple design lends itself to mass
production—should significant demand materialize. For the most part, prices too are still being established. Possibly the key driver will be manufacturing scale. Installed price is
currently in the range of about $1,000/kW – 1,500/kW. Definitive data on reliability, durability, and non-fuel O&M costs are just being developed though based on simplicity and in some cases well-proven designs non-fuel O&M could be similar to that of
conventional combustion turbines. Fuel efficiency tends to be somewhat or even significantly lower than that of larger combustion turbines and internal combustion
reciprocating engines, ranging from 10,000 Btu/kWhe –15,000 Btu/kWhe. Note, however, that if microturbines are used in situations involving use of steam and/or hot water, then they can generate electricity and thermal energy (combined heat and power, CHP) cost-effectively due to a) the temperatures involved and b) the large amount of waste heat produced.
Advanced Turbine System (ATS) Generators
The Advanced Turbine System (ATS) was developed as a small, efficient, clean, lowcost, power generation prime mover by Solar Turbines in conjunction with the U.S. Department of Energy. It employs the latest combustion turbine design philosophy and state-of-the-art materials. It generates 4.2 MW. Fuel requirements are about 8,800 – 9,000 Btu/kWh (LHV). Installed cost is expected to be about $400/kW, with non-fuel O&M expected to be below ½¢ per kWh generated.
Fuel Cells
Fuel cells are energy conversion devices that convert hydrogen (H2) or high-quality (hydrogen-rich) fuels like methane into electric current without combustion and with minimal environmental impact. Due in part to how fuel cells convert fuel to electricity (i.e., without combustion) conversion is relatively efficient and fuel cells'
emissions of key air pollutants are much lower than for combustion technologies, especially nitrogen oxides (NOx). Fuel cells are very modular (from a few watts to one MW). Fuel cells are often categorized by the type of electrolyte used. The most common electrolyte for fuel cells used for stationary power is phosphoric acid; others include solid oxide and molten carbonate. Another promising type of fuel cell utilizes a proton
exchange membrane, hence the name PEM fuel cell.
A fuel cell system consists of a fuel processor, the chemical conversion section (the fuel cell "stack"), and a power conditioning unit (PCU) to convert the direct current (DC) electricity from the fuel cell's stack into alternating current (AC) power for the grid or for loads and for supporting hardware such as gas purification systems. Unless
hydrogen is used as the fuel, prior to entering the fuel cell stack, the raw fuel (e.g., natural gas) must be dissociated into hydrogen and a supply of oxygen from air must be available. Within the fuel cell stack, the hydrogen and oxygen react to produce a voltage across the electrodes, essentially the inverse of the process which occurs in a water electrolyzer.
There are hundreds of fuel cells in service worldwide and the number of units in service is growing rapidly. Advocates are awaiting expected manufacturing advances that will reduce fuel cells' equipment cost and improve its efficiency such that they produce very low cost energy. Typical plant unit sizes (which can be aggregated into any plant output rating needed) are expected to range widely from a few kW to 200 kW. Currently available fuel cells based on phosphoric-acid electrolytes have heat rates (HHV) of 9,500 Btu/kWhe – 10,000 Btu/kWhe and cost about $3000/kW installed. Nonfuel O&M for installed devices is about 2.5¢/kWh – 3¢/kWh.
Advanced fuel cells systems are expected to have efficiencies of ranging from 40% to perhaps as high as 55%. (6,300 Btu/kWhe - 8,500 Btu/kWhe) over the next 5 years and
ultimately to cost less than $1000/kW installed.
Energy Storage Systems
Energy storage systems used for DG applications include devices that store energy: a) electrochemically or b) as mechanical energy, and which “discharge”
electricity for use when needed. Battery energy storage systems consist of the battery and a power conditioning unit (PCU) sub-system to convert grid power from alternating current (AC) power to direct current (DC) power during battery charging, and to convert battery power from DC to AC power during battery discharge.
Most batteries can change their rate of discharge/storage in milliseconds. Note that there are two key elements to energy storage plant cost (unlike generators with just one). They are: 1) output rated in Watts (or Volt-amps) indicating the rate at which the system can “discharge: (i.e. provide energy to a load) and 2) the energy storage capacity, the amount of energy that can be stored (rated in kilowatt-hours). Storage is used for a variety of applications, such as:
• increase reliability—for longer duration power outages
• reduce impacts from an electric supply’s poor power quality—for shorter duration electric service disruptions
of peak shaving (electric demand reduction) opportunities • to reduce peak demand on a local electricity infrastructure
Electrochemical batteries are by far the most common type of battery, primarily these are the “lead-acid” type, though other types are emerging as competitive options. They are proven, reliable, and highly modular. A robust international industry exists to support use of electrochemical batteries. Off the shelf and, in the future, “advanced” battery systems will be viable for distributed energy systems. Plant costs range from about $200 - $300 per kW of maximum power output/discharge, and about the same to somewhat higher installed cost for each kWh of energy storage “reservoir” capacity ($200/kWh - $400/kWh of storage capacity). O&M for electrochemical includes replacement of battery cells and secondarily periodic watering of the cells and periodic maintenance of the PCU. Non-fuel O&M ranges from .75¢/kWh – 1.5 ¢/kWh. “Round-trip” energy efficiency (AC to DC to AC, or charge-discharge) usually ranges from 65% - 75%. There may be limited hazardous emissions from battery charging and some
batteries contain hazardous material(s).
Superconducting magnetic energy storage (SMES), flywheels, “supercapacitors” are emerging alternatives to electrochemical batteries. These devices tend to be more efficient. SMES units may be superior for larger scale applications. SMES units are being used commercially in the U.S. to stabilize voltage on transmission lines. Flywheels and supercapacitors are more modular and tend to be relatively light. In addition be being a discreet system type, often energy storage is a key subsystem within systems employing other types of DG. Depending on the type of system, energy storage does one or more of the following: a) provide power for loads during engine start-up, b) provide electric
energy needed to start the engine itself, or c) store electric energy from the DG system (or even the utility grid) for later use.
Uninterruptible Power Systems (UPS)
UPSs are connected to specific equipment, buildings or entire facilities with critical loads to provide protection from power fluctuations lasting from just a few milliseconds to a few minutes. Specifically they provide: a) filtered/high quality power on a continuous basis and/or b) energy for use during power outages lasting several minutes. Often they have sufficient energy to power loads long enough to allow orderly shutdowns (e.g. of information or process equipment). UPSs can either be stand-by or in-line. Stand-by devices monitor the line (power source) and provide energy as needed when problems are detected. In-line systems are connected between the power source and the load and thus can provide very complete, continuous filtering of grid power, although “throughput” losses can be as high as 40%.
Photovoltaics (PV)
Photovoltaics are semiconductor devices which convert sunlight directly to DC electricity; power conditioners (inverters) are used to convert the DC to standard AC power. Photovoltaic cells are thin layers of semiconductor (usually crystalline silicon). The cells are integrated in series and parallel into a module which is easily mountable on a structure. Modules can be attached to fixed surfaces, accepting output variations due to the sun’s position, or they can be made to track the sun for maximum output.
Photovoltaic systems using crystalline silicon are readily available. However, PV lifecycle and equipment costs are not competitive with more conventional generation technology for large-scale generation applications. Conversely, PV is cost-effective in a growing number of circumstances for applications requiring low power and/or small amounts of energy. Therefore remote installations and niche applications (e.g., power for communications systems, roadside emergency cellular phones, and off-grid homes) are the most common applications for PV. Photovoltaic energy production can vary
dramatically from one day to the next—due mostly to weather, and from one region to the next—due mostly to differences in latitude and weather. Frequently, battery storage and/or diesel genset systems are integrated with photovoltaics to carry loads through times when sunlight does not provide enough energy.
PV systems can cost between $5,000 - $10,000/kW installed, with variation driven mostly by system maximum output and cost for subsystems used such as inverters, integrated engine-generator, battery energy storage.
Controls Systems in DG
Control subsystems perform a variety of tasks within a DG system including: 1) engine start up and shut down, 2) managing how/how much fuel is used, 3) energy storage charge/discharge control, 4) communications between DG subsystems and with external systems, 5) monitoring and recording key performance and operational
parameters, and 6) system diagnostics.
Unless a DG system provides power in the form needed by loads, some type of power conditioning is required. For example, fuel cells, photovoltaics and battery systems produce direct current electricity. Power conditioning equipment called inverters are used to convert DC electricity to alternating current (AC) electricity used by most types of electricity-using equipment. Reciprocating engines and combustion turbines create “rotational” mechanical power that must be converted to electricity. To do that the engine is attached to a generator. Generators create electricity via electromagnetism using coils of wire and magnets (electricity is created by the motion of the wire coils or magnets relative to each other). Generators used with combustion turbine and reciprocating engine based DG systems usually produce electricity at frequencies and voltages that may have to be modified being used by loads. Step-up or step-down transformers are used to increase/decrease voltage respectively.
Data Caveats
Cost and performance information presented herein is based on data from various sources. In many cases manufacturers supplied their best current data or they developed
estimations based on projected costs or fuel efficiency. Installed cost for actual distributed generation projects are usually quite site-specific.
Wind
A wind generation system (a.k.a. wind turbine) converts the kinetic energy in wind (moving air) into mechanical work and then to electric energy. Key subsystems include: airfoil shaped blades; a rotor (to which blades are attached) that converts wind energy to rotational shaft energy; a drive train, usually including a gearbox; a tower that supports the rotor and drive train, a generator that converts mechanical energy to
electricity, and power conditioning that converts the electricity generated into a form (Voltage and current frequency) used by the grid. Systems also include other equipment such as electrical wires, ground support equipment, interconnection gear, and controls. During generation wind passes over both surfaces of the airfoil shaped blade; air passes over the longer (upper) side of the airfoil more rapidly than it moves past the underside, creating a lower-pressure area above the airfoil. The pressure differential between top and bottom surfaces results in a force called aerodynamic lift (the same phenomenon that causes aircraft wing use this phenomenon to “lift” an airplane). Wind turbine electric power output varies with wind speed. The "rated wind speed" is the wind speed at which the "rated power" is achieved and generally corresponds to the point at which the
conversion efficiency is near its maximum. In many systems power output during times when wind speed exceeds the rated wind speed, turbine speed is maintained at a constant level, allowing more stable system control. Note that at lower wind speeds, the power output drops off sharply as turbine output is a function of the cube of the wind speed (e.g.; power available in the wind increases eight times for every doubling of wind speed). Individual wind generation systems range in electrical output from a few Watts to over 1 MW and can be used for applications including small/residential electricity production to utility scale power generation. In both cases power from the turbine must be converted to the form used by the grid before being transferred to the grid (i.e., the process called power conditioning). For large scale applications turbines are often constructed in “wind farms” whose total output can range from tens to hundreds of MW.
2.2.3: Literature on Utility Market Deregulation Markets for Power- Electric Utility Industry Deregulation
In the book, An Analysis of Electrical Utility Deregulation, authored by Paul L. Joskow and Richard Schmalensee the authors (Paul L. Joskow is Professor of Economics and Richard Schmalensee is Professor of Applied Economics, both at MIT) provide an unusually complete analysis of the economic, technical, and institutional aspects of the electric utility industry. The authors evaluate four currently popular options for
deregulating this unique segment of the economy, and in a balanced program for reform, they advise against total deregulation and recommend a cautious approach to even partial deregulation.
The Electric Power Industry: Economic, Technical, and Institutional Background
The book presents the fact that Electricity and the industry that supplies it are of
fundamental and growing importance to the U.S. economy. Both an important consumer of primary resources and a supplier of usable energy to homes, stores, and factories, the electric utility industry make possible the many services that we associate with modern life in a developed economy. In 1981 electric utilities accounted for a third of US energy consumption, up from 15 percent in 1951.
1) During this period the production of electricity increased at a rate more than twice that of the real (inflation - adjusted) gross national product.
2) The relative importance of electricity as a source of energy in the economy has continued to increase since the 1973 oil embargo and is likely to continue to increase. Today revenues from final sales of electricity are nearly $100 billion per year. Not only does electricity production account for a large fraction of primary energy consumption, it
also requires enormous amounts of capital. The net book value of electric utility assets of investor –owned utilities was $215 billion at the end of 1980.
3) This figure reflects the historical costs of old, long -lived plant and equipment. The cost of replacing these assets today would be much higher. As a result of its rapid growth and capital intensity, the electric utility industry has been an important source of investment spending in the US economy. Between 1971 and 1980 construction
expenditures by investor –owned utilities amounted to about 10 percent of gross private domestic nonresidential fixed investment.
4) Electricity has played an important role in the growth of the US economy. It can play an important role in the future growth of the economy as well if an adequate supply of electricity, provided as efficiently as possible, is available to residential, commercial, and industrial consumers. Because of the important role that electricity has played historically and potentially may play in the growth and development.
The Electric Power Industry and Sources of Recent Interest in Reform
The current lively interest in reform of the electric power industry and its regulation has a number of sources. Consumers are dissatisfied with the rapidly rising costs of electricity. Although these increases can be explained by rises in fuel costs, construction costs, interest rates, and of the US economy, the behavior and performance of this industry is subject to ongoing public scrutiny. The fact that the industry is subject to pervasive government regulation and depends on public enterprises for a significant fraction of production has made such scrutiny more contentious than it otherwise might be.
Heated debates about public policy toward electric power have occurred
throughout the industry’s history. Indeed the structure, behavior, and performance of the electric power industry and the way it is regulated have been controversial almost from the day that Thomas Edison’s first central station power plant was placed in operation in New York City in September 1882. Fifty years ago vigorous debate centered on whether the role of government in this industry should be increased, with public enterprise replacing regulated private enterprise. Currently in the wake of deregulation in other sectors of the US economy, a central issue is whether the role of government in electric power should be reduced, with market forces replacing government regulation as the guarantor of acceptable industry performance.
This study is concerned with evaluating proposals to deregulate various aspects of electricity production and pricing. To make such an evaluation, it is necessary to develop a clear and consistent analytical framework, to specify the objectives of public policy in this area, and to spell out the requirements for achieving those objectives. It is also necessary to understand the particular technical, economic, and institutional
characteristics of this industry rather than to attempt to make judgments on the basis of real or imagined analogies with other sectors of the economy.
Once these two important steps have been taken, appropriate theoretical and empirical tools can be brought to bear to evaluate the likely consequences of alternative reform proposals and to delineate the associated risks and uncertainties. This basic analytical approach, which combines attention to empirical detail with careful application of relevant theoretical principles, can and should be used to evaluate both deregulation