Abstract—The feature selection process can be considered a problem of global combinatorial optimization in machine learning, which reduces the number of features, removes irrelevant, noisy and redundant data, and results in an acceptable classification accuracy. Feature selection is of great importance in pattern classification, medical data processing, machine learning, and data mining applications. Therefore, a good feature selection method based on the number of features investigated for sample classification is needed in order to speed up the processing rate, predictive accuracy, and to avoid incomprehensibility. In this paper, particle swarm optimization (PSO) is used to implement a feature selection, and support vector machines (SVMs) with the one-versus-rest method serve as a fitness function of PSO for the classification problem. The proposed method is applied to five classification problems from the literature. Experimental results show that our method simplifies features effectively and obtains a higher classification accuracy compared to the other feature selection methods.
Index Terms—Feature Selection, Machine Learning, Particle Swarm Optimization, Support Vector Machines.
I. INTRODUCTION
For many pattern classification problems, a higher number of features used do not necessarily translate into a higher classification accuracy. In some cases the performance of algorithms devoted to speed and predictive accuracy of the data characterization can even decrease. Therefore, feature selection can serve as a pre-processing tool of great importance before solving the classification problems. The purpose of the feature selection is to reduce the maximum number of irrelevant features while maintaining an acceptable classification accuracy. A good feature selection method can reduce the cost of feature measurement, and increase classifier efficiency and classification accuracy. Feature selection is of considerable importance in pattern classification, data analysis, multimedia information retrieval, medical data processing, machine learning, and data mining applications.
Manuscript received March 31, 2006. This research was supported by the National Science Council, R.O.C., under grant NSC 94-2614-E-151-001.
C. -J. Tu is with the Department of Electronic Engineering, National Kaohsiung Univeristy of Applied Sciences, Kaohsiung, Taiwan 80708. (e-mail: [email protected]).
L. -Y. Chuang is with the Department of Chemical Engineering, I-Shou Univeristy, Kaohsiung, Taiwan 80708. (e-mail: [email protected]).
C. -H. Yang, is with the Department of Electronic Engineering, National Kaohsiung Univeristy of Applied Sciences, Kaohsiung, Taiwan 80708. (e-mail: [email protected]).
J. -Y. Chang is with the Department of Information Management, National Kaohsiung Univeristy of Applied Sciences, Kaohsiung, Taiwan 80708. (e-mail: [email protected]).
Several methods have been previously used to perform feature selection on training and testing data, for example genetic algorithms (Raymer et al., 2000), branch and bound algorithms (Narendra et al., 1977), sequential search algorithms (Pudil et al., 1994), mutual information (Roberto, 1994), and tabu search (Zhang et al., 2002). In order to obtain better classification accuracy for classification problems, an improved feature selection process is needed.
Many SVMs have been successfully applied to gene expression data classification problems (Furey et al., 2000; Guyon et al., 2002; Lee et al., 2003) since they are not negatively affected by high dimensionality; hence they can obtain a higher accuracy than a general classification methods, SVMs obtain a maximum margin of a hyper-plane in order to optimize the obtained support vector machine. This avoids a common disadvantage of general classification methods, namely the long operation time, and can reduce training errors of the SVMs.
In this paper, PSO is used to implement a feature selection, and SVMs with the one-versus-rest method were used as evaluators for the PSO fitness function for five multiclass problems taken from the literature. The results reveal that our method elucidated a better accuracy than the classification methods they were compared to.
This paper is organized as follows: in the next section, the methods used are introduced. They include particle swarm optimization, support vector machines, and the one-versus-rest method. Section 3 details the experimental results and contains a discussion. Results obtained by the proposed method are compared with results obtained by using other methods. Finally, concluding remarks are made in Section 4.
II. METHODS
A. Feature Selection Method
Particle swarm optimization (PSO) is a population-based stochastic optimization technique, and was developed by Kennedy and Eberhart in 1995. PSO simulates the social behavior of organisms, such as bird flocking and fish schooling, to describe an automatically evolving system. In PSO, each single candidate solution is "an individual bird of the flock", that is, a particle in the search space. Each particle makes use of its individual memory and knowledge gained by the swarm as a whole to find the best solution (Venter 2002). All of the particles have fitness values, which are evaluated by a fitness function to be optimized, and have velocities which direct the movement of the particles. During movement, each particle adjusts its position according to its own experience, as well as according to the experience of a neighboring particle,
Feature Selection using PSO-SVM
Chung-Jui Tu, Li-Yeh Chuang, Jun-Yang Chang, and Cheng-Hong Yang, Member, IAENG
IAENG International Journal of Computer Science, 33:1, IJCS_33_1_18
______________________________________________________________________________________
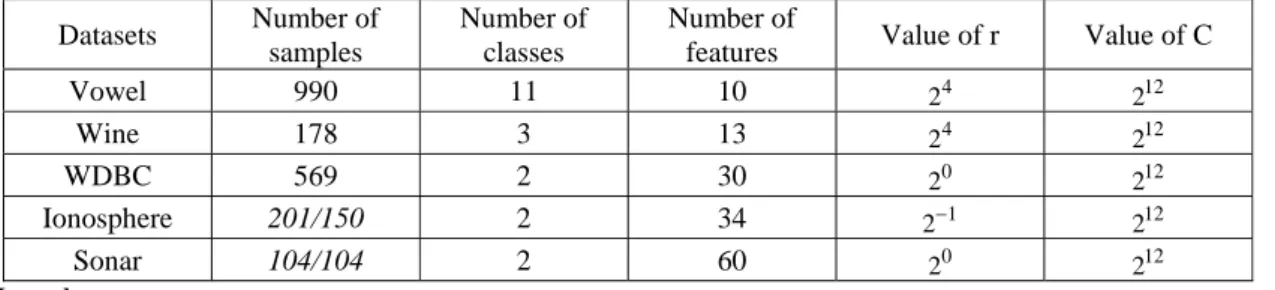
also result in useful data, but is a lot more time-consuming. If the adjustment is excessive, particle movement will also be excessive, causing the algorithm to weaken early, so that a useful feature set can not be obtained. Hence, suitable parameter adjustment enables particle swarm optimization to increase the efficiency of feature selection. For SVMs, correct parameter adjustment is crucial, since many parameters are involved. This can have a profound influence on the results. For different classification problems, different parameters have to be set for SVMs. The two factors r and C are especially important. A suitable adjustment of these parameters results in a better classification hyper-plane found by the SVM, and thereby enhances the classification accuracy. Bad parameter settings affect the classification accuracy negatively. In this paper, we used the parameters in Table 1 for all classification problems. The parameters settings used in our study were optimized, and could be used as a reference for future studies.
IV. CONCLUSIONS
Building an efficient classification model for classification problems with different dimensionality and different sample size is important. The main tasks are the selection of the features and the selection of the classification method. In this paper, we used PSO to perform feature selection and then evaluated fitness values with a SVM, which was combined with the one-versus-rest method, for five classification profiles. Experimental results show that our method simplified feature selection and the total number of parameters needed effectively, thereby obtaining a higher classification accuracy compared to other feature selection methods. The proposed method can serve as an ideal pre-processing tool to help optimize the feature selection process, since it increases the classification accuracy and, at the same time, keeps computational resources needed to a minimum. It could also be applied to problems in other areas in the future.
ACKNOWLEDGMENT
This work is partly supported by the National Science Council in Taiwan under grants NSC94-2622-E-151-025-CC3,
NSC94-2311-B037-001, NSC93-2213-E-214-037, NSC92-2213-E-214-036, NSC92-2320-B-242-004, NSC92-2320-B-242-013 and by the CGMH fund CMRPG1006.
REFERENCES
[1] Raymer, M.L., Punch, W.F., Goodman, E.D., Kuhn, L.A., and Jain, A. K., “Dimensionality Reduction Using Genetic Algorithms,” IEEE Trans. Evolutionary Computation, vol. 4, no. 2, pp. 164-171, July 2000. [2] Narendra, P.M. and Fukunage, K., “A Branch and Bound Algorithm for
Feature Subset Selection,” IEEE Trans. Computers, vol.6, no. 9, pp. 917-922, Sept. 1977.
[3] Pudil, P., Novovicova, J., and Kittler, J., “Floating Search Methods in Feature Selection,” Pattern Recognition Letters, vol.15, pp. 1119-1125, 1994.
[4] Roberto B., “Using mutual information for selecting features in supervised neural net learning,” IEEE Transactions on Neural Networks, 5(4):537-550, 1994.
[5] Zhang, H. and Sun, G.. Feature selection using tabu search method.
Pattern Recognition, 35: 701-711, 2002.
[6] Furey, T.S., Cristianini, N., Duffy, N., Bednarski, D.W., Schummer, M. and Haussler, D. (2000) Support vector machine classification and validation of cancer tissue samples using microarray expression data. Bioinformatics, 16, 906-914.
[7] Guyon, I., Weston, J., Barnhill, S. and Vapnik, V. (2002) Gene selection for cancer classification using support vector machines. Machine Learning, 46, 389-422.
[8] Lee, Y. and Lee, C.-K. (2003) Classification of multiple cancer types by multicategory support vector machines using gene expression data. Bioinformatics, 18, 1132-1139.
[9] Venter, G. and Sobieszczanski-Sobieski, J. Particle swarm optimization. Proceedings of the 43rd AIAA/ASME/ASCE/AHS/ASC Structures, Structural Dynamics, and Materials Conference, Denver, CO. 2002. [10] Stone, M., “Cross-Validation choice and assessment of statistical
predictions” Journal of the Royal Statistical Society B, 36,, 1974, pp.111-147.
[11] Kennedy, J.; Eberhart, R.C., “A discrete binary version of the particle swarm algorithm”, Systems, Man, and Cybernetics, 1997. 'Computational Cybernetics and Simulation'., 1997 IEEE International Conference on Volume 5, 12-15 Oct. 1997 Page(s):4104 - 4108 vol.5.
[12] Kennedy, J. and Eberhart, R.C., Particle swarm optimization, IN proceedings of the 1995 IEEE International Conference on Neural Networkds, volume 4, pages 1942-1948, Perth, Australia, 1995. [13] Frieß, T., N. Cristianini, and C. Campbell (1998), “The Kernel-Adatron: a
Fast and Simple Learning Procedure for Support Vector Machines,”
Proceedings of the Fifteenth International Conference on Machine Learning, pp. 188-196, 1998.
[14] Drucker, H., Burges, C., Kaufman, L., Smola, A. and Vapnik, V. (1997): Support Vector Regression Machines, In: Mozer, M., Jordan, M. and Petsche, T. (ed.), Neural Information Processing Systems, Vol. 9. MIT Press, Cambridge, MA, 155-161.
[15] Vapnik, V.N., The Nature of Statistical Learning Theory, Springer Verlag, 1995.
[16] Anlauf, J.K., and Biehl, M. (1989), The Adatron-an adaptive perceptron algorithm, Europhysics Letters, 10, 687-692.
[17] Opper, M. (1988). Learning Time of Neural Networks: Exact Solution for a Perceptron Algorithm. Physical Review A38:3824.
[18] Boser, B., Guyon, I., Vapnik, V. (1992), A training algorithm for optimal margin classifiers, Fifth Annual Workshop on Computational Learning Theory, ACM Press.
[19] Cortes, C., and Vapnik, V. (1995), Support Vector networks, Machine Learning 20:273-297.
[20] Colin, C. and Nello, C., “Simple Learning. Algorithms for Training Support Vector Machines,” 1998.
[21] Scholkopf, B. and Smola, A. (2002) Learning with Kernels: Support
Vector Machines, Regularization, Optimization and Beyond. MIT Press,
Cambridge, MA.
[22] Murphy, P.M., and Aha, D.W. UCI Repository of Machine Learning Databases. technical report, Department of Information and Computer Science, University of California, Irvine, Calif., 1994. Available: http://www.ics.uci.edu/~mlearn/MLRepository.html.
[23] Oh, I.-S., Lee, J.-S., and Moon, B.-R. Hybrid Genetic Algorithms for Feature Selection. IEEE Trans. Pattern Analysis and Machine
Table 1. Format of classification text problem Datasets Number of samples Number of classes Number of
features Value of r Value of C
Vowel 990 11 10 24 212 Wine 178 3 13 4 2 212 WDBC 569 2 30 0 2 212 Ionosphere 201/150 2 34 1 2− 212 Sonar 104/104 2 60 0 2 212 Legends:
x/y: indicate that x and y represent the number of test and train samples, respectively.
Table 2. Accuracy of classification for tested data
Legends: Highest values are in bold-type.
PSO-SVM Datasets d* SFS PTA SFFS SGA HGA
(1) HGA (2) HGA (3) HGA (4) d* % 2 62.02 62.02 62.02 62.02 62.02 62.02 NA NA 4 92.63 92.83 92.83 92.83 92.83 92.83 92.83 92.83 6 98.28 98.79 98.79 98.79 98.79 98.79 98.79 98.79 Vowel (D=10) 8 99.70 99.70 99.70 99.70 99.70 99.70 99.70 NA 7 99.49 3 93.82 93.82 93.82 93.82 93.82 93.82 93.82 NA 5 94.38 94.38 94.94 95.51 95.51 95.51 95.51 95.51 8 95.51 95.51 95.51 95.51 95.51 95.51 95.51 95.51 Wine (D=13) 10 92.13 92.13 92.70 92.70 92.70 92.70 92.70 92.70 8 100 6 93.15 93.15 94.20 93.67 94.90 94.90 93.99 93.99 12 92.62 92.97 94.20 94.38 94.38 94.38 94.38 94.38 18 94.02 94.20 94.20 93.85 94.20 94.20 94.20 94.20 WDBC (D=30) 24 92.44 93.50 93.85 93.85 93.85 93.85 93.85 93.85 13 95.61 7 93.45 93.45 93.45 95.44 95.73 95.73 95.73 95.73 14 90.88 92.59 93.79 94.87 95.73 95.73 95.73 95.73 20 90.03 92.02 92.88 94.30 94.30 94.30 94.02 94.30 Ionosphere (D=34) 27 89.17 91.17 90.88 91.45 91.45 91.45 91.45 91.45 15 97.33 12 87.02 89.42 92.31 93.75 94.71 95.67 95.19 95.67 24 89.90 90.87 93.75 95.67 96.63 96.63 97.12 97.12 36 88.46 91.83 93.27 95.67 96.15 96.15 96.15 96.15 Sonar (D=60) 48 91.82 92.31 91.35 92.79 92.79 93.27 93.27 93.27 34 96.15