New Approach to the Validity of the Alcohol Use
Disorders Identification Test: Stratum-Specific
Likelihood Ratios Analysis
Chun-Hsin Chen, Wei J. Chen, and Andrew T. A. Cheng
Background:Previous validation studies of the Alcohol Use Disorders Identification Test (AUDIT) used either the fixed-threshold approach or receiver operating characteristic (ROC) analyses. This study was aimed to conduct a stratum-specific likelihood ratio (SSLR) analysis on the validity of the AUDIT for detecting alcohol use disorders.
Methods:A two-phase validation study was conducted among nonpsychiatric inpatients at a general hospital, using the AUDIT for phase 1 screening and the Schedules for Clinical Assessment in Neuropsy-chiatry for the phase 2 interview. All of the patients with positive screening results and a subsample of the patients with negative screening results were interviewed in the second phase. The validity of the AUDIT for current alcohol use disorders was estimated using the ROC first, and an SSLR analysis was performed subsequently.
Results:In 422 inpatients who completed the screening, 193 had a negative result with a zero score, 103 had a negative result with a nonzero score, and 126 had a positive result. Twenty screened patients with a negative result and a nonzero score and 107 patients with a positive result were interviewed in the second phase, in which 59 patients were found to have current alcohol use disorders according to DSM-IV criteria. The area under the ROC curve of the AUDIT for current alcohol use disorders was 0.98. The sensitivity and specificity of the AUDIT at the optimal cutoff of 8 were 0.97 and 0.90, respectively. Three strata of the AUDIT scores (0 –7, 8 –13, andⱖ 14) were derived for alcohol use disorders, with the SSLRs being 0.04, 3.67, and 49.72, and the corresponding posttest probabilities being 0.01, 0.42, and 0.91, respectively.
Conclusions:The AUDIT is a valid screening tool for alcohol use disorders, and the three strata derived from the SSLR analysis are informative and readily applicable in clinical practice.
Key Words:Alcohol Use Disorders Identification Test, Validity, Receiver Operating Characteristic Curve, Stratum-Specific Likelihood Ratio.
T
HE ALCOHOL USE Disorders Identification Test
(AUDIT) (Babor et al., 1992), originally developed as a
screening instrument for use in primary care patients
(Saunders et al., 1993), has been widely used in various
settings and subgroups, such as medical settings (Bohn et
al., 1995), emergency rooms (Cherpitel, 1995),
occupa-tional health workers (Seppa et al., 1995), the elderly
(Mor-ton et al., 1996), college students (Aertgeerts et al., 2000),
and patients with mental illness (Dawe et al., 2000; Maisto
et al., 2000). Although originally designed for hazardous or
harmful use of alcohol, the AUDIT has been applied to
screening for alcohol use disorders (Allen et al., 1997;
Reinert and Allen, 2002).
The literature on the validity of the AUDIT in detecting
hazardous use or alcohol use disorders has recommended a
single threshold for classifying participants into two groups
according to positive or negative screening results (Allen et
al., 1997; Reinert and Allen, 2002). However, the optimal
cutoff point of the AUDIT for alcohol use disorders varied
from study to study, such as a score of 5 (Piccinelli et al.,
1997) or 8 (Volk et al., 1997). In addition, because of the
wide range of AUDIT scores, selecting a fixed threshold
may lose substantial information.
One way to avoid the limitation of traditional single
cutoff point approach is to use a receiver operating
char-acteristic (ROC) analysis (Hanley and McNeil, 1982), in
which the sensitivity is plotted against the (1-specificity) for
all of the possible cutoffs of a test. The area under the ROC
curve (AUC) can be interpreted as the global discriminatory
performance of a test. There have been several ROC analyses
of the AUDIT (Bohn et al., 1995; Bradley et al., 1998;
MacK-From the Department of Psychiatry, Taipei Medical University–Wan Fang Hospital, Taipei, Taiwan (C-HC); the Institute of Biomedical Sciences, Academia Sinica, Taipei, Taiwan (ATAC); and the Institute of Epidemiol-ogy, College of Public Health, National Taiwan University, Taipei, Taiwan (WJC).
Received for publication October 18, 2004; accepted December 23, 2004. Supported by grants from Taipei Municipal Chung-Hsiao Hospital, Taipei, and the Department of Health, Executive Yuan, Taiwan (DOH93-TD-M-113-011).
Reprint requests: Wei J. Chen, MD, Institute of Epidemiology, College of Public Health, National Taiwan University, 1 Jen-Ai Road, Sec. 1, Taipei 100, Taiwan; Fax: 886-2-23560840; E-mail: weijen@ha.mc.ntu.edu.tw
Copyright © 2005 by the Research Society on Alcoholism. DOI: 10.1097/01.ALC.0000159189.56671.EC
ALCOHOLISM: CLINICAL ANDEXPERIMENTALRESEARCH April 2005
enzie et al., 1996; Volk et al., 1997). Although sensitivities and
specificities at various cutoffs can be obtained from the ROC
curve, they are awkward to be used directly to obtain the
posttest probability of having the disease in clinical practice
because of no consistent way to choose a so-called optimal
cutoff point and no simple tool such as a nomogram to help
calculate the positive predictive value. Alternatively, the use of
stratum-specific likelihood ratio (SSLR) has been advocated
by several clinical epidemiologists (Beck, 1986; Furukawa et
al., 1997; Radack et al., 1986). The SSLR is defined as a ratio
of two probabilities, the probability of a given test result when
the disease is present divided by the probability of the same
test result when the disease is absent. This approach of
divid-ing the population into strata dependdivid-ing on their scores has
several advantages over the fixed-threshold approach. First,
for a test that produces a wide range of scores, such as the
AUDIT, the SSLR retains more information by dividing the
test scores into multiple level indices. Second, with the
previ-ous probability of having the disease being taken into account,
this approach can conveniently and intuitively calculate the
posttest probability of being a case for the person whose score
falls in a specific stratum. Third, the SSLR is independent
from the prevalence of the target disorder (Furukawa et al.,
1997). To date, the SSLR approach has been applied to some
psychometric instruments (Furukawa et al., 1997, 2001).
Despite the extensive validation of the AUDIT, its use by
clinicians in some countries has been limited (Friedmann et
al., 2000), probably because of its length (10 items) as
compared with other, shorter screening instruments.
How-ever, the length might be worthwhile if it could lead to
more informative screening, such as the multiple strata
suggested by an SSLR analysis. In this study, we aimed to
conduct an SSLR analysis on the validity of the AUDIT for
detecting alcohol use disorders in addition to the
conven-tional ROC analysis.
METHODS
Participants
The participants of this two-phase study were recruited from Taipei Municipal Chung-Hsiao Hospital, a 544-bed community general hospital, located at eastern district of Taipei City. The selection of patients has been described in detail elsewhere (Chen et al., 2004). Briefly, inpatients aged 18 to 65 years who were admitted during the period from June 9 to August 30, 2002, were included in the sampling frame, and patients admitted in intensive care units or pediatric, gynecologic, obstetric, psychiatric, and hospice departments were excluded. One of every two inpatients from the sampling frame was selected to participate in the study within 3 days after admission. Selected patients were excluded from participation if they were unable to comprehend or answer the questionnaire because of cognitive impairments, either native to them, such as mental retardation, or as a consequence of disease, such as cardiovascular accident, or if they were too ill to complete the questionnaire, such as for patients on a respirator. All of the participants were informed that the aim of the study was to investigate their health behaviors and physical conditions. Among a total of 538 eligible patients during this period, 422 patients (78.4%) completed the first-phase screening; in the remaining 116 nonparticipating patients, 10 patients had poor cognitive function, 7 patients were too ill to complete, 78 patients were discharged before being contacted, and 21 patients
declined to participate. There was no significant difference in the distri-bution of age, sex, or department being admitted between participants who completed the first-phase screen and those who did not.
Measures
All of the participants were screened for alcohol use disorders using the AUDIT at phase 1, and then the Schedules for Clinical Assessment in Neuropsychiatry (SCAN) was used for the phase 2 interview.
The AUDIT is composed of 10 questions, including 3 quantity-frequency questions, 3 dependence-related items, and 4 alcohol-related consequences or harm (Babor et al., 1992). Every AUDIT question is scored from 0 to 4 based on the respondent’s drinking quantity and frequency of occurrence of alcohol-related problems. With the exception of the last two items, the AUDIT questionnaire focuses on the past 1 year. The last two items inquire about alcohol-related problems and have a higher weight for occurrence in the past year and a lower weight for occurrence ever. The total score ranges from 0 to 40. The Chinese version of the AUDIT was established via a two-stage translation (Chen et al., 2004). In a separate sample of 38 alcohol drinkers, ranging from social drinker to alcoholics, the 1-week test-retest reliability of the summary score of the Chinese version of the AUDIT was found to be excellent (intraclass correlation reliability⫽ 0.95).
The SCAN has been developed as a comprehensive instrument for the assessment and classification of psychiatric disorders in adults through semistructured interviewing (Wing et al., 1990). The development of the Chinese version of the SCAN included a two-stage translation, a focus group discussion, a field trial, and study of clinical case histories. Further modification of the SCAN items has carefully considered several cross-cultural psycholinguistic equivalents. The cross-cross-cultural interrater reliabil-ity between United States/United Kingdom SCAN experts and the Tai-wanese SCAN users was found to be acceptable, with 75–100% agreement at item level and 69 –100% agreement at section level (Cheng et al., 2001). For this study, the first author (C-HC), a board-certificated psychiatrist, had received a standard SCAN training course in advance, and the inter-rater reliability between him and the other author (ATAC) among eight participants was acceptable, with values at item level ranging from 0.75 to 1.00 and the percentage agreement on normal/abuse/dependence being 100%.
Procedures
A questionnaire composed of demographic correlates, the AUDIT, and tobacco-smoking history was used by experienced nurses in the screening after obtaining participants’ informed consent. To increase its sensitivity (identifying more cases), the cutoff point of the AUDIT was set at 6, which was lower than the cutoffs of 8 and 10 that were adopted by most previous studies (Allen et al., 1997; Reinert and Allen, 2002; Saunders et al., 1993). According to the AUDIT scores, phase 1 respondents were divided into three strata: negative screening result with zero score, negative screening result with nonzero score, and positive screening result. Because partici-pants with a zero score of the AUDIT indicate that they did not drink any alcohol in the past year, none of them were selected for the second-phase diagnostic interview, and they were considered to be noncases. One of every 5 from the 103 respondents with a negative screening result and a nonzero score (n⫽ 21 patients) and all of the 126 respondents with a positive screening result were invited to the phase 2 interview. Among the 147 patients invited, 19 respondents with a positive screening result and 1 respondent with a negative screening result and a nonzero score did not complete the interview because of discharge or refusal. There was no significant difference in the distributions of demographic characteristics, types of admission, and AUDIT scores between respondents and nonre-spondents in the group with positive screening results. One hundred twenty-seven patients were interviewed with section 11 of the SCAN by a trained psychiatrist (C-HC), who was blind to interviewees’ AUDIT scores, within 3 days after the first phase screening. The diagnosis of current alcohol use disorders was defined according to the DSM-IV (American Psychiatric Association, 1994).
Statistical Analyses
In this two-phase sampling, we used an appropriate weighting system to obtain valid estimates of accuracy indexes and their variance (Dunn et al., 1999). Accordingly, the following sampling weights were used in the subse-quent analyses: 1 for a negative screening result with a zero score, 5 for a negative screening result with a nonzero score, and 1 for a positive screening result. The ROC curve and the AUC with its SE were generated by a nonparametric method (DeLong et al., 1988) as follows: The points on the nonparametric ROC curve were generated by using each possible outcome of the diagnostic test as a classification cutoff point, and the corresponding sensitivity and (1-specificity) were computed. These points were then con-nected by straight lines, and the AUC was computed using the trapezoidal rule. SSLR analysis was then conducted according to the following principle: For a particular stratum, the likelihood ratio is determined by the probability of falling into the stratum for a test result, given that the disorder is present, divided by the probability of falling into the same stratum when the disorder is absent, i.e., SSLR⫽ (x1g/n1)/(x0g/n0), where x1gis the weighted number of participants with the disorder in the gth stratum, n1is the weighted total number of participants with the disorder, x0gis the weighted number of participants without the disorder in the gth stratum, and n0is the weighted total number of participants without the disorder. In this study, the bias-corrected 95% confidence interval (CI) of the SSLR for each stratum was derived using the bootstrapping method (Efron and Tibshirani, 1993), in which 1000 repeats with replacement sampling of the weighted number of participants completing the second-phase interview were conducted to gen-erate 1000 samples, and their corresponding SSLRs were computed accord-ingly. The posttest probability is a function of previous probability, SSLR, pretest odds, and posttest odds as follows: pretest odds ⫽ previous probability/(1-previous probability), pretest odds⫻ SSLR ⫽ posttest odds, and posttest probability⫽ posttest odds/(1 ⫹ posttest odds). Because with too many strata the likelihood ratios become unstable and degenerate, the fol-lowing rules are adopted to achieve the optimal number of strata: (1) to provide sufficient abnormal and normal cases in each stratum to allow the SSLR to be monotonically related and (2) to collapse those strata where the SSLRs are close to one another and their 95% CIs easily overlap (Peirce and Cornell, 1993). All of the statistical analyses were performed using Stata 8.0 (Stata Corporation, College Station, TX).
RESULTS
There were 268 (63.5%) men and 154 (36.5%) women
among 422 participants who completed the first-phase
screen-ing, with a mean age of 41.9 years (SD, 12.9 years) for men
and 43.7 years (SD, 13.9 years) for women. The distribution of
the AUDIT scores, ranging from 0 to 37 (men: 0 –37; women:
0 –18), is shown in table 1. The numbers of participants with a
negatives result and a zero score, a negative result and a
nonzero score, and a positive result were 193 (45.7%), 103
(24.4%), and 126 (29.9%), respectively.
Receiver Operating Characteristic Analyses of the AUDIT
Among 127 patients interviewed in the second phase, 59
patients met diagnoses of current alcohol use disorders (14
patients with alcohol abuse; 45 with alcohol dependence).
Because of the limited number of cases, alcohol use
disor-ders were not further categorized into alcohol abuse and
alcohol dependence. The ROC curve of the AUDIT
against current alcohol use disorders (Fig. 1) indicates that
the overall discriminatory validity is excellent, in which the
AUC is 0.98 (95% CI, 0.97– 0.99). The cutoff point closest
to the left upper corner of the ROC curve would seem to
offer the optimal pairing of sensitivity and specificity. The
corresponding sensitivity, specificity, positive predictive
value, and negative predictive value of the AUDIT at the
cutoff points close to the left upper corner of the ROC
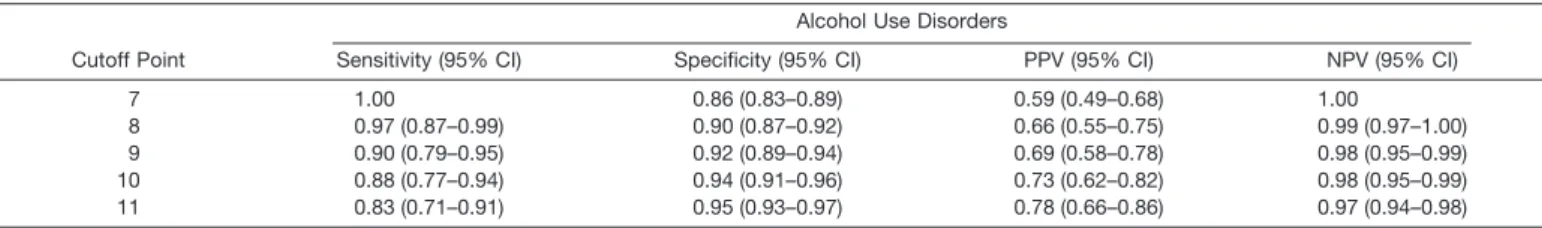
curve, i.e., from 7 to 11, are shown in Table 2. The point of
8 would be the optimal cutoff if the gain in sensitivity and
the loss in specificity were balanced.
Stratum-Specific Likelihood Ratio of the AUDIT
The scores of the AUDIT were categorized into three
strata, i.e., AUDIT score of 0 to 7, 8 to 13, and 14 or
greater, according to the rules proposed by Peirce and
Cornell (1993). Given the previous probability of the base
rate of current alcohol use disorders in this study, i.e.,
16.5% (Chen et al., 2004), the corresponding SSLRs and
posterior probability are shown in Table 3. Patients whose
Table 1. Distribution of the AUDIT Scores Among First-Phase Respondents
AUDIT Scores Males (n⫽ 268) n (%) Females (n⫽ 154) n (%) Total (n⫽ 422) n (%) 0 86 (32.1) 107 (69.5) 193 (45.7) 1 27 (10.1) 19 (12.3) 46 (10.9) 2 16 (6.0) 3 (2.0) 19 (4.5) 3 8 (3.0) 6 (3.9) 14 (3.3) 4 11 (4.1) 1 (0.7) 12 (2.8) 5 10 (3.7) 2 (1.3) 12 (2.8) 6 4 (1.5) 3 (2.0) 7 (1.7) 7 14 (5.2) 3 (2.0) 17 (4.0) 8 9 (3.4) 2 (1.3) 11 (2.6) 9 6 (2.2) 1 (0.7) 7 (1.7) 10 10 (3.7) 1 (0.7) 11 (2.6) 11 4 (1.5) 0 (0.0) 4 (1.0) 12 7 (2.6) 1 (0.7) 8 (1.9) 13 4 (1.5) 0 (0.0) 4 (1.0) 14 6 (2.2) 0 (0.0) 6 (1.4) 15 6 (2.2) 1 (0.7) 7 (1.7) 16 4 (1.5) 1 (0.7) 5 (1.2) 17 1 (0.4) 0 (0.0) 1 (0.2) 18 4 (1.5) 3 (2.0) 7 (1.7) 19–37 31 (11.6) 0 (0.0) 31 (7.4)
AUDIT scores fell in the range of 0 to 7 had an SSLR
significantly lower than 0.1 and thus shifted the posttest
probability of having current alcohol use disorders to a very
low level (0.01). When patients AUDIT scores were 14 or
higher, they had an SSLR significantly higher than 10, and
the corresponding posttest probability was 0.91. Therefore,
participants in these two groups can easily be ruled out or
ruled in for having current alcohol use disorders. In
com-parison, AUDIT scores in the range of 8 to 13 did not lead
to a conclusive prediction of the status of alcohol use
disorders (posttest probability of neither
⬍ 0.1 nor ⬎ 0.9).
DISCUSSION
The AUDIT was developed and validated among
pri-mary health care patients in six non-Asian countries
(Saun-ders et al., 1993). The effect of race or ethnicity on the
performance of alcohol screening tests has been
controver-sial (Cherpitel, 1995; Volk et al., 1997). Only one study of
the AUDIT was done in a Chinese population (Leung and
Arthur, 2000), in which the psychometric properties were
examined but the validity against the diagnosis of alcohol
use disorders was not assessed. Therefore, this is the first
validation study of the AUDIT in a population of Chinese
ethnicity, as well as the first study applying the SSLR analysis.
According to the ROC analyses, the AUC of the AUDIT
against current alcohol use disorders (0.98) in this study
was similar to that in previous studies, in which the AUC
ranged from 0.78 to 0.99 (Bohn et al., 1995; Daeppen et al.,
2000; MacKenzie et al., 1996; Volk et al., 1997). We found
that the AUDIT had an extremely high accuracy for current
alcohol use disorders according to the criteria for
interpret-ing the AUC value proposed by Swets (1988).
By a conventional approach, the findings of this study
showed that the optimal cutoff and its corresponding
sen-sitivity and specificity were also similar to those in previous
studies, in which the optimal cutoff was 8 and the
corre-sponding sensitivity and specificity ranged from 0.61 to 0.96
and 0.85 to 0.96, respectively (Fiellin et al., 2000). Selecting
a single from several possible cutoff points means, in terms
of the ROC analysis, to draw a line from point (0,0) to the
cutoff and another from the cutoff to the point (1,1), and
the corresponding AUC is always bound to be smaller than
that of the original data, which implies that much
informa-tion is lost. Furthermore, the value of sensitivity and
spec-ificity is not readily applicable in clinical practices.
Al-though positive and negative predictive values can be
estimated from sensitivity and specificity, they are
depen-dent on the prevalence of the target disorder.
Unlike the conventional approach, the three strata
de-rived from the SSLR analysis in this study can help in
interpreting the meaning of the score obtained. Although
the posttest probability of having a disorder using the SSLR
approach is also affected by the previous probability, the
SSLR can be conveniently used to estimate the posttest
probability of having a current alcohol use disorder by
incorporating a reasonable pretest probability and use of a
nomogram (Fagan, 1975). For example, assume that the
prevalence of alcohol use disorders is 7% (i.e., pretest odds
⫽ 0.07/(1 ⫺ 0.07) ⫽ 0.075) in the community and 16.5%
(i.e., pretest odds
⫽ 0.198) in nonpsychiatric wards of
general hospitals. For a person with an AUDIT score of 10,
the posttest probability of having an alcohol use disorder is
21%, which is derived as (3.67
⫻ pretest odds)/[(1 ⫹ 3.67 ⫻
pretest odds)], if the person is from the community and
42% if the person is an inpatient at a general hospital. Now,
if the person’s AUDIT score is increased to 18, the posttest
probability of having an alcohol use disorder becomes 79%
if the person is from the community and 91% if the person
is an inpatient at a general hospital. In all of the four
scenarios, the person will be assigned to the positive
screen-ing group (or a possible case) without quantitative indexscreen-ing
for having an alcohol use disorder if a fixed threshold of an
optimal cutoff of 8 is adopted.
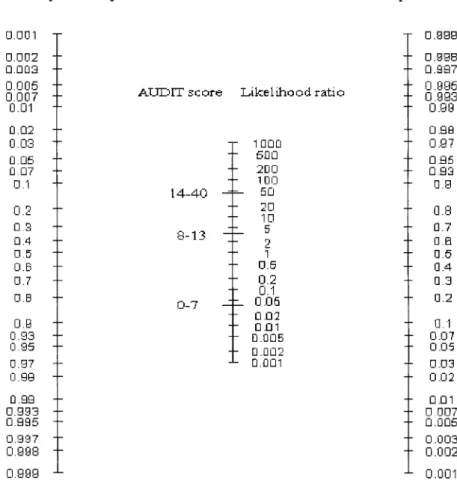
We have prepared a nomogram (Fig. 2) to assist future
users of the AUDIT to swiftly derive the posttest
probabil-ity for patients with certain pretest probabilprobabil-ity. The AUDIT
nomogram can be used as follows: If the prevalence of
Table 2. Weighted Validity of the AUDIT at Various Cutoff Points to Detect Current Alcohol Use Disorders
Cutoff Point
Alcohol Use Disorders
Sensitivity (95% CI) Specificity (95% CI) PPV (95% CI) NPV (95% CI)
7 1.00 0.86 (0.83–0.89) 0.59 (0.49–0.68) 1.00
8 0.97 (0.87–0.99) 0.90 (0.87–0.92) 0.66 (0.55–0.75) 0.99 (0.97–1.00) 9 0.90 (0.79–0.95) 0.92 (0.89–0.94) 0.69 (0.58–0.78) 0.98 (0.95–0.99) 10 0.88 (0.77–0.94) 0.94 (0.91–0.96) 0.73 (0.62–0.82) 0.98 (0.95–0.99) 11 0.83 (0.71–0.91) 0.95 (0.93–0.97) 0.78 (0.66–0.86) 0.97 (0.94–0.98) NPV, negative predictive value; PPV, positive predictive value.
Table 3. SSLRs and Posttest Probability of the AUDIT for Alcohol Use Disorders
AUDIT Strata
Number of Patientsa
SSLR
(95% CI) Posttest Probability(95% CI)
Noncase Case
0–7 231 (311) 2 (2) 0.04 (0.02–0.16) 0.01 (0.00–0.03)
8–13 24 (24) 13 (13) 3.67 (2.18–8.90) 0.42 (0.30–0.64)
ⱖ 14 6 (6) 44 (44) 49.72 (27.12–162.71) 0.91 (0.84–0.97)
a
alcohol use disorder in the community is 7% and a patient
is found to have a score of 10 on the AUDIT, a straight line
is drawn from 7% on the left-hand column to 8 to 13 on the
middle column and arrives at the posttest probability of
disorder on the right-hand column, which is approximately
21% for this patient.
In clinical practice, an SSLR greater than 10 or less than
0.1, as in the upper and lower strata in this study, can easily
ascertain the presence or absence of a disease (Jaeschke et al.,
1994). That is, for a person whose AUDIT score is lower than
7 or higher than 14, he or she can be ruled out or ruled in for
the possibility of having an alcohol use disorder.
There-fore, the validity of the AUDIT when presented with the
SSLRs is of great clinical usefulness and retains more
information than the fixed-threshold approach.
An important feature of the current study is that we
included all of the participants fulfilling inclusion criteria
from a general hospital. Previous studies have indicated
that the validity of a screening instrument could suffer from
“spectrum bias” (Ransohoff and Feinstein, 1978) and be
overestimated if the participants were selected on the
case-control design. With the inclusion of all of the patients in
one general hospital, the good validity of the AUDIT for
screening alcohol use disorders in the current study is
unlikely due to spectrum bias.
Compared with the four-item CAGE (Mayfield et al.,
1974), it takes more time to complete the AUDIT, and the
scoring is slightly more complex. However, the additional
time and scoring complexity help the AUDIT to obtain
more information about participants’ alcohol use. Unlike
the CAGE, which was developed primarily for detecting
more severe alcohol use problems, the AUDIT was
devel-oped primarily for hazardous alcohol use and was also used
for alcohol use disorders thereafter. Although the validity
of the AUDIT does not exceed that of the CAGE for
detecting persons with alcohol use disorders, it has been
shown to be more valid for identifying those with hazardous
or harmful drinking (Fiellin et al., 2000), which has been
proposed to be an important target for prevention from
alcohol-related harm early (Babor and Higgins-Biddle,
2001; Saunders and Lee, 2000). Although various
defini-tions of hazardous alcohol use exist across studies, the
SSLR analysis in this study can be applied similarly to
evaluate the validity of the AUDIT against such a diagnosis
if consensus in the criteria of hazardous alcohol use is
reached. The consideration of such a category of alcohol
use disorders is particularly important regarding the
prac-tical meaning for the middle stratum derived from the
SSLR in this study, which did not have a high likelihood
ratio for having alcohol abuse or dependence. As suggested
in a World Health Organization manual of brief
interven-tion for hazardous drinking (Babor and Higgins-Biddle,
2001), the respondents are classified into four strata
ac-cording to AUDIT scores to implement different
tions, from education to referral to specialty treatment. In
light of this practice, the strata derived from the SSLR
analysis might provide a convenient way to screen for
var-ious kinds of alcohol-related problems, from hazardous or
harmful use to alcohol dependence.
The limitations of this study should be borne in mind.
First, some might argue that patients with a negative
screening result and a zero score who were not included in
the diagnostic interview might overestimate the
perfor-mance of the AUDIT. To further explore the potential
impact of this practice on the estimates of validity indexes,
we consider the scenario that 20% of patients with a
neg-ative screening result and a zero score, i.e., approximately
39 persons, were interviewed, and one of them was found to
have an alcohol use disorder. Then, the AUC of the
AU-DIT for the diagnosis of current alcohol use disorders
would decrease from 0.98 to 0.92, but the optimal cutoff
point would remain unchanged at 8 points, and the
corre-sponding sensitivity and specificity would change from 0.97
to 0.89 and from 0.90 to 0.88, respectively. Despite the
decreasing of the estimates, these estimates would still be
within the 95% CI of the original estimates. Furthermore,
among the 21 patients interviewed who had a negative
screening result and a nonzero score, none of them had
current alcohol use disorders. Therefore, the chance of
having the disorders among the patients with a negative
screening result and a zero score is very small. Taken
together, our estimates would not be influenced much by
not interviewing patients with a negative screening result
and a zero score. Second, the sample size of this study was
not large enough to perform the validity analyses separately
for each sex. Some studies found that the cutoff points of an
alcohol screening test for females might be lower than that
for males (Bradley et al., 1998; Cherpitel, 1995). Third,
although the SSLR analysis can provide the probability of
having disorders on the basis of the AUDIT scores, the
presence of alcohol use disorders still requires further
eval-uation to confirm. Nevertheless, this is a common issue for
all screening tools. Fourth, because the results have not
been cross-validated, the strata derived from the SSLR
analysis might not be generalizable outside the general
hospital inpatients. However, a recent study did find that
the SSLRs and their ranges derived from a Taiwanese
sample of nonclinical adolescents (Yang et al., 2004) on
depression symptoms were similar to those derived from
Japanese adults in clinical setting (Furukawa et al., 1997)
and hence supported the assertion that the SSLR is
inde-pendent from the prevalence of target disorder. Therefore,
our results might not be strictly limited to general hospital
inpatients. Fifth, according to the rules proposed by Peirce
and Cornell (1993) for the selection of strata in the SSLR
analysis, the score ranges remained flexible when the
like-lihood ratio between strata was gradually changed. Under
this circumstance, the selection of cutoff points for each
stratum involves some subjective judgment, as was the case
for scores between 11 and 14 in this study.
In conclusion, this is the first study to demonstrate the
validity of the AUDIT in the screening for alcohol use
disorders in a Taiwanese sample. According to the SSLRs
and their corresponding posttest probability, individuals
with an AUDIT score of 0 to 7 or those with a score of 14
or greater can be easily ruled out or ruled in for having
current alcohol use disorders, whereas those with a score of
8 to 13 would be equivocal. Furthermore, the strata derived
from the SSLR might be useful for different types of
inter-ventions. Based on the results of this study, we highly
recommend using SSLR analysis to interpret the validity of
the AUDIT, rather than merely relying on the
fixed-threshold approach.
ACKNOWLEDGMENTS
The authors thank Misses H. L. Chang and M. Y. Shih for their excellent work at the first-phase screening.
REFERENCES
Aertgeerts B, Buntinx F, Bande-Knops J, Vandermeulen C, Roelants M, Ansoms S, Fevery J (2000) The value of CAGE, CUGE, and AUDIT in screening for alcohol abuse and dependence among college freshmen. Alcohol Clin Exp Res 24:53–57.
Allen JP, Litten RZ, Fertig JB, Babor TF (1997) A review of research on the Alcohol Use Disorders Identification Test (AUDIT). Alcohol Clin Exp Res 21:613– 619.
American Psychiatric Association (1994) Diagnostic and Statistical Manual of Mental Disorders. 4th ed. American Psychiatric Association, Wash-ington, DC.
Babor TF, de la Fuente JR, Saunders JB, Grant M (1992) The Alcohol Use Disorders Identification Test: Guidelines for Use in Primary Health Care (WHO Publication No. 92.4). World Health Organization, Geneva. Babor TF, Higgins-Biddle JC (2001) Brief Intervention for Hazardous and
Harmful Drinking: A Manual for Use in Primary Care. World Health Organization, Geneva.
Beck JR (1986) Likelihood ratios: Another enhancement of sensitivity and specificity. Arch Pathol Lab Med 110:685– 686.
Bohn MJ, Babor TF, Kranzler HR (1995) The Alcohol Use Disorders Identification Test (AUDIT): Validation of a screening instrument for use in medical settings. J Stud Alcohol 56:423– 432.
Bradley KA, Bush KR, McDonell MB, Malone T, Fihn SD (1998) Screen-ing for problem drinkScreen-ing: Comparison of CAGE and AUDIT. Ambu-latory Care Quality Improvement Project (ACQUIP). Alcohol Use Disorders Identification Test J Gen Intern Med 13:379 –388.
Chen CH, Chen WJ, Cheng ATA (2004) Prevalence and identification of alcohol use disorders among non-psychiatric inpatients in one general hospital. Gen Hosp Psychiatry 26:219 –225.
Cheng ATA, Tien AY, Chang CJ, Brugha TS, Cooper JE, Lee CS, Compton W, Liu CY, Yu WY, Chen HM (2001) Cross-cultural imple-mentation of a Chinese version of the Schedules for Clinical Assessment in Neuropsychiatry (SCAN) in Taiwan. Br J Psychiatry 178:567–572. Cherpitel CJ (1995) Analysis of cut points for screening instruments for
alcohol problems in the emergency room. J Stud Alcohol 56:695–700. Daeppen JB, Yersin B, Landry U, Pecoud A, Decrey H (2000) Reliability
and validity of the Alcohol Use Disorders Identification Test (AUDIT) imbedded within a general health risk screening questionnaire: Results of a survey in 332 primary care patients. Alcohol Clin Exp Res 24:659 – 665.
Dawe S, Seinen A, Kavanagh D (2000) An examination of the utility of the AUDIT in people with schizophrenia. J Stud Alcohol 61:744 –750.
DeLong ER, Delong DM, Clarke-Pearson DL (1988) Comparing the areas under two or more correlated receiver operating curves: A non-parametric approach. Biometrics 44:837– 845.
Dunn G, Pickles A, Tansella M, Vazquez-Barquero JL (1999) Two-phase epidemiological surveys in psychiatric research. Br J Psychiatry 174:95– 100.
Efron B, Tibshirani RJ (1993) An Introduction to the Bootstrap. Chapman & Hall, London.
Fagan TJ (1975) Nomogram for Bayes’s theorem. N Engl J Med 293:257. Fiellin DA, Reid MC, O’Connor PG (2000) Screening for alcohol prob-lems in primary care: A systematic review. Arch Intern Med 160:1977– 1989.
Friedmann PD, McCullough D, Chin MH, Saitz R (2000) Screening and intervention for alcohol problems: A national survey of primary care physicians and psychiatrists. J Gen Intern Med 15:84 –91.
Furukawa TA, Goldberg DP, Rabe-Hesketh S, Ustun TB (2001) Stratum-specific likelihood ratios of two versions of the General Health Ques-tionnaire. Psychol Med 31:519 –529.
Furukawa TA, Hirai T, Kitamura T, Takahashi K (1997) Application of the Center for Epidemiologic Studies Depression Scale among first-visit psychiatric patients: A new approach to improve its performance. J Affect Disord 46:1–13.
Hanley JA, McNeil BJ (1982) The meaning and use of the area under a receiver operating characteristic (ROC) curve. Radiology 143:26 –36. Jaeschke R, Guyatt GH, Sackett DL (1994) Users’ guides to the medical
literature: B. What are the results and will they help me in caring for my patients? JAMA 271:703–707.
Leung SF, Arthur D (2000) The alcohol use disorders identification test (AUDIT): Validation of an instrument for enhancing nursing practice in Hong Kong. Int J Nurs Stud 37:57– 64.
MacKenzie DM, Langa A, Brown TM (1996) Identifying hazardous or harmful alcohol use in medical admissions: A comparison of AUDIT, CAGE and brief MAST. Alcohol Alcohol 31:591–599.
Maisto SA, Carey MP, Carey KB, Gordon CM, Gleason JR (2000) Use of the AUDIT and the DAST-10 to identify alcohol and drug use disorders among adults with a severe and persistent mental illness. Psychol Assess 12:186 –192.
Mayfield D, McLeod G, Hall P (1974) The CAGE questionnaire: Vali-dation of a new alcoholism screening instrument. Am J Psychiatry 131:1121–1123.
Morton JL, Jones TV, Manganaro MA (1996) Performance of alcoholism screening questionnaires in elderly veterans. Am J Med 101:153–159. Peirce JC, Cornell RG (1993) Integrating stratum-specific likelihood
ra-tios with the analysis of ROC curves. Med Decis Making 13:141–151. Piccinelli M, Tessari E, Bortolomasi M, Piasere O, Semenzin M, Garzotto
N, Tansella M (1997) Efficacy of the alcohol use disorders identification test as a screening tool for hazardous alcohol intake and related disor-ders in primary care: A validity study. BMJ 314:420 – 424.
Radack KL, Rouan G, Hedges J (1986) The likelihood ratio: An improved measure for evaluating diagnostic test results. Arch Pathol Lab Med 110:689 – 693.
Ransohoff DF, Feinstein AR (1978) Problems of spectrum and bias in evaluating the efficacy of diagnostic tests. N Engl J Med 299:926 –930. Reinert DF, Allen JP (2002) The Alcohol Use Disorders Identification Test (AUDIT): A review of recent research. Alcohol Clin Exp Res 26:272–279.
Saunders J, Lee NK (2000) Hazardous alcohol use: Its delineation as a subthreshold disorder, and approaches to its diagnosis and manage-ment. Compr Psychiatry (Suppl 1) 41:95S–103S.
Saunders JB, Aasland OG, Babor TF, de la Fuente JR, Grant M (1993) Development of the Alcohol Use Disorders Identification Test (AU-DIT): WHO Collaborative Project on Early Detection of Persons With Harmful Alcohol Consumption—II. Addiction 88:791– 804.
Seppa K, Makela R, Sillanaukee P (1995) Effectiveness of the Alcohol Use Disorders Identification Test in occupational health screenings. Alcohol Clin Exp Res 19:999 –1003.
Swets JA (1988) Measuring the accuracy of diagnostic systems. Science 240:1285–1293.
Volk RJ, Steinbauer JR, Cantor SB, Holzer CE (1997) The Alcohol Use Disorders Identification Test (AUDIT) as a screen for at-risk drinking in primary care patients of different racial/ethnic backgrounds. Addic-tion 92:197–206.
Wing JK, Babor T, Brugha T, Burke J, Cooper JE, Giel R, Jablenski A, Regier D, Sartorius N (1990) SCAN: Schedules for Clinical Assessment in Neuropsychiatry. Arch Gen Psychiatry 47:589 –593.
Yang H-J, Soong W-T, Kuo P-H, Chang H-L, Chen WJ (2004) Using the CES-D in a two-phase survey for depressive disorders among non-referred adolescents in Taipei: A stratum-specific likelihood ratio anal-ysis. J Affect Disord 82:419 – 430.