j . -
:~I1K'I =LtJ I :l :,~
Two-phase heat transfer characteristics
for R - 2 2 / R - 4 0 7 C in a 6 . 5 - m m
smooth tube
Chi-chuan Wang* and Ching-shan Chiang t
* E n e r g y & R e s o u r c e s L a b o r a t o r i e s , I n d u s t r i a l T e c h n o l o g y R e s e a r c h I n s t i t u t e , H s i n c h u , T a i w a n , a n d t D e p a r t m e n t of M e c h a n i c a l E n g i n e e r i n g , N a t i o n a l C h i a o T u n g U n i v e r s i t y , H s i n c h u , T a i w a n
Two-phase
friction and heat transfer characteristics for R-22/R-407C inside a 6.5-mm smooth tube are reported in this study. The heat transfer results for G - - 1 0 0 and 400 kg/m z swere reported
in the present study, and the adiabatic frictional pressure drop was recorded in the range of 100 to 700 kg/m 2 s. It is found that the development of flow pattern for R-407C falls behind R-22. This may explain the lowerpressure drops
for R-407C. The major heat transfer mechanism at low mass flux is nucleate boiling, and virtually becomes the convective evaporation as mass flux increase to G = 4 0 0 krg/m 2 s, Meanwhile, the reduction of heat transfer coefficients for R-407C mixtures areespecially
profound at low mass flux, and the reduction of heat transfercoefficient decreases
with the increase of mass flux. © 1997 by Elsevier Science Inc.Keywords:
flow pattern; two-phase flow; R-22, R-407C; heat transfer; pressure dropsIntroduction
The Montreal Protocol will ban the use of HCFC-22 by the year 2020. Some nations, however, are in favor of complete phase-out of HCFC-22 by the year 2000. Consequently an extensive search for potential replacements has been made during the past few years. Because there are no single-component HFCs that have thermodynamic properties close to those of HCFC-22, binary or ternary refrigerant mixtures have been introduced. Presently, R-407C is one of the most likely potential substitute for R-22. R-407C is a zeotropic mixture consisting of 23 wt% R32, 25 wt% of R-125, and 52% of R-134a and is an "ozone-friendly" HFC refrigerant mixture.
During the past decade, experiments on the horizontal flow boiling of refrigerant mixtures have been carried out, and some heat transfer coefficients have been obtained. Reported data indicated that the heat transfer coefficients for mixtures were considerably lower than those of pure refrigerant. Kedzierski et al. (1992) summarized several possible reasons for heat transfer degradation, including nonlinear variation of physical properties, component degradation, and circumferential and radial nonuni- formity of concentration profiles. Recently, Wang et al. (1996) and Kuo and Wang (1996a) also reported a considerable de- crease of heat transfer coefficients for R-407C. They conducted in-tube evaporation for R-22 and R-407C inside 9.52-mm smooth/micro-fin tube for G = 100 ~ 300 k g / m 2 s. They sus- pected the flow pattern difference between R-22 and R-407C might affect the degradation. However, there is no evidence to support their viewpoint. Until now, there have been very limited
*Address reprint requests to Dr. Chi-chuan Wang, D200 ERL/ ITRI, Bldg. 64, 195-6 Section 4, Chung Hsing Rd., Chutung, 310, Hsinchu, Taiwan.
Received 23 July 1996; accepted 12 November 1996 Int. J. Heat and Fluid Flow 18: 550-558, 1997 © 1997 by Elsevier Science Inc.
655 Avenue of the Americas, New York, NY 10010
R-407C heat transfer and friction data. Therefore, the objective of the present study is to provide the two-phase heat transfer and friction characteristics for R-407C in a smooth, horizontal tube compared to R-22. In addition, the flow patterns for R-407C/R-22 are also shown.
Experimental apparatus
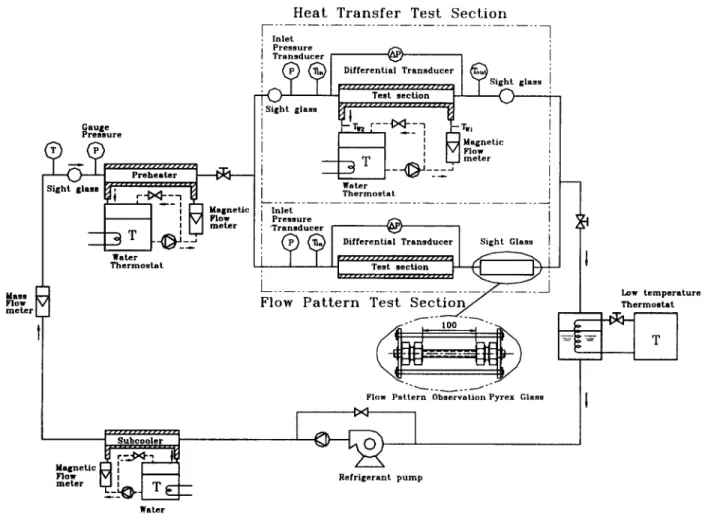
The schematic of the experimental apparatus is depicted in Figure 1. The test rig consists of two test sections; the heat transfer measurement test section, and flow pattern observation test section.
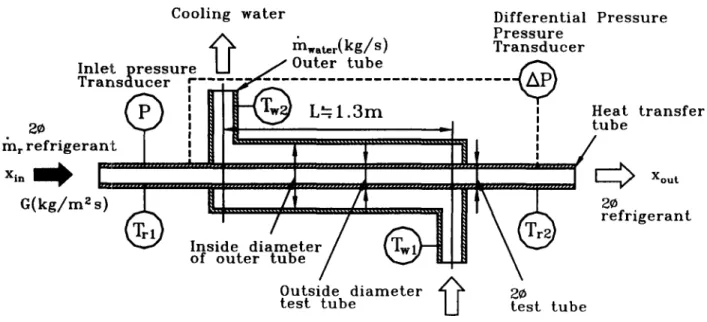
The test rig is composed of three independent flow loops: a refrigerant loop; a heating water flow loop; and a glycol flow loop. The refrigerant flow loop consists of a variable speed gear pump that delivers subcooled refrigerant to the preheater. The refrigerant pump can provide refrigerant mass fluxes ranging from 50 to 700 k g / m 2 s. A very accurate mass flow meter is installed between the refrigerant pump and the preheater. The accuracy of the mass flow meter is 0.3% of the test span. The subcooled refrigerant liquid was heated in the preheater to obtain a prescribed evaporator inlet quality before entering the test section. The two-phase refrigerant leaving the test section was condensed in a shell-and-coil condenser. The horizontal test section is a double-pipe heat exchanger having 1.3-m effective heat transfer length. The detailed heat transfer measurement test section is shown in Figure 2. Fifty millimeter-thick rubber insulation is wrapped around the double-pipe heat exchangers to ensure that heat loss to the ambient will be less than 13 W for the test tube. As seen in Figure 2, inside the double-pipe heat exchanger, water flows countercurrently in the test section annu- lus, while refrigerant is evaporated inside the test tube. The pressure drop of the refrigerant across the test tube was meas- ured by a differential pressure transducer with 10 Pa precision. Two magnetic flow meters were used to record the flow rates of
0142-727X/97/$ 17.00 PII S0142-727X(97)O0017-9
water in the annulus of the preheater and the test section. These magnetic flow meters are calibrated in advance with a calibrated accuracy of 0.0002 1/s. Two absolute pressure transducers were installed at the inlet and exit of the test section with resolution up to 0.1 kPa. During each experiment, the heat flux in the test section was maintained at a desired constant value. Experiments were conducted using a commercially available 6.5-mm smooth tube. Tests were conducted at an evaporation temperature of 2°C. All of the water and refrigerant temperatures were mea- sured by resistance temperature devices ( P t l 0 0 ~ ) having a cali- brated accuracy of 0.05~C. The refrigerant leaving the test sec- tion was condensed and subcooled by a glycol circuit. The inlet temperature of the glycol was controlled by a 15-kW low-temper- ature thermostat. All c,f the data signals were collected and converted by a data acquisition system (hybrid recorder). The data acquisition system then transmited the converted signals through GPIB interface to a host computer for further opera- tion. In this study, the physical and transport properties for R-22 and R-407C are evaluated from the computer program R E F - P R O P (1996). Uncertainties of the heat transfer coefficients and friction factors reported in the present investigation, following the single-sample analysis proposed by Moffat (1989) are shown in Table 1. For flow visualization, a sight glass is located at the end of a separate horizontal test section, as shown in Figure 1. The sight glass has a length of 100 mm with an internal diameter of 6.5 mm. Flow patterns are obtained from direct visual observa- tions made with a microcamera.
H e a t t r a n s f e r data= r e d u c t i o n
The heat attributable to the test section was obtained from the flow rate and temperature drop of the water along the annulus
according to the following relation:
0 = thwaterfp A T (1)
The overall heat transfer coefficient was then computed from
0
U o (2) LMTD x A o where: a t 1 - AT: LMTD = (3) 1 / A T I ~ n I A-~2 J AT1 = T s a t - Twat .. . . . t (4)AT2 = Zsat - Twater, in (5)
where Tsat is the saturation temperature of the refrigerant in the test section, and Twater, in and Twater, out denote the inlet and outlet temperature of the water coolant on the annulus. The in-tube heat transfer coefficient was obtained from the following thermal resistance equation:
1 1 1
UoAo hoAo I- R w + h i A i (6)
where h o and h i represent the average outside and inside heat transfer coefficients, and R w denotes wall resistance. In the present calculation, the overall resistance is based on the outer
N o t a t i o n A o A i C
Cp
all" I
dPI3 def, vaPa
a 6
Diftp
G hi hNcB ho L L T M D rhr rnwater P q0
Reeq Rw Twater, in Zwater, out T~t outside heat transfer area of the tube, m 2 Tbub, i nominal inside heat transfer area of the tube, m 2 ATconstant in Chisholm correlation AT1
specific heat of water, J / k g K ATE measured two-phase frictional pressure difference, Uo
N / m 2
frictional pressure difference for liquid flowing x
alone, N/:rn Ax
frictional pressure difference for gas flowing alone,
N / m 2 Greek
pressure drop caused by acceleration, N / m 2
frictional pressure drop, N / m 2 A0
inside diameter of the tube, m h
two-phase friction factor, dimensionless I x
mass flux, kg / m 2 s v
inside heat transfer coefficient, W / m 2 K P nucleate boiling heat transfer coefficient, W / m 2 K ~r heat transfer coefficient on the annulus side,
W / m e K Subscripts
effective heating length, m
log mean l:emperature difference, K l average mass flow rate of refrigerant, k g / s v average mass flow rate of coolant water, k g / s ave
system pre, ssure, kPa 1
average heat flux, W / m 2 2
average heat transfer rates W in
equivalent two-phase Reynolds number, dimen- mod
sionless o
wall resistance, W / m 2 K out
inlet temperature of water at annulus side, K w outlet temperature of water at annulus side, K water
saturation temperature of the refrigerant, K bubble point temperature for R-407C, K temperature drop on the water coolant, K temperature difference, AT 1 = Zsa t - T 1 , K temperature difference, AT 2 = Tsa t - T 2 , K overall heat transfer coefficient, W / m 2 K average specific volume, m 3 / k g
vapor quality difference of quality
temperature glide of R-407C, K latent heat of evaporating vapor, J / k g dynamic viscosity of refrigerant, N s / m z kinematic viscosity of refrigerant, T / s density of refrigerant, kg / m 3 surface tension of refrigerant, N / m
liquid phase gas phase average value inlet outlet inlet modified value outside outlet wall water
Heat transfer for R-22/R-407C in a smooth pipe: C-. C. Wang and C-. S. Chiang H e a l T r a n s f e r T e s t S e c t i o n Mess
Flow
m e t e r Figure I Gauge P r e s s u r e"'"°
I I I I I Magnetic I rk/I Plow I I , I'1 m e t e r Water T h e r m o s t a t,
I n l e t P r e s s u r eK'~
ITransducer
:i ~') ~ i
Diff . . . . tial T r a n s d . . . .I
, Sight glass ... * = ] ' Water [---L
T_"er__~__°st__'_
t_
/
I n l e t / IPressure
~
/
',"Transducer
~
( ~
D i f f e r e n t i a l T r a n s d u c e r S i g h t Glass!
i . . .
_ 2 Z _ i l l
" - : : 2 . . .
t ~ - ~ J
J
Low t e m p e r a t u r e F l o w P a t t e r n T e s t S e e T h e r m o s t a tL--s-~-b-~-"-";-~r--J
MagneticM ,
I
I
Flow
M ,
m e t e rI.~IL~. ~ T ~
Water T h e r m o s t a tFlow P a t t e r n Observation Pyrex Glass
R e f r i g e r a n t p u m p
Schematic diagram of test apparatus
surface area, which is evaluated as I r D o L , where D O is the
outside diameter of the test tube, and L is the effective heat transfer length. Properties on the water side were calculated using average inlet and outlet bulk fluid temperatures. Determi-
nation of the inside heat transfer coefficient h i requires knowl-
edge of the outside heat transfer coefficient h o. This was accom-
plished by means of separate water-to-water tests on the same apparatus, with subsequent Wilson-plot analyses yielding the individual heat transfer coefficient relationships. The vapor qual-
ity entering the test section xi, , is calculated from the energy
gain on the preheater, and the quality change in each test section is given by the following energy balance:
0
Ax
=(7)
th,h
and the average quality in the test section is given by:
Ax
Xav e
=Xin 4- " 7
(8)
The increased quality in the test section is usually less than 0.13.
Pressure drop data reduction
The pressure drop data were analyzed using the concept of the two-phase friction factors. Tests were conducted with and with- out heat addition. Because the acceleration pressure gradient
APe can be neglected in the adiabatic experiments, a more
accurate calculation of the frictional factors can be obtained.
Table 1 Summary of estimated uncertainties
Primary measurements
Parameter Uncertainty Parameter
Derived quantities Uncertainty G = 100 kg/m 2 Uncertainty G = 4 0 0 kg/m 2 s rh r 0 . 3 - 1 % G rhwate r 0 . 5 % Re i •P 0 . 5 % ftp T 0 . 0 5 ° C h t . 1 % 0 . 5 % 0 . 6 % 0 . 6 % + 8.3% _+ 4.6% + 8 . 4 % _+ 1 5 . 4 %
C o o l i n g w a t e r D i f f e r e n t i a l P r e s s u r e . P r e s s u r e t ~ m w a t e r ( k g / s ) T r a n s d u c e r InletL p r e s s u r e [ _ J / O u t e r t u b e
Transducer F- i25¢~fi2.
...
k z r)
~
L~l.3m
_
(~~
H e a t t r a n s f e r
l~ar ~ : f r i g e r a n L
... ...
[
,
"
... [ ... i ... ~ { d ~
i
/
u b e
x,° i ,
=illllllllllllllllllllll iiiiiiiiiiiiiiii]iiiiiiiiiiiiiiiijiiiiiiiiiiiiiiiiiiiii]iiiii iiiiiiiiiiiiii iiiiii/
Xou,
G ( k g / m Z s ) ( ~ H i ... ? ... - - / t ... - , l U ' ~ ( ~ _ _ 20
I n s i d e d i a m e t e r / d ] ] r e f r i g e r a n t
o f o u t e r t u b e / ~
O u t s i d e d i a m e t e r z~x~ 20
t e s t t u b e U t e s t t u b e
Figure 2
Schematic diagram of the evaporation test section
The two-phase friction fitctor can be calculated from:
d P ) 2ftpG2~ - - ~ z f D i (9) and = x v v + (1 - x ) v t (10) ( x v v ~ v + (1 - x ) v t ~ l) = (11) GDi (12) Reeq =
The mean two-phase viscosity is taken from Dukler et al. (1964).
R e s u l t s a n d d i s c u s s i o n
For the adiabatic conditiion, the pressure drop data for G = 100, 400, and 700 k g / m 2 s are shown in Figure 3. The pressure drop (expressed as A p / L ; i.e., pressure drop per unit length between pressure taps) increases significantly with the mass flux and with quality. It is interesting to note that the pressure gradient for R-407 is lower than tha'~ for R-22, and the difference increases with the mass flux. For G = 100 k g / m 2 s, the pressure gradient for R-407C is nearly the same as with R-22. As mass flux increases to G = 700 k g / m 2 s, the frictional gradients for R-22 are approximately 20 ~ 40% higher than R-407C. The experi- mental data for Wang el: al. (1996) showed similar results. Wang et al. suspected the flow pattern difference between R-22 and R-407C may cause this phenomenon. To explain this we can see the flow pattern progression for R-22 and R-407C in Figures 4a and b. The observed flow patterns for R-22 and R-407C corre- spond to mass flow vel~fities of 100 and 400 k g / m 2 s. The flow patterns for G = 100 k g / m 2 s include the intermittent and stratified flow pattern (stratified smooth and stratified wavy). There are no siguificant differences of flow pattern between R-22 and R-407C at a mass flux of 100 k g / m 2 s, and the development of the flow patterns for R-22 and R-407C is approx- imately the same. For G = 400 k g / m 2 s, the flow patterns
include intermittent, stratified, wavy, and annular. However, we can easily find that the flow pattern development of R-407C falls behind R-22. For example, at x = 0.1, the flow pattern for R-22 is wavy, while R-407C is intermittent, and at x = 0.2, the flow pattern for R-407C is wavy, while R-22 is annular. The delay of flow pattern development for R-407C can be explained by the differences between the physical properties of the refrigerants, as shown in Table 2.
At the initial stage of evaporation (low-quality region), the more volatile components of the R-407C mixture, R-32 and R-125, evaporated faster than the least volatile component, R- 134a. As a result, the vapor phase may contain more R-32 and R-125 as compared to its initial concentration. Examination of the physical properties for R-32, R-125, and R-134a (evaluated at 20°C). We can easily find that PC for R-32 is 40.75 kg/m 3, which is 46.7% higher than that of R-134a; Pc for R-125 is 77.83
30 N 25 20 15 10 0 0 R-22 R-407C Tsat=20°C [] :G=700 • :G=700 0
:G=400
• :G=400
A : G = I O 0 • : G = I O 0 G:kg/m2.s F] _ O . . . © I i I I I i I I I 0.1 0.2 0.3 0.4 0.5 0.6 0.7 0.8 0.9 Vapor QualityFigure 3
Pressure drop gradient versus flow quality at
vari-ous
mass
fluxes (adiabatic condition)Heat transfer for R-22/R-407C in a smooth pipe: C-. C. Wang and C-. S. Chiang
Flow Direction ~-
(a) R-22, x=0.11, Stratified flow
(d) R-407C, x=0.11, Plug flow
(b) R-22, x--0.414, Wavy flow
Flow Direction ,--
(e) R-407C, x--0.421, Wavy flow
i ! Z i ! i
: : : : : : : : : : : : : : : : : : : : : : .
Figure 4a
(c) R-22, x=0.925, Wavy flow
Flow pattern for G = 100 kg/m 2 s
Flow Direction
(f) R-407C, x-~.93, Wavy flow
(a) R-22, x--0.11, Wavy flow
Flow Direction
(d) R-407C, x--0.11, Slug flow
(b) R-22, x=0.2, Annular flow
Flow Direction ~--
(¢) R-407C, x=0.21, Wavy/Annular flow
Figure 4b(c)
R-22, x=0.93, Annular flow
Flow pattern for G = 4 0 0 kg/m 2 s
Flow Direction
(f) R-407C, x=0.894, Annular flow
Heat transfer for R-22/R-407C in a smooth pipe." C-. C. Wang and C-. S. Chiang Table 2 Thermodynamic and transport properties of five refrigerants
T= 20 ° CPG CPL ~1, G IJ, L k G kL Property PG PL iG iL unit kg/m 3 kJ/kg kJ/kg i~Pa. s W/m K R-22 38.67 1211 252.8 67.3 0.8689 R-32 40.75 981.1 383.8 102.1 1.389 R-125 77.78 1219 190.1 74.6 1.044 R-134a 27.76 1225 261.3 78.8 0.9824 R-407C 36.56 1175 277.8 83.1 0.9326 R-410A 53.84 1107 293.9 92.7 1.02 1.266 128.1 1801 0.0112 0.091 1.874 125.9 1202 0.0138 0.1271 1.386 139.8 1525 0.0144 0.0562 1,404 119.2 2247 0.0137 O.0837 1.455 125.2 1749 O.0128 0.0895 1.539 132.1 1328 0.0127 0.0952
Note: The properties are calculated using REFPROP (1996).
k g / m 3, which is 280% higher than that of R-134a. Meanwhile, PL for R-32 is 981.7 k g / m 3, which is 20% lower than that of R-134a; and PL for R-125 is almost the same as that of R-134a. Considering a fixed mass flux (G = pu) condition, the higher mean density of vapor phase because of the contribution of R-32 and R-125 results in lower mean vapor phase velocity. At the same time, at least volatile component, R-134a, increased the concentration for liquid phase throughout the evaporation pro- cess (in both low- and high-quality regions). Consequently, the higher mean density of liquid phase because of R-134a, again, suggests a lower mean liquid velocity. Therefore, compared to R-22, lower mean gas and liquid phase velocities are likely for the mixtures R-407C during the evaporation process. As a result, this may cause the delay of flow pattern transition and lower pressure gradient for R-407C.
Figure 5 shows the two-phase friction factors defined by Equation 9 plotted against Reeq for both R-22 and R-407C. The figure shows a very small dependence of the friction factor on the Reynolds number for R-22 refrigerant. Kuo and Wang (1996b) also reported that the two-phase friction factors for R-22 are relatively independent of the Reynolds number inside a 9.52-mm smooth tube. Data presented here suggest ftp = 0.0089 for R-22. The ftp of R-407C refrigerant, however, are considerably lower than that of R-22, especially for Re < 105. For the present test results for R-407C (excluding G = 100 k g / m z s), the two-phase
o
l0
10"
R-22 and R-407C in O6.5mm smooth tube
R - 2 2 R - 4 U T C A :O-100 • :G=I00 O : O = 2 0 0 41, : G - 2 0 0 [] :O=300 • :G=300 0 : O - ~ O 0 • : G - 4 0 0 w : o - ~ ] o • : 0 = 5 0 0 0 : G - ~ O , ~ :o=7oo fq)=O.O089 • A @ ~ " ftp=.0.0027+(2.3x10.5Re0.5 ) -(4.6 × 10" 14Re2) i i i i i i i i [ i r i [ i I I s 10 10 1 0 -2 10 "~ 10 Figure 5 R-407C R e
Two-phase flow friction factors for both R-22 and
friction factors can be correlated as follows:
f t p = - 2 . 7 1 4 x 1 0 - 3 + 2 . 3 × 1 0 - S R e ° 5 - 4 . 6 × 1 0 - 1 4 R e 2 (13) This equation can correlate 86% of the experimental data (G > 200 k g / m 2 s) within +10%. The dependence of two-phase friction factor for R-407C upon the Reynolds number may be attributed to the nonlinear variations of physical properties in the evaporation process. Notice that the two-phase friction factor defined in Equation 9 is related to the physical properties of liquid viscosity, vapor viscosity, liquid density, and vapor density of the mixtures. Evaluation of these physical properties is based on the initial concentration of R-407C. It is obvious that the actual value of ~ may change considerably during the evapora- tion process because of the variations of concentration. Accord- ingly, a very different behavior of ftp is shown. Unfortunately, there is no appropriate method to estimate the actual composi- tion shift of the R-407C during the evaporation.
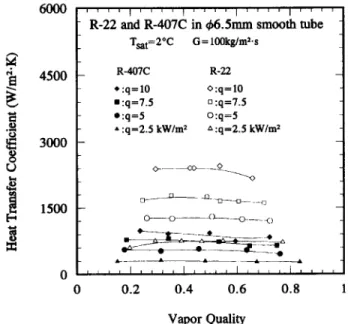
For a lower mass, flux G = 100 k g / m 2 s, the effect of heat flux on heat transfer coefficient is shown in Figure 6 (T~a t = 2°C, q = 2.5,5,7.5, and 10 kW/m2). As seen, the effect of heat flux is very pronounced, and the heat transfer coefficients for R-22 do not increase with the vapor quality. This can be illustrated by the flow pattern, as shown in Figure 4a. As shown, the flow pattern is
6000 d 4500 3000 ~ 1500 0 ' ' ' ' I . . . . I . . . . I . . . . I . . . .
R-22 and R-407C in ~6.5mm smooth tube Tsat=2*C G = 100kg/m2.s R-407C R-22 *:q=10 O:q=10 a:q=7.5 o:q=7.5 e:q=5 O:q=5 - :q=2.5 kW/m 2 Z~:q=2.5 kW/m2 o O - - - ~ O . O - - - _ _ O _ < ) A - . . . . A A ~ 0.2 0.4 0.6 0.8 Vapor Quality
Figure 6 Effect of heat flux on the evaporating heat transfer coefficient for G = 100 kg/m 2 s
intermittent or stratified flow at a mass flux of 100 k g / m 2 s. This indicates that the thinning of wavy liquid film does not effectively increase the heat transfer coefficient as compared to the annular flow pattern. A close examination of both R-22 and R-407C data indicates that the heat transfer coefficients are proportional to q0.6-0.7:5. Apparently, the heat transfer character- istics are dominated by nucleate boiling. The experimental re- sults for R-22 are ana~logous to those of Wattelet et al. (1994) and Ha and Bergles (1994) for stratified wavy flow pattern (G = 50 k g / m 2 s).
Figure 7 shows the variation of heat transfer coefficient
versus quality with a fixed mass flux and varying heat flux
(G = 400 k g / m 2 s, Tsat = 2°C, q = 5, 10, 15, and 20 k W / m 2 ) . As expected, the heat transfer coefficients for pure refrigerant R-22 increase with t h e quality. Meanwhile, the heat transfer coeffi- cients for R-22 increa:~e with the heat flux at the low quality region because of the nucleate boiling contribution, and eventu- ally merge at higher qualities because of the suppression of nucleate boiling component by the thinning of the annular liquid film. The heat transfer coefficients for R-407C, however, reveal completely different behaviors as compared to R-22. As seen in the figure, the experimental data for R-407C show that the heat transfer coefficients reach a maximum value of near 20% aver- age vapor quality and then decrease monotonically with the increase in vapor qual:ity. The results here were similar to the data of R-402A and R-404A as tested by Kattan et al. (1995a). Note that R-402A and R-404A are also mixtures. They explained that the maximum phenomenon of the mixtures is caused by a change in flow pattem in another paper (Kattan et al. 1995b). Actually, this phenomenon is attributed to the definition of heat transfer coefficient. In the definition of heat transfer coefficient.
q
h = (14)
Tw - rs~,
where Tsa t is defined as the initial bubble temperature Zbub, i.
In the beginning of evaporation of R-407C, the saturation temperature T~t is equal to the initial bubble temperature Tbub, i. AS evaporation proceeds, the saturation temperature increases along the axial direction. In previous literature, two types of saturation temperature have been used; a measured bulk fluid
temperature, and a calculated saturation temperature corre- sponding to the pressure. The first approach, fluid bulk tempera- ture, is difficult to use in practice, because design engineers usually do not know the bulk mean temperature but do know the pressure; thus, the heat transfer coefficient based on the initial saturation temperature would be more useful. Jung (1988) and Sardesai et al. (1982) also suggest this approach should be adopted. Therefore, using the initial bubble point temperature may result in overestimation of the driving potential T w - T~a t. Eventually, an underestimation of heat transfer coefficient is shown, as illustrated in Figure 7.
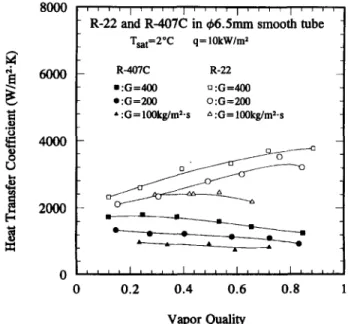
Figure 8 shows the effect of mass flux at fixed heat flux (Tsa t = 2°C and q = 10 k W / m 2 ) . As expected, the heat transfer coefficients increase with mass flux. The closing of heat transfer coefficients for R-22 at low quality (x < 0.25) for G = 100, 200, and 400 k g / m 2 s are caused by intermittent flow, as observed in the figure. For the intermittent flow pattern, the major heat transfer mechanism is nucleate boiling, and the effect of mass flux may be smaller. For R-407C data, the heat transfer coeffi- cients increase with mass flux but decrease with the increase in vapor quality. This is caused by overestimation of wall superheat. To correct the "excess of wall superheat," we can use the following simplified approach. As addressed previously, the bulk fluid temperature for R-407C will increase with the vapor qual- ity. Actually, at p = 609 kPa, the initial bubble point is 2°C, and its corresponding dew point temperature is 8.28°C. the tempera- ture glide A0 is 6.28°C. Using a linear approximation of bulk fluid temperature T s a t , m o d : Tbub, i -~'X A0 we can recalculate the
heat transfer coefficients as q / ( T w
-Tsat,
mod). AS seen in the figure, for G = 100 k g / m 2 s, the modified heat transfer coeffi- cients for R-407C are approximately 50% lower than those of R-22. The difference between the modified heat transfer coeffi- cients for R-407C and R-22 decreases by approximately 40% for G = 200 k g / m 2 s and by about 5% for G = 400 k g / m 2 s. This phenomenon is associated with the transition of major heat transfer mechanism. As illustrated in a previous section, the major heat transfer mechanism at G = 100 k g / m 2 s is nucleate boiling. A further increase in mass flux virtually increases the contribution of convective evaporation. It is well known that, because of the mass transfer resistance, the nucleate boiling heat transfer coefficients for mixtures are considerably lower than10000 8OOO ,4 ooo r j 4 o o o 2ooo 0 , , , , i , , , , i , , , , i , , . r , i , , , , R-22 and R ~ 0 7 C in ~6.5mm s m i t h tube Tsat=2°C G=400kg/mZ.s R-407C R-22 *:q---20 O : q = 2 0 • :q=15 o :q=15 e:q=10 O:q=10 *:q=5 kW/m ~ &:q=5 kW/rn 2 D . . A 0 . 2 0 . 4 0 . 6 0 . 8 Vapor Quality Figure 7 Effect of h e a t f l u x o n t h e e v a p o r a t i n g h e a t t r a n s f e r c o e f f i c i e n t f o r G = 4 0 0 k g / m 2 s 8000 40OO O r..)
i ooo
' ~ ' ' I ~ ' ' ' I ' ' ' ' I . . . . I ' ' 'R-22 and R-407C in ~b6.5mm smooth tube Tsat=2°C q= 10kW/rn 2 R-407C R-22 • :G=400 ~ :G=400 e:O=200 o:G=200 • :G= 100kg/m2-s ~ :G= 100kg/m2-s . . . . t , , i I I = = t = I t = j , I . . . . 0.2 0.4 0.6 0.8 Vapor Quality Figure 8 E f f e c t o f m a s s f l u x o n t h e e v a p o r a t i n g h e a t trans- fer c o e f f i c i e n t
Heat transfer for R-22/R-407C in a smooth pipe: C-. C. Wang and C-. S. Chiang
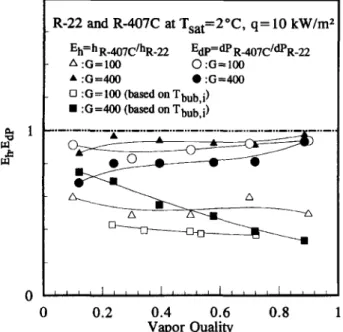
R - 2 2 a n d R - 4 0 7 C at T s a t = 2 * C , q = 10 k W / m 2 Eh=h R_407C/hR.22 Edp=dP R_407c/dPR_22
A :G= 100 C) :G=100
• :G=400 • :G=400
[] :G=I00 (based on Tbub,i)
• :G=400 (based on Tbub, i)
. . . . . . .
0 i t l , l l l L i l l l I I I l ~ l l i l i l l
0 0 . 2 0 . 4 0 . 6 0 . 8 1
Vapor Q u a l i t y
Figure 9 Heat transfer/pressure drop decrease ratio for
R-407C based on initial bubble point temperature and modi-
fied saturation temperature
those of pure components. Consequently, a considerable reduc- tion of heat transfer coefficients for R-407C at G = 100 k g / m 2 s is seen. For a mass flux of 400 kg / m 2 s, as shown in Figure 4b, despite some delay of transition of flow pattern for R-407C, the annular flow pattern becomes the dominate flow pattern for b o t h R-22 and R-407C. Thus, the mass transfer resistence to the convective evaporation may be considerably reduced because of the contribution of a more volatile heat transfer coefficient; and because: (1) highly turbulent interface between vapor and liquid interface distorts the mass transfer resistance boundary; and (2) as seen in Figure 4b, the liquid e n t r a i n m e n t induced by high mass flux may disturb the mass transfer resistance.
The present test results are consistent with those reported by Wattelet et al. (1994). Their data of R-134a and MP-39 (a mixture of 5 2 % / 3 3 % / 1 5 % of R - 2 2 / R - 1 2 4 / R - 1 5 2 a ) had indi- cated that the heat transfer coefficients for MP-39 are com- parable to R-134a at high mass fluxes ( G > 300 k g / m 2 s), and they fall below R-134a for more t h a n 50% as G < 100 k g / m 2 s. The test results can be illustrated further using the "de- creased ratio" expressed as hR_407c/hR.22 and APR.4O7c/APR_22 .
Results are plotted against vapor quality in Figure 9. The heat transfer results for R-407C are shown based on initial bubble point and a calculated linear bulk temperature. Apparently, reductions of heat transfer coefficients are more p r o n o u n c e d for low mass flux ( G = 100 k g / m 2 s), and the effect diminishes for higher mass flux.
C o n c l u s i o n s
Two-phase flow pattern, friction, and heat transfer characteris- tics for R-22 and R-407C inside a 6.5-mm smooth tube are reported in this study. Conclusions of the present study include the following.
(1) The two-phase friction factors for pure refrigerant are rela- tively insensitive to the change of Reynolds number.
(2) Development of the flow pattern for R-407C falls behind the pure refrigerant R-22.
(3) At G = 100 k g / m 2 s, the major flow patterns are intermit- tent and stratified flows. Consequently, the major heat trans- fer mechanism is nucleate boiling, and further increase of mass flux to 400 k g / m 2 s results in higher contribution of convective evaporation.
(4) Both the pressure drop and heat transfer coefficients for R-407C are considerably lower than those of R-22. The lower pressure drop of R-407C may be caused by delay of the development flow pattern.
(5) With a suitable adjustment of the wall superheat of R-407C, we find that the effect of mass transfer resistance becomes less profound as G increase to 400 k g / m 2 s.
A c k n o w l e d g m e n t s
The authors are grateful for the Energy R & D foundation fund- ing from the Energy Commission of the Ministry of Economic Affairs for supporting this research work.
R e f e r e n c e s
Duiker, A. E., Wicks, M. and Cleveland, R. G. 1964. Pressure drop
and hold-up in two-phase flow--part A. A comparison of existing correlations and Part B. An approach through similarity analysis.
A I C h E J., 10, 38-51
Ha, S. and Bergles, A. E. 1994. Some aspects of experimental in-tube evaportation. Proc. l Oth Int. Heat Transfer Conference, 6, 187-192 Jung, D. G. 1988. Mixtures effects on horizontal convective boiling heat transfer. Ph.D. thesis, University of Maryland, College Park, MD, 185
Kedzierski, A., Kim, J. H. and Didion, D. A. 1992. Cause of the apparant heat transfer degradation for refrigerant mixtures. In
Two-phase Flow and Heat Transfer, HTD, Vol. 197, ASME, New York, 149-158
Kattan, N., Thome, J. R. and Favrat. F. 1995a. R-502 and two near-azeotropic alternatives: Part I--In-tube flow boiling tests. Paper presented at ASHRAE winter meeting (Paper no. CH-95- 12-3 3878)
Kattan, N., Thome, J. R. and Favrat. F. 1995b. R-502 and two near-azeotropic alternatives: Part II--TwO-phase flow patterns. Paper presented at ASHRAE winter meeting (Paper No. CH-95- 14-3 3879)
Kuo, C. S. and Wang, C. C. 1996a. Horizontal flow boiling of R22 and R407C in a 9.52 mm micro-fin tube. Appl. Therm. Eng., 16, 719-731
Kuo, C. S. and Wang, C. C. 1996b. In-tube evaporation of HCFC-22 in a 9.52-mm microfin/smooth tube. Int. J. Heat Mass Transfer,
39, 2559-2569
Moffat, R. J. 1988. Describing the uncertainties in experimental results. Exp. Thermal Fluid Sci., 1, 3-17
REFPROP. 1996. Thermodynamic Properties of Refrigerants and Refrigerant Mixtures, Version 5.0, Gaithersburg, MD: National Institute of Standards and Technology
Sardesai, R. G., Shock, R. A. W. and Butterworth, D. 1982. Heat and
mass transfer in multicomponent condensation and boiling. Heat Transfer Eng., 3, 104-114
Wang, C. C., Kuo, C. S., Chang, Y. J. and Lu, D. C. 1996. Two-phase heat transfer and friction characteristics of R-22 and R-407C.
A S H R A E Trans., 102, 830-838
Wattelet, J. P., Chato, J. C., Souza, A. L. and Christofferson, B. R. 1994. Evaporate characteristics of R-12, R-134a, and a mixture at low mass fluxes. A S H R A E Trans. 100, 603-615