Use of statistical methods to find the polysaccharide structural
characteristics and the relationships between monosaccharide
composition ratio and macrophage stimulatory activity
of regionally different strains of Lentinula edodes
Tiffany Chien Ting Lo
a, Yi Huei Jiang
b, Anne Lien Ju Chao
b, Cheng Allen Chang
a,∗aDepartment of Biological Science and Technology, National Chiao Tung University, Hsinchu, Taiwan, ROC bInstitute of Statistics, National Tsing Hua University, Hsinchu, Taiwan, ROC
Received 21 April 2006; received in revised form 23 October 2006; accepted 31 October 2006 Available online 7 November 2006
Abstract
Multiple linear regression analysis was used to deduce the correlation between the monosaccharide composition ratios of 10 regionally different strains of Lentinula edodes and their in vitro macrophage stimulatory activities. Arabinose, xylose, mannose and galactose were identified as the monosaccharides that could be related to macrophage stimulatory activities. Additional principal component analysis and factor analysis methods were used to treat the same monosaccharide composition ratio data and the compositions of arabinose, xylose, mannose and galactose were found to be important. Interestingly, glucose, although presented in large compositions in all strains presumably forms the backbone of the polysaccharide structures, is not selected as the determinant factor for either structural characteristics or that of the in vitro macrophage stimulatory activities. © 2006 Elsevier B.V. All rights reserved.
Keywords: Lentinula edodes; Polysaccharide; Multiple linear regression analysis; Principal component analysis; Factor analysis; Macrophage stimulatory activity
1. Introduction
Different strains of higher Basidiomycota mushrooms are known to produce biologically active polysaccharides (PS) with different properties and chemical structures. The structures include mainly glucan and glycan normally synthesized bio-logically to form tree structures with various types of branched linkages[1]. Glucan and glycan play key roles in cell communi-cation, protein interaction and immunity. Various monosaccha-rides form the nodes of the tree structures and with glycosidic bonds leading to branched linkages. For each monosaccaride there are six possible hydroxyl groups for linkage formation and two possible anomality ‘␣’ or ‘’ could result[2].
Polysaccharides isolated from the different strains of Poria
cocos mycelia showed different in vivo and in vitro anti-tumor
activities, depending on their monosaccharide composition,
∗Corresponding author. Tel.: +886 3 5712121x56903; fax: +886 3 5729288. E-mail address:changca@cc.nctu.edu.tw(C.A. Chang).
molecular mass, and chain conformation [3]. In a previous paper, we reported the monosaccharide composition, molecular weight, structural linkage, immuno-modulating and anti-tumor activities for polysaccharides extracted from different phy-logenetic groups of 10 regional Lentinula edodes [4]. The immuno-modulating properties and anti-tumor activities of these L. edodes extracts were tested and the results showed that the 10 isolated L. edodes could be classified into three distinct groups using amplified fragment length polymorphism assay. All polysaccharides had similar molecular weight distribution between 1× 10⁴and 3× 10⁶. The monosaccharide composition analysis revealed the presence of heterogeneous materials con-taining glucose, mannose, xylose, galactose, fucose, rhamnose and arabinose in different ratios. Most of the extracts exhibited significant enhancement in macrophage stimulatory activi-ties (MSA). However, although several studies were reported concerning the immunological activity and structure of polysac-charides (mostly -glucan) in regionally different L. edodes, the determining factors for the structure–function relationships remained unsolved.
0003-2670/$ – see front matter © 2006 Elsevier B.V. All rights reserved. doi:10.1016/j.aca.2006.10.051
Many methods in applied mathematics and statistics are often used to summarize and/or simplify complex data and help deduc-ing relationships among variables. Regression analyses have been broadly used to predict sources or structure–function rela-tionships in biological sciences. Examples include the use of regression analyses to predict the distribution of tree and shrub species, terrestrial animal species[5], drug discovery[6], and culture condition of L. edodes[7]. However, for different areas and/or at different resolutions, it may be difficult to compare the results of these methods[5].
A simple linear regression analysis of monosaccharide (ara-binose, mannose and xylose) contents in sediments was used to determine the sources of carbohydrates[8]. In addition, prin-cipal component analysis and factor analysis could be useful in describing and classifying different functional or struc-tural groups, for the measure of glycan structures taking into account of species, for the exploration of molecular structural characteristics, for the evaluation of the polysaccharide compo-sition in lignfied woody plant cell wall, for the evaluation of molecular lipophilicity, for the understanding of organic reac-tion mechanisms, for quantitative structure–retenreac-tion studies in chromatography, for quantitative structure–biodegradatoion relationships, and for classification of drug-free subject and drug abuses groups using the metal contents in hair samples[1,6,9]. For example, Hori and Sugiyama used a combination of FT-IR microscopic techniques and principal component analysis method to investigate the chemical variations between softwood species as well as types of wood cell walls[10]. Hizukuri et al., applied the principal component analysis to the composition data and found that the compositions of mannose, xylose and
arabinose were important characteristics that distinguished the difference between yeast, sycamore and wheat[2].
To the best of our knowledge, there have been few reports using more than one statistical methods for a comprehen-sive analysis of experimental data to deduce polysaccharide structure–function relationships, particularly when the amount of data are limited [6]. In this paper, we report the results of using multiple linear regression analysis method to deduce the correlation between the monosaccharide composition ratios and
in vitro macrophage stimulatory activities of polysaccharides
obtained from different mushroom strains. In addition, princi-pal component analysis and factor analysis methods were used to find polysaccharide structural characteristics of these L. edodes.
2. Experimental
2.1. Materials and data
The 10 isolates of L. edodes obtained were: No. 135 (L24) and No. 939 (L25) from China, Tainung No. 1 “white cap” (L1) and “red cap” (L4) from Taiwan, Japanese 271 (L11, L15), Jongxing 5 (L6), Jongxing 8 (L10), Hey-King-Gang (L21) and Jong-Wen 600 (L23) from Japan. The experimental procedures on culture broth filtrate (CBF) preparation, monosaccharide composition and MSA assay’s of the mushroom strains was described in detail by Lo et al.[4]. Briefly, the monosaccharide compositions of PS from CBF (2 mg) were determined by using methods described by Blakeney and Hoebler [11,12], from standard calibration curves of individual monosaccharides [13,Table 1]. Macrophage stimulatory activity (MSA) was determined by measuring the
Table 1
Monosaccharide composition and MSA of culture broth filtrate of different strains of Lentinula edodes: (A) selected raw data and (B) operation data
L. edodes Monosaccharide compositions (molar ratio) Optical density
Arabinose Xylose Mannose Galactose Glucose Rhamnose Fucose NBT reduction
(A) Selected raw data
L1 0.46 0.37 2.45 0.11 4.2 0 0 0.37 L4 0.79 0.75 3.46 0.36 1.62 0.02 0.04 0.35 L6 0.49 0.35 1.89 0.15 3.03 0.01 0.01 0.43 L10 0.57 0.41 1.98 0.26 4.13 0 0 0.49 L11 0.59 0.46 3.19 0.38 4.14 0.01 0.02 0.4 L15 0.59 0.42 2.17 0.15 7.47 0.03 0.01 0.52 L21 0.5 0.35 1.99 0.22 2.81 0.03 0.03 0.44 L23 0.54 0.39 1.88 0.22 3.96 0.02 0.01 0.5 L24 0.27 0.14 0.89 0 10.9 0.06 0.02 0.38 L25 0.42 0.29 2 0.12 3.59 0.03 0.02 0.36 Lentinula edodes L1 L4 L6 L10 L11 L15 L21 L23 L24 L25 (B) Operation data Arabinose % 6.03 11.19 8.25 7.77 6.76 5.41 8.42 7.73 2.22 6.45 Xylose % 4.82 10.65 5.89 5.58 5.21 3.83 5.88 5.49 1.13 4.55 Mannose % 32.28 49.22 31.83 26.89 36.24 20.02 33.5 26.72 7.23 30.91 Galactose % 1.44 5.09 2.59 3.56 4.3 1.42 3.73 3.19 0.03 1.87 Glucose % 55.44 23.1 50.95 56.2 47.12 68.93 47.36 56.36 88.82 55.58 Rhamnose % 0 0.22 0.24 0 0.14 0.28 0.56 0.32 0.45 0.4 Fucose % 0 0.52 0.24 0 0.24 0.11 0.56 0.19 0.12 0.24 Exopolysaccharide content (mg mL−1) 0.58 0.61 0.53 0.31 0.48 0.44 0.2 0.15 0.59 0.59 MSA (% NBT reduction) 166 150 317 449 230 489 330 464 200 153
O2−anion production of macrophage cell line (Mouse BALB/C macrophage, RAW 264.7) with a modified nitroblue tetrazolium (NBT, Sigma) reduction assay [4, Table 1]. The RAW 264.7 cell line was cultured in Dulbecco’s modified Eagle’s medium (DMEM, Gibco) containing 10% fetal bovine serum (FBS, Hyclone). The macrophage cells were placed into wells of a 96-well microtiter plate (2.5× 10⁵ per well) and were treated with 20L of CBF or HWE for 48 h at 37◦C. After removal of the supernatant, the macrophage cell monolayers were covered with 100L of 2 mg mL−1of NBT. The plates with stimulated cells were incubated for 4 h at 37◦C. The reduced formazans within macrophage cells were solubilized in DMSO (Merck). Optical densities were measured using an ELISA reader at 570 nm[14,15]. L. edodes culture medium was used for con-trol experiments and PBS (phosphate-buffer saline) as blank solution for optical density experiments. The % NBT reduced was estimated using the equation:{[(sample average) − (blank average)]/[(control average)− (blank average)]} × 100.
2.2. Multiple linear regression analysis (MLRA)
Multiple linear regression analysis was conducted similarly to a previous reported paper with minor modifications[5]. With a multiple regression model, the relationship is described using a generalization of a straight line equation (Eq.(1)):
Y = β0+ β1X1+ β2X2+ · · · + βpXp+ e (1)
where Y denotes the response variable (NBT reduction value),
β0a constant (intercept), X1, X2,. . ., Xp a vector of p
predic-tor variables (monosaccharide composition value), andβ1,β2,
. . ., βpis the vector of p regression coefficients. Each predictor
variable has its own coefficient, and the outcome variable is pre-dicted from a combination of all the variables multiplied by their respective coefficients plus an error term. The relationship was determined using the least square fitting technique. A residual analysis was used to check the model fitting[16]. MLRA was performed using the computer software-Statistical Package for the Social Sciences (SPSS) and S-PLUS.
2.3. Principal component analysis (PCA)
Principal component analysis was used to transform a number of potentially correlated variables (descriptors) into a number of relatively independent variables that could be ranked based upon their contribution for explaining the variation of the whole data set [6]. Based on this method, the relatively important components of high-dimensional pattern could be successfully identified. Thus, the original high-dimensional data could be mapped onto a lower dimensional space, and therefore the com-plexity of a high-dimensional pattern classification problem is substantially reduced[1].
For a random vector x, where
x = (χ1, . . . , χn)T (2)
The mean of the random vector is denoted by
μx= E{x} (3)
And the covariance matrix of the same random vector is
Cx= E{(x − μx)(x − μx)T} (4)
The components of Cx, denoted by Cij, represent the
covari-ances between the random variable componentsχiandχj. The
component Ciiis the variance of the componentχi. The variance
of a component indicates a measure of spread of the component values around its mean value. If two componentsχiandχjof the
data are uncorrelated, then their covariance is zero (Cij= Cji= 0).
The covariance matrix is, by definition, always symmetric. From a sample of vectors X1,. . ., XM, the sample mean and sample
covariance matrix can be calculated to estimate the mean and the covariance matrix, respectively.
From a symmetric matrix such as the covariance matrix, an orthogonal basis can be calculated by finding its eigen-values and eigenvectors. The eigenvectors ei and the
cor-responding eigenvalues λi are the solutions of the equation [17]:
Cxei = λiei, i = 1, . . . , n (5) For our present study, data matrix consisted of the monosac-charide compositions of 10 strains of L. edodes and pattern recognition based on PCA was performed using the SPSS
[6,9,16].
2.4. Factor analysis (FA)
Factor analysis was used to describe the correlation among several variables in terms of a few quantities, i.e. factors. FA and PCA are two different approaches to analyze the corre-lation structure of a set of real valued random variables. In practice, it is often observed that the results of FA are very close to those of PCA. These two approaches are strongly related to each other[18]. FA uses an estimate of common variance among the original variables in order to generate the factor solu-tion. A factor is the linear combination of original variables. The number of factors will always be less than the number of original variables(6). The aim of FA is to summarize the correlation structure of observed variables X1, X2,. . ., Xp. For
this purpose one constructs k < p unobservable or latent vari-ables f1, . . ., fk, which are called the factors, and which are
linked with the original variables through the equation for each 1≤ j ≤ p:
Xj= λj1f1+ λj2f2+ · · · + λjkfk+ εj (6)
The error variablesε1,. . ., εpare assumed to be independent,
but they have specific variancesψ1,. . ., ψp. The coefficients,
λjl, called factor loadings, are elements of the matrix of loadings
Λ[19].
Factor analyses to evaluate relationships between different strains and monosaccharide compositions were also carried out using SAS[6,20].
3. Results
3.1. Multiple linear regression analysis
The method adopted here allowed us to detect major monosaccharide composition differences between the 10 strains and to predict characteristic components of each polysaccharide immuno-competence. Using multiple regression backward anal-ysis, the P-values for testing linear detected relationship were (a) arabinose < 0.001, (b) xylose < 0.001, (c) mannose < 0.001, (d) galactose = 0.007, (e) fucose < 0.001. For other monosaccha-rides, the P-values were >0.1. A P-value < 0.05 was considered to be statistical significant. The coefficient of determination (R2) which measures the model fit was 0.949. To predict rela-tionship between monosaccharide ratio and MSA, Eq.(7)was obtained:
Y (% macrophage activity)
= 0.138 + 1.668XAra− 1.140XXyl− 0.051XMan
− 0.0995XGal− 0.743XFuc (7)
where ‘X’ defines the concentration of monosaccharide mea-sured in the extract. The positive coefficient for XAraindicates
that the macrophage stimulatory activity increases with increas-ing XAra. The negative coefficients for XXyl, XMan, XGal, and
XFucindicate that the macrophage stimulatory activity decreases
with the corresponding increasing XXyl, XMan, XGal, and
XFuc.
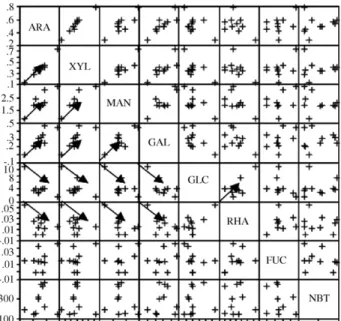
The scatter plot matrix showed that arabinose and xylose were rather highly positively correlated (Pearson correlation = 0.971) and meaning that in going from one polysaccharide to the other, a higher value of XArawas found normally with a higher value
of XXyl. These kind of positive correlations were also found
among (a) arabinose and xylose, mannose, galactose, (b) xylose and mannose, galactose, (c) mannose and galactose, (d) glu-cose and rhamnose. On the other hand, negative correlations were found among (a) glucose and arabinose, xylose, mannose, galactose, (b) rhamnose and arabinose, xylose, mannose, galac-tose (Fig. 1). In these cases, a higher value of, e.g. Xglc, was
accompanied by lower values of XArs, XXyl, XMan, and XGal.
Note that positive monosaccharide composition correlations do not necessarily lead to positive MSA activities. For example, the monosaccharide compositions of arabinose and xylose are highly positively correlated for these 10 strains of L. edodes; however, arabinose has a positive MAS coefficient but xylose has a negative one.
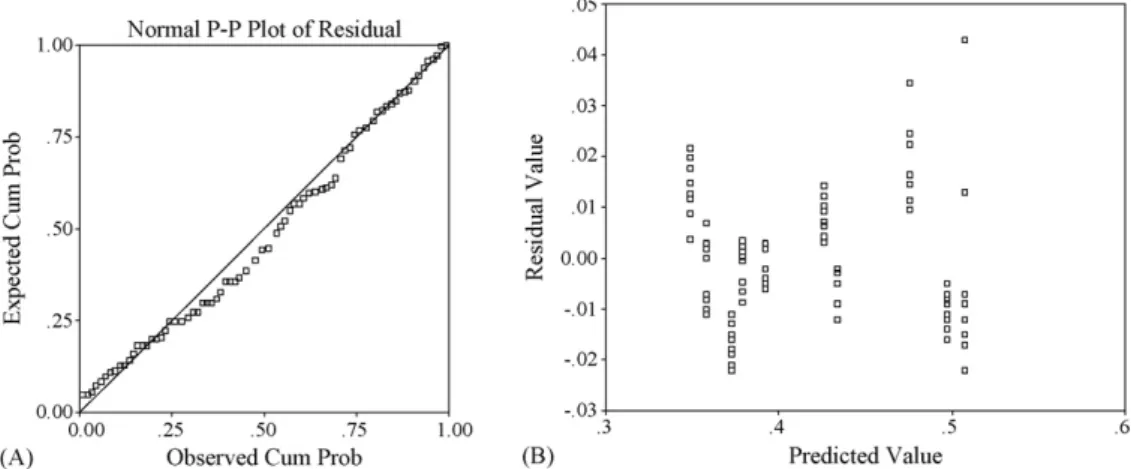
The accuracy of the multiple linear regression analysis results was further tested by residual analysis [14]. The residual is defined as follows:
residual= observed value − predicted value (8)
The normal P–P plot of regression residuals using SPSS was obtained in order to assess whether the normality assumption was violated. The plot that supports the normality assumption was constructed for the cumulative proportions of residuals against the cumulative proportions of the normal distribution
Fig. 1. 2D scatter plot of the relationship between all monosaccharide compo-sitions and macrophage activity (NBT reduction).
(Fig. 2A). The normal probability plot showed a light tail dis-tribution plot indicating normality is approximately valid. To check if the assumption of constant variance is not violated, the residuals were plotted against the predicted values. The change in the spread or dispersion of the plotted points could be used to detect whether the constant variance was satisfied or not. As seen inFig. 2B, the points were dispersed in a non-systematic way, confirming the reliability of predicted model.
3.2. Principal component analysis and factor analysis
The arabinose, xylose, mannose and galactose (eigen-value = 4.71) were the dominating features in the first principal component (Prin1) that represented 67% of the monosaccharide composition property. Monosaccharides such as rhamnose and fucose (eigenvalue = 1.39) were features in the second principal component (Prin2) that represented 20% of the monosaccha-ride composition property. The correlation matrix, eigenvectors and eigenvalue data were shown inTable 2A and B. The PCA two-dimensional plot (i.e. Prin1 versus Prin2, Fig. 3) revealed that L1, L4, L11, L24 and L25 were located further from the rest, which happened to be the group of relatively poorer MSA (macrophage stimulating activity). Those with better MSA, i.e. L6, L10, L15, L21 and L23, are located closer to the line of Prin1 = 0. Thus, PCA analysis, although designed to find only structural characteristics, was able to classify these polysaccha-rides roughly into a more active MSA group and a less active MSA one indirectly.
A third test using factor analysis (FA) indicated that the composition of arabinose, xylose, mannose and galactose were important structural characteristics among these polysaccha-rides (Table 3andFig. 4). These four monosaccharides were identical to those found for Prin1 in PCA, which further corrob-orated the generally believed consistent results from both PCA and FA methods.
Fig. 2. (A) Normal P–P plot of regression residuals (dependent variable: NBT reduction). (B) Plot of residuals vs. predicted for the NBT reduction data.
Table 2
Correlation data of the correlation matrix (A) and eigenvectors (B) for the seven variables
Arabinose Xylose Mannose Galactose Glucose Rhamnose Fucose
(A) Correlation matrix
Arabinose 1 0.971 0.842 0.864 −0.628 −0.516 0.4 Xylose 0.971 1 0.886 0.815 −0.645 −0.507 0.449 Mannose 0.842 0.886 1 0.825 −0.649 −0.589 0.386 Galactose 0.864 0.815 0.825 1 −0.656 −0.51 0.439 Glucose −0.628 −0.645 −0.649 −0.656 1 0.662 −0.319 Rhamnose −0.516 −0.507 −0.589 −0.51 0.662 1 0.373 Fucose 0.4 0.449 0.386 0.439 −0.319 0.373 1
Prin1 Prin2 Prin3 Prin4 Prin5 Prin6 Prin7
(B) Eigenvectors Arabinose 0.434 0.059 0.332 −0.185 −0.483 0.391 −0.527 Xylose 0.437 0.085 0.278 −0.462 −0.172 −0.39 0.574 Mannose 0.428 0.002 0.187 −0.069 0.814 0.339 0.001 Galactose 0.421 0.071 0.105 0.854 −0.153 −0.05 0.225 Glucose −0.368 0.135 0.813 0.132 0.152 −0.323 −0.201 Rhamnose −0.292 0.647 0.104 −0.016 −0.104 0.554 0.409 Fucose 0.197 0.74 −0.307 −0.024 0.134 −0.408 −0.367 Eigenvalues 4.706 1.394 0.494 0.202 0.176 0.02 0.009
Fig. 3. PCA for composition data: relationship among different strains. Plot of Prin1 and Prin2.
Table 3
Factor pattern data for factors 1 and 2
Factors/monosaccharides Factor 1 Factor 2
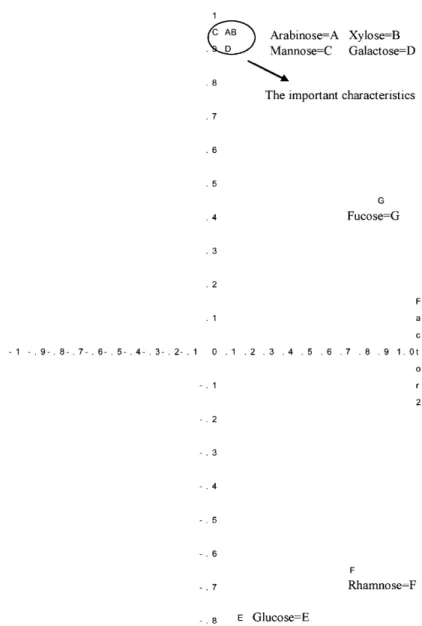
Xylose 0.947 0.1 Arabinose 0.942 0.069 Mannose 0.929 0.002 Galactose 0.914 0.084 Glucose −0.799 0.159 Fucose 0.427 0.874 Rhamnose −0.634 0.764
Fig. 4. Plot of factor pattern for factors 1 and 2.
4. Discussion and conclusions
Multiple linear regression analysis method was useful to deduce the correlation between monosaccharide composition and macrophage stimulating activity data of 10 different strains of L. edodes. The principal component analysis and factor analysis methods were useful to find polysaccharide struc-tural characteristics. Our present data and previous reports all pointed out that arabinose, xylose, mannose and galactose were related to biological functions and were unique polysaccha-ride structural characteristics of L. edodes[2,3,21]. Specifically, the present study showed that the three different statistical methods, although applied for different purposes, generated con-sistent polysaccharide structural characteristics and both direct and indirect relationships between monosaccharide composition ratios and macrophage stimulating activities. Because it is not always possible to generate large quantity of experimental data, it is recommended that more than one statistical method are used
for data treatment for more objective results, as shown in this study.
Although the enhanced macrophage activity was found to correlate to the complex polysaccharide structural character-istics, the actual molecular mechanisms involving cell signal transduction and more precise structure–function relationships remained to be explored. Interestingly, glucose, although pre-sented in large compositions in all strains presumably forms the backbone of the polysaccharide structures, is not selected as the determinant factor for either structural characteristics or that of the in vitro macrophage stimulatory activities.
The elucidation of polysaccharide structures and biological activities normally involves complex instrumental techniques and various biological assays. For potential applications of this present study, it is possible to simplify the above-mentioned complexity by just determining the monosaccharide composi-tion ratios and predicting the macrophage stimulatory activity using the established structure–function relationships.
Acknowledgements
This study was supported by Bioresources Collection & Research Center, Food Industry Research and Development Institute, Hsinchu, Taiwan, ROC. A grant from the National Science Council of the Republic of China (Taiwan) for partial support (grant number NSC-95-2113-M-009-025) of this work is also acknowledged.
References
[1] H. Morais, C. Ramos, E. Forgacs, T. Cserhati, J. Oliviera, T. Illes, Chemom. Intell. Lab. Syst. 57 (2001) 57–64.
[2] Y. Hizukuri, K. Hashimoto, Y. Yamanishi, M. Kanehisa, Genome Informat. 15 (2004) 69–81.
[3] Y. Jin, Z.L. Hang, L. Chen, P.C.K. Cheung, V.E.C. Oi, Y. Lin, Carbohydr. Res. 338 (2003) 1517–1521.
[4] C.T. Lo, B.C. Wang, C.A. Chang, submitted for publication.
[5] A. Guisan, T.C. Edwards Jr., T. Hastie, Ecol. Modell. 157 (2002) 89–100. [6] J. Xu, A. Hagler, Molecules 7 (2002) 566–600.
[7] G. Mata, P. Delpech, J.M. Savoie, Rev. Iberoam. Micol. 18 (2001) 118–122.
[8] F. D’souza, A. Garg, N.B. Bhosle, Estuar. Coast. Shelf Sci. 58 (2003) 311–320.
[9] P. Bermejo-Barrera, A. Moreda-Pi˜neiro, A. Bermejo-Barrera, A.M. Bermejo-Barrera, Anal. Chim. Acta 455 (2002) 253–265.
[10] R. Hori, J. Sugiyama, Carbohydr. Polym. 52 (2003) 449–453.
[11] A.B. Blakeney, P.J. Harris, R.J. Henry, B.A. Stone, Carbohydr. Res. 113 (1983) 291–299.
[12] C. Hoebler, J.L. Barry, A. David, J. Delort-Laval, J. Agric. Food Chem. 37 (1989) 360–367.
[13] T.W.D. Chan, P.K. Chan, K.Y. Tang, Anal. Chim. Acta 556 (2006) 226– 236.
[14] A.B. Rodriguez, C. Barriga, R.W. Lea, Dev. Comp. Immunol. 20 (1996) 451–457.
[15] Y. Tsumuraya, A. Misaki, Carbohydr. Res. 74 (1979) 217–225.
[16] H. Faraji, T. Crowe, R. Besant, S. Sokhansanj, H. Wood, Can. Biosys. Eng. 46 (2004) 3.45–3.48.
[17] J. Hollmen, Principal component analysis, EET 13 (1996), 44:32. [18] H. Schneeweiss, H. Mathes, J. Multivar. Anal. 55 (1995) 105–124. [19] G. Pison, P. Rousseeuw, P. Filzmoser, C. Croux, J. Multivar. Anal. 84 (2001)
145–172.
[20] K.T. Sun, Y.S. Lai, Proc. Natl. Sci. Counc. ROC(D) 12 (2002) 19–30. [21] S.V. Reshetnikov, S.P. Wasser, K.K. Tan, Int. J. Med. Mushrooms 3 (2001)