An Array Configuration to Increase the Performance of a Biosensor
Congo Tak-Shing Ching a,b,c,*, Yu-Lung Hung d,*, Chin-Kang Chen d, Tai-Ping Sun a,b, Kok-Khun Yong d, Yue-Xiu Jiang e, Hsiu-Li Shieh a,b, Kang-Ming Chang c,f,*
a Department of Electrical Engineering
National Chi Nan University, Nantou, Taiwan, ROC
b Department of Applied Materials and Optoelectronic Engineering
National Chi Nan University, Nantou, Taiwan, ROC
c Department of Photonics and Communication Engineering
Asia University, Taichung, Taiwan, ROC
d Department of Internal Medicine
Puli Christian Hospital, Nantou, Taiwan, ROC
e Department of Nursing
Puli Christian Hospital, Nantou, Taiwan, ROC
f Graduate Institute of Clinical Medical Science
China Medical University, Taichung, Taiwan, ROC
* Corresponding Author * Name: Congo Tak-Shing Ching
Address: Department of Electrical Engineering, National Chi Nan University, No. 1, University Rd., Puli, Nantou County 54561, Taiwan, ROC
e-mail: tsching@ncnu.edu.tw * Name: Yu-Lung Hung Address: Puli Christian Hospital,
Teh- Shan Rd., Puli, Nantou County 54546, Taiwan, ROC e-mail: talus@mail.pch.org.tw
* Name: Kang-Ming Chang
Address: Graduate Institute of Clinical Medical Science, China Medical University, No. 91 Hsueh-Shih Rd., Taichung 40402, Taiwan, ROC
Abstract
The objective of this study is to investigate whether an amperometric biosensor in an array configuration can increase its signal-to-noise ratio (SNR) so as to increase its performance, like sensitivity. Uric acid biosensor (UAB) was used as an example in this study. Both single UAB (UAB-1x1) and UAB array (UAB-1x2 and UAB-1x3) were fabricated with uricase immobilized on commercial graphite electrodes, with silver-silver chloride (Ag/AgCl) as reference electrode. The UAB showed an excellent (r2 > 0.96) linear response range (0 – 0.8 mM) and moderate response time (~20 s). Results also showed that the sensitivity and SNR of UAB can be significantly increased by the use of an array configuration. It was found that the sensitivity and SNR of the UAB-1x3 is significantly higher (p < 0.05 in all cases) than that of the UAB-1x1 (sensitivity: 3.1-fold; SNR: 4.4-fold) and UAB-1x2 (sensitivity: 1.9-fold; SNR: 3.4-fold). Moreover, an excellent linear relationship (r2 = 0.96) was found between the sensitivity and SNR. Finally, the UAB showed good repeatability (maximal relative standard deviation = 4.9%) and long-term stability (92% of its initial value of current response after 60 days of storage). In conclusion, the use of an array configuration can result in the increase of SNR, which subsequently results in the increase of sensitivity.
1. Introduction
Research and development in biosensors as analytical tools, e.g. clinical diagnosis [1-4], food safety monitoring [5-7], environmental surveillance [5,7,8,9] and so on, have gained increasing importance in the past decade because of their beneficial properties such as simple, reliable, portable and low-cost. On the other hand, many researches have been focusing on the improvement of biosensor performance, for example sensitivity enhancement. In fact, the uses of electron-transfer mediators [10-13], bimetallic materials [14-16], polymer films [17-19], electropolymerized films [20-23], nanoparticles [24-26], carbon nanotubes [27-30], bienzymes [29,30], special electrode materials [31,32], and so on for the enhancement of amperometric biosensor sensitivity have increased notably in recent literature. In spite of the big amount of literature on the improvement of biosensor sensitivity, no paper has been found on studying the enhancement of biosensor signal-to-noise ratio (SNR). In particular, no research was found on investigating the relationship among biosensor configuration, SNR and sensitivity. Therefore, the aim of this study is to investigate whether an amperometric biosensor in an array configuration can increase its SNR in an attempt to increase its sensitivity. An amperometric uric acid biosensor (UAB) was used as an example in this study.
2. Materials and Methods
2.1 Chemicals and Reagents
In this study, all chemicals and reagents were commercially available and they were used with no further purification. Uricase, uric acid, bovine serum albumin (BSA), glutaraldehyde, phosphate buffered saline (PBS) were purchased from Sigma Chemical Co. (St. Louis, MO). De-ionized water purified by a Millipore System (Milli-Q UFplus; Bedford, MA) was used to
(graphite), counter electrode (graphite) and reference electrode (silver-silver chloride, Ag/AgCl), was purchased from Zensor R&D Co., LTD (Taichung, TW).
2.2 Immobilization of Uricase onto the Sensor for the Fabrication of UAB
Glutaraldehyde (2.5%, 4 L) was initially pipetted onto the working electrode of the sensor and then kept at 4 C for 1 hour. Afterward, the enzyme (uricase, 0.5 U/mL, 4 L) was pipetted again onto the working electrode of the sensor, followed immediately by adding BSA (0.1 mM, 4 L). Lastly, the sensor was kept in the dark at 4 C before use.
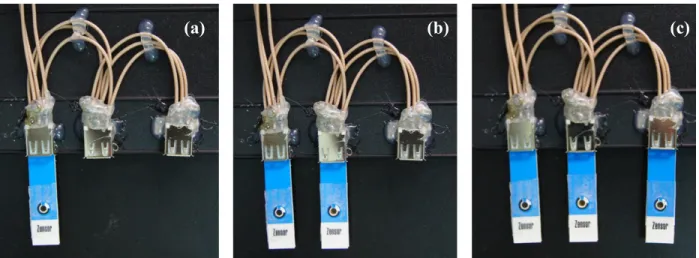
The above mentioned procedure is the fabrication steps of a single UAB (UAB-1x1). For the fabrication of UAB array in the configuration of 1x2 (UAB-1x2) and 1x3 (UAB-1x3), it is simply constructed by combining 2 pieces and 3 pieces of UAB-1x1 in parallel, respectively (Fig. 1).
2.3 Hydrodynamic Voltammetry Measurements of the UAB
Measurements were conducted, using an electrochemical analyzer (CHI 627C, CH Instrument, USA), with the UAB immersing in a solution of 0.8 mM uric acid solution subjected to steady stirring at 25 C. Incremental potentials (0 – 1 V, 0.1 V increments) versus Ag/AgCl electrode of the sensor were applied to the working electrode of the UAB and the current responses of the UAB to uric acid were measured.
2.4 Measurements of the UAB Current Response to Uric Acid
Electrochemical analyzer was used and measurements were carried out at 25 C. An applied potential of +700 mV versus Ag/AgCl pad was applied to the working electrodes of the UAB.
PBS was firstly pipetted onto the UAB. After waiting for 150 s to achieve a steady background current, uric acid solution in different concentrations was then added onto the UAB and the current response of the UAB to uric acid was then measured.
3. Results and Discussion
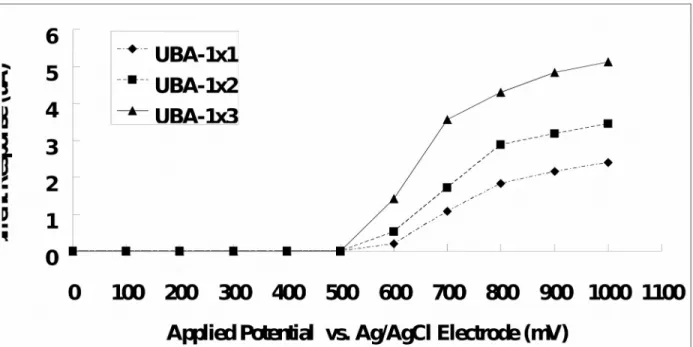
3.1 Hydrodynamic Voltammogram of the UAB
Fig. 2 demonstrated the hydrodynamic voltammogram of the UAB at a regularly-stirred 0.8 mM uric acid solution. Reductive currents generated by the UAB were found to begin at +600 mV potential, gradually increase with the applied potential, and become plateau starting from +800 mV potential afterward. Therefore, +700 mV potential (the mean of +600 mV and +800 mV) versus the Ag/AgCl reference electrode was used for all measurements. On the other hand, an array configuration was found to be able to increase the reductive current and this means that the sensitivity of the UAB can be increased by using array configuration.
3.2 Response Behavior of the UAB
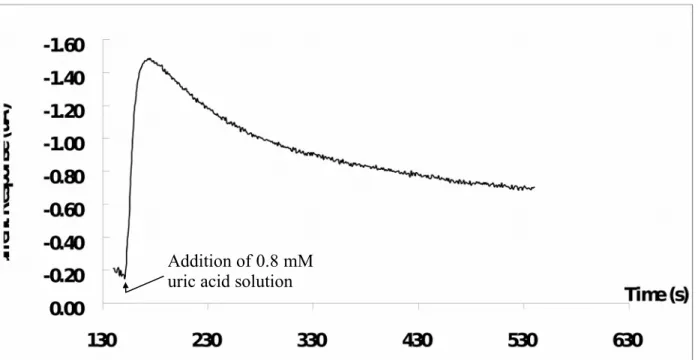
Fig. 3 showed a current-time curve for the addition of 0.8 mM uric acid solution, where the current response of the UAB-1x1 being measured at the applied potential of +700 mV. After adding the uric acid solution onto the UAB-1x1, the reductive current raised and reached 95% of the steady state current at 20 s approximately. UAB-1x1 has a faster response time as compared with that reported by Arora et al. (about 60 s) [33], Luo et al. (about 45 s) [34] and Zhang et al (about 50 s) [35], but it has a slower response as compared with that reported by Chauhan and Pundir (about 7 s) [36].
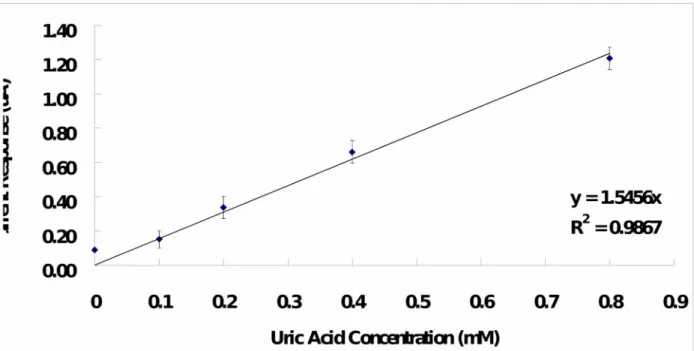
uric acid concentration. It was found that the current response is directly proportional to the uric acid concentration over a wide range of concentration (0 – 0.8 mM) sufficiently covering the normal physiological and pathological blood uric acid levels, where correlation coefficient (r2) is 0.99 and sensitivity is 1.55 A/mM. The range of concentration measurement of the UAB-1x1 is comparable to the findings reported by other researchers [34, 36] and is slightly narrower as compared with that reported by Zhang et al (0.2 – 1 mM) [35]. And, the sensitivity of the UAB-1x1 is lower than Luo’s findings (16.6 A/mM) [34] but is higher than Zhang’s findings (5.5 nA/mM) [35].
Fig. 5 showed the calibration curve of the UAB-1x1, UAB-1x2 and UAB-1x3 to uric acid concentration. Again, the current responses of the three UAB (all have r2 > 0.96) were found to be directly proportional to the uric acid concentration over the concentration range of 0 – 0.8 mM. It was observed that the use of array configuration can result in the increase of the sensitivity of the UAB in general. Specifically, the sensitivity of the UAB-1x3 was found to be significantly higher (independent-samples t test: p < 0.05 in both cases) than that of the UAB-1x1 (3.1-fold) and UAB-1x2 (1.9-fold), while UAB-1x2 also has a significant higher (independent-samples t test: p < 0.05) sensitivity as compare to UAB-1x1 (1.6-fold). A possible explanation for these phenomena is that the improved sensitivity is due to the higher signal-to-noise ratio (SNR) achieved with the larger reductive current signals observed at the UAB in a higher array configuration and this will be explained later in this section.
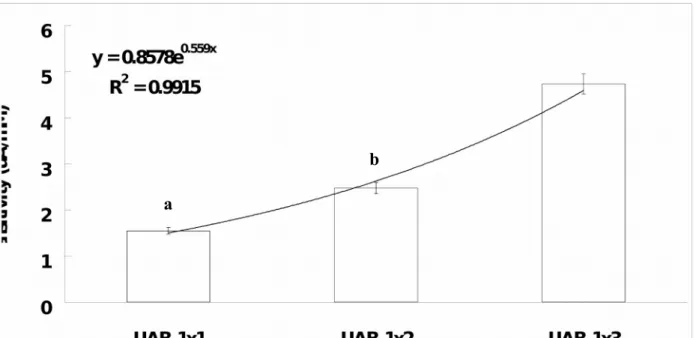
Fig. 6 showed the plot of UAB sensitivity versus the type of UAB array configuration. The sensitivity of the UAB exponentially increases with the UAB in higher array configuration (Exponential Regression Equation: UAB sensitivity = 0.86e0.56 x Array Configuration ; r2 = 0.99). Based on this finding, it can be understood that the UAB sensitivity can be significantly increased
(independent-samples t test: p < 0.05 in all cases; 1x1 < 1x2 (1.9-fold) and UAB-1x3 (3.1-fold); UAB-1x2 < UAB-UAB-1x3 (1.6-fold)) by using UAB in array configuration. However, this method can not unlimitedly increase the UAB sensitivity as it has an exponential increase phenomenon. Therefore, it can be expected that the UAB sensitivity can be increased and reach its maximum steady state at a particular array configuration.
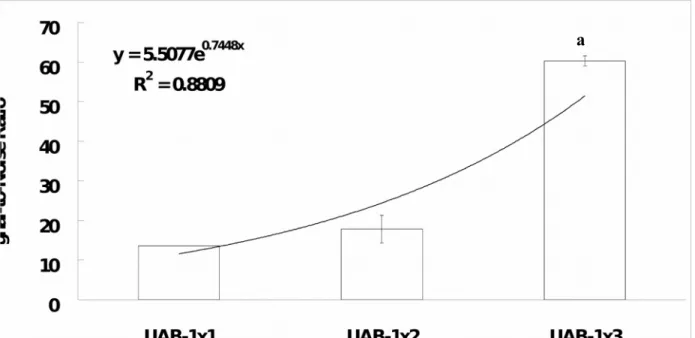
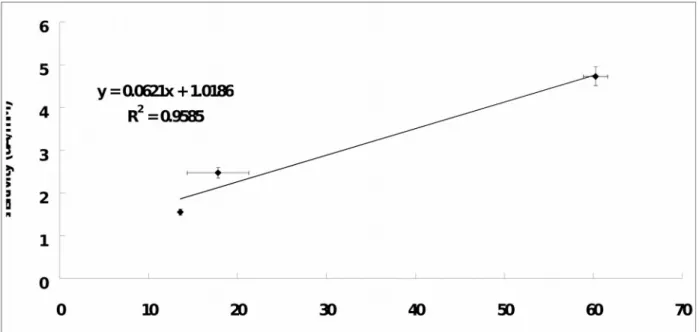
Fig. 7 showed the plot of UAB SNR versus the type of UAB array configuration. The SNR of the UAB exponentially increases with the UAB in higher array configuration (Exponential Regression Equation: UAB SNR = 5.51e0.74 x Array Configuration ; r2 = 0.88). It was found that the higher the array configuration, the greater the UAB SNR in general. To be more specifically, the SNR of the UAB-1x3 was found to be significantly greater than that of the UAB-1x1 (4.4-fold; independent-samples t test: p < 0.001) and UAB-1x2 (3.4-fold; independent-samples t test: p < 0.05). Although the SNR of the UAB-1x2 is greater (1.3-fold) than that of UAB-1x1, no significant difference (independent-samples t test: p = 0.228) is found. On the other hand, as shown in Fig. 8, an excellent linear relationship (r2 = 0.96) was found between the sensitivity and SNR. It was found that the greater the SNR, the larger the sensitivity. Therefore, this can explain the phenomenon found in Fig. 5 that UAB-1x3 has a higher sensitivity as compared to UAB-1x1 as a result of UAB-1x3 having a higher SNR as compared to UAB-1x1.
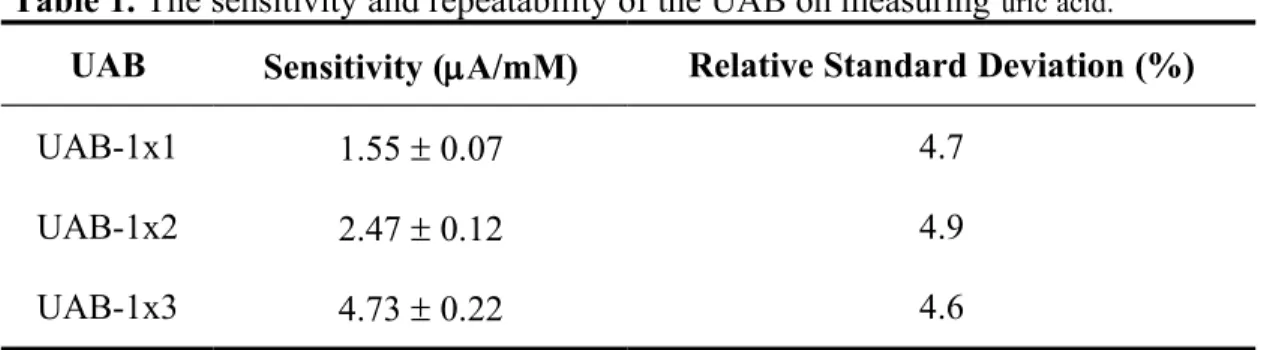
The repeatability of the UAB-1x1, UAB-1x2 and UAB-1x3 on measuring uric acid concentrations was evaluated from the standard deviation of the sensitivity of the UAB. As shown in Table 1, the three different UAB demonstrate a reasonably attractive analytical feature of repeatability (maximal relative standard deviation = 4.9%).
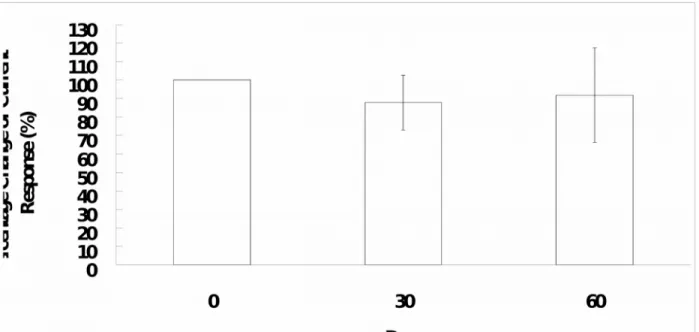
3.3 Life-Span of the UAB
The long-term stability of the UAB, kept at 4 C, was evaluated over a 60-day period. It was found that the current response of the UAB to 0.8 mM uric acid solution was 92% approximately of its initial value. The life-span of our UAB is longer than that reported by Hoshi et al. (2003) [37] and their uric acid sensor can only retain 60% activity after 30 days storage. A possible explanation for the good life-span of the UAB is that the enzyme is immobilized well onto the sensor and maintains its enzymatic activity. In this study, bovine serum albumin and glutaraldehyde was used to crosslink with the enzyme onto the sensor. This crosslink structure probably provides a superior micro-environment for the enzyme to stay alive and keep up its enzymatic activity.
4. Conclusion
Biosensor in an array configuration can increase its SNR, which subsequently results in the increase of its sensitivity. Also, an excellent positive linear relationship is found between the sensitivity and SNR. This method is reliable, simple and inexpensive to fabricate a highly-sensitive biosensor. In this study, UAB array was used as an example and it has a linear working range (0 – 0.8 mM), a moderate response time (~20 s), and good repeatability.
Acknowledgement
This work was supported by grants (NSC 100-2221-E-260-007- and NSC 98-2221-E-260-024-MY3) from National Science Council, Taiwan, Republic of China. This work was also supported by grant from the National Chi Nan University and Puli Christian Hospital, Taiwan, Republic of China.
Conflict of interest
None
References
1. R. Monošík, M. Stred'anský, E. Šturdík, Application of Electrochemical Biosensors in Clinical Diagnosis, J Clin. Lab. Anal. 26 (2012) 22–34.
2. J. Liu, G. Li, Application of biosensors for diagnostic analysis and bioprocess monitoring, Sensor. Actuat. B-Chem. 65 (2000) 26 – 31.
3. Rodrigues R.T.F.S., Pires d.T.T.L.A., Pina d.F.L.J, Biosensors as rapid diagnostic tests for tropical diseases, Crit. Rev. Clin. Lab. Sci. 47 (2010) 139 – 69.
4. M.S. Belluzo, M.E. Ribone, C.M. Lagier, Assembling Amperometric Biosensors for Clinical Diagnostics, Sensors 8 (2008) 1366 – 1399
5. A. Amine, H. Mohammadi, I. Bourais, G. Palleschi , Enzyme inhibition-based biosensors for food safety and environmental monitoring, Biosens Bioelectron. 15 (2006) 1405 – 1423. 6. A.J. Baeumner, Biosensors for environmental pollutants and food contaminants, Anal.
Bioanal. Chem. 377 (2003), 434 – 445.
7. D. Ivnitski, I.A. Hamid, P. Atanasov, E. Wilkins, S. Stricker, Application of Electrochemical Biosensors for Detection of Food Pathogenic Bacteria, Electroanal. 12 (2000) 317 – 325.
8. S.R. Mozaz, M.J.L.d. Alda and D. Barceló. Biosensors as useful tools for environmental
analysis and monitoring. Anal. Bioanal. Chem. 386 (2006) 1025 – 1041.
9. S. Rodriguez-Mozaz, M.P. Marco, M.J.L. Alda and D. Barceló, Biosensors for environmental applications: Future development trends, Pure Appl. Chem. 76 (2004) 723 –
10. L. Zheng, J. Li, J. Xu, L. Xiong, D. Zheng, Q. Liu, W. Liu, Y. Li, S. Yang, J. Xia, Improvement of amperometric glucose biosensor by the immobilization of FcCD inclusive complex and carbon nanotube, Analyst 135 (2010) 1339 – 1344.
11. A.S.N. Murthy, J. Sharma, Benzoquinone-mediated enzyme biosensor for amperometric determination of glucose, J. Chem. Sci. 109 (1997) 295 – 301.
12. J. Liu, S. Sun, C. Liu, S. Wei, An amperometric glucose biosensor based on a screen-printed electrode and Os-complex mediator for flow injection analysis, Measurement 44 (2011) 1878 – 1883.
13. J.C. Vidal, E. Garcia-Ruiz, J.R. Castillo, Strategies for the improvement of an amperometric cholesterol biosensor based on electropolymerization in flow systems: use of charge-transfer mediators and platinization of the electrode, J. Pharm. Biomed. Anal. 24 (2000) 51 – 63.
14. K.J. Chen, K.C. Pillai, J. Rick, C.J. Pan, S.H. Wang, C.C. Liu, B.J. Hwang, Bimetallic PtM (M = Pd, Ir) nanoparticle decorated multi-walled carbon nanotube enzyme-free, mediator-less amperometric sensor for H2O2, Biosens. Bioelectron. 33 (2012) 120 – 127.
15. T. Dodevska, E. Horozova, N. Dimcheva, Biosensor for Xanthine with Improved Sensitivity and Detection limit, University of Plovdiv, Paisii Hilendarski – Bulgaria Scientific Papers 35 Book 5 (2007) – Chemistry.
16. Y.Q. Dai, K.K. Shiu, Highly Sensitive Amperometric Glucose Biosensor Based on Glassy Carbon Electrode with Copper/Palladium Coating, Electroanal. 16 (2004) 1806 – 1813. 17. S. Cosnier, A. Lepellec, B. Guidetti, I. Rico-Lattes, Enhancement of biosensor sensitivity in
aqueous and organic solvents using a combination of poly(pyrrole-ammonium) and poly(pyrrole-lactobionamide) films as host matrices, J. Electroanal. Chem. 449 (1998) 165 – 171.
18. S.S. Razola, B.L. Ruiz, N.M. Diez, H.B Mark Jr, J.M. Kauffmann, Hydrogen peroxide sensitive amperometric biosensor based on horseradish peroxidase entrapped in a polypyrrole electrode, Biosens. Bioelectron. 17 (2002) 921 – 928.
19. J. Wang, N.V. Myung, M. Yun, H.G. Monbouquette, Glucose oxidase entrapped in polypyrrole on high-surface-area Pt electrodes: a model platform for sensitive electroenzymatic biosensors, J. Electroanal. Chem. 575 (2005) 139–146.
20. C.A. Groom, J.H.T. Luong, Improvement of the Selectivity of Amperometric Biosensors by Using a Permselective Electropolymerized Film, Anal. Lett. 26 (1993) 1383 – 1390. 21. S. Cosnier, Biosensors based on electropolymerized films: new trends, Anal. Bioanal.
Chem. 377 (2003) 507 – 520.
22. V. Branzoi, L. Pilan, F. Branzoi, Amperometric Glucose Biosensor Base on Electropolymerized Carbon Nanotube/Polypyrole Composite Film, Rev. Roum. Chim. 54 (2009) 783–789.
23. Y.I. Dai, K.K. Shiu, Highly Sensitive Amperometric Glucose Biosensor Based on Glassy Carbon Electrode with Copper/Palladium Coating, Electroanal. 16 (2004) 1806 – 1813. 24. S. Sharma, A. Shrivastav, N. Gupta, S. Srivastava, Amperometric Biosensor: Increased
Sensitivity Using Enzyme Nanoparticles, 2010 International Conference on Nanotechnology and Biosensors IPCBEE vol.2 (2011) © (2011) IACSIT Press, Singapore. 25. K.S. Loh, Y.H. Lee, A. Musa, A.A. Salmah, I. Zamri, Use of Fe3O4 Nanoparticles for
Enhancement of Biosensor Response to the Herbicide 2,4-Dichlorophenoxyacetic Acid, Sensors 8 (2008) 5775 – 5791.
26. Y. Zhang, R. Yuan, Y. Chai, J. Wang, H. Zhong, Amperometric biosensor for nitrite and hydrogen peroxide based on hemoglobin immobilized on gold
nanoparticles/polythionine/platinum nanoparticles modified glassy carbon electrode, J. Chem. Technol. Biot. 87 (2012) 570 – 574.
27. F. Tasca, L. Gorton, J.B. Wagner, G. Nöll, Increasing amperometric biosensor sensitivity by length fractionated single-walled carbon nanotubes, Biosens. Bioelectron. 24 (2008) 272 – 278.
28. C. Boero, S. Carrara, G.D. Micheli, Sensitivity Enhancement by Carbon Nanotubes: Applications to Stem Cell Cultures Monitoring, Proceedings of the 5th International Conference on Ph.D. Research in Microelectronics & Electronics (PRIME) (2009) 260 – 263.
29. Y.L. Yao, K.K. Shiu, A Mediator-Free Bienzyme Amperometric Biosensor Based on Horseradish Peroxidase and Glucose Oxidase Immobilized on Carbon Nanotube Modified Electrode, Electroanal. 20 (2008) 2090 – 2095.
30. B. Chen, M. Ma, X. Su, An amperometric penicillin biosensor with enhanced sensitivity based on co-immobilization of carbon nanotubes, hematein, and beta-lactamase on glassy carbon electrode, Anal. Chim. Acta. 674 (2010) 89 – 95.
31. A.A. Karyakin, O.V. Gitelmacher, E.E. Karyakina, Prussian Blue-Based First-Generation Biosensor. A Sensitive Amperometric Electrode for Glucose, Anal. Chem. 67 (1995) 2419 – 2423.
32. J.F. Masson, C. Kranz, K.S. Booksh, B. Mizaikoff, Improved sensitivity and stability of amperometric enzyme microbiosensors by covalent attachment to gold electrodes, Biosens. Bioelectron. 23 (2007) 355 – 361.
33. K. Arora, G. Sumana, V. Saxena, R.K. Gupta, S.K. Gupta, J.V. Yakhmi, M.K. Pandey, S. Chand, B.D. Malhotra, Improved performance of polyaniline-uricase biosensor, Anal. Chim. Acta. 594 (2007) 17 – 23.
34. Y.C. Luo, J.S. Do, C.C. Liu, An amperometric uric acid biosensor based on modified Ir–C electrode, Biosens Bioelectron. 22 (2006) 482 – 488.
35. Y.Q. Zhang, W.D. Shen, R.A. Gu, J. Zhu, R.Y. Xue, Amperometric biosensor for uric acid based on uricase-immobilized silk fibroin membrane, Anal. Chim. Acta. 369 (1998) 123 – 128.
36. N. Chauhan, C.S. Pundir, An amperometric uric acid biosensor based on multiwalled carbon nanotube-gold nanoparticle composite, Anal. Biochem. 413 (2011) 97 – 103.
37. T. Hoshi, H. Saiki, J.I. Anzai, Amperometric uric acid sensors based on polyelectrolyte multilayer films, Talanta 61 (2003) 363 – 368.
Biographies
Congo Tak-Shing Ching received the PhD degree in bioengineering from the University of
Strathclyde, Glasgow, UK, in 2005. He is currently working as an associate professor in the Department of Electrical Engineering, National Chi Nan University, Nantou, Taiwan. His main research interests include biosensors, biomedical instrumentation design, noninvasive medical diagnostics/monitoring/therapeutics, point of care diagnostics and bioimpedance.
Yu-Lung Hung is currently working as a medical doctor in the Department of Internal
Medicine, Puli Christian Hospital, Nantou, Taiwan. His main research interest is biosensors.
Chin-Kang Chen is currently working as a medical doctor in the Department of Internal
Medicine, Puli Christian Hospital, Nantou, Taiwan. His main research interest is biosensors.
Tai-Ping Sun was born in Taiwan on 20 March 1950. He received the BS degree in electrical
engineering from Chung Cheng Institute of Technology, Taiwan, in 1974, the MS degree in material science engineering from National Tsing Hua University, Taiwan, in 1977, and PhD
to 1997, he worked at Institute of Science and Technology, Republic of China, concerning the development of infrared device, circuit and system. He joined the Department of Management Information System, Chung-Yu College of Business Administration since 1997 as an associated professor. Since 1999 he has joined the Department of Electrical Engineering, National Chi Nan University as a professor. From 2001 to 2005, he was secretary-general at the National Chi Nan University. Since 2006, he has been chairman of the Department of Electrical Engineering at National Chi Nan University. And his research interests are infrared detector and system, analog/digital mixed-mode integrated circuit design, special semiconductor sensor and their applications.
Kok-Khun Yong is currently working as a medical doctor in the Department of Internal
Medicine, Puli Christian Hospital, Nantou, Taiwan. His main research interest is biosensors.
Yue-Xiu Jiang is currently working as a nurse in the Department of Nursing, Puli Christian
Hospital, Nantou, Taiwan. Her main research interest is biosensors.
Hsiu-Li Shieh is currently pursuing the PhD degree in the Department of Electrical
Engineering, National Chi Nan University, Nantou, Taiwan. Her main research interest is biosensors.
Kang-Ming Chang is currently working as an associate professor in the Department of
Photonics and Communication Engineering, Asia University, Taichung, Taiwan. His main research interests are biosensors and biomedical signal processing.
Table 1. The sensitivity and repeatability of the UAB on measuring uric acid.
UAB Sensitivity (A/mM) Relative Standard Deviation (%)
UAB-1x1 1.55 0.07 4.7
UAB-1x2 2.47 0.12 4.9
Fig. 1. The UAB. (a) UAB-1x1. (b) UAB-1x2. (c) UAB-1x3.
Fig. 2. Hydrodynamic voltammogram of the UAB in constantly-stirred solution of 0.8 mM
Fig. 3. Current-time curve obtained by the addition of 0.8 mM uric acid solution to the
UAB-1x1. The response time of the biosensor is about 20 s. Addition of 0.8 mM
Fig. 4. Calibration curve of the UAB-1x1 to uric acid concentration. The lines are best fit
found by linear regression. Sensitivity of the biosensor is indicated by the slope of the linear regression line and it is 1.55 A/mM.
(y = 1.55x; r2=0.987)a
(y = 2.47x; r2=0.964)b
Fig. 5. Calibration curves of the three different UAB to uric acid concentration (0 – 0.8 mM).
The line is that of best fit found by linear regression (the correlation coefficient, r2, of UAB-1x1, UAB-1x2 and UAB-1x3 is 0.99, 0.96 and 0.98, respectively). The sensitivity of the UAB (1.55, 2.47 and 4.73 A/mM for UAB-1x1, UAB-1x2 and UAB-1x3, respectively) is the slope of the linear regression line. Remarks: aStatistically significant differences
(independent-samples t test: p < 0.05) was found on its sensitivity as compared to UAB-1x2 and UAB-1x3. bStatistically significant differences (independent-samples t test: p < 0.05) was
found on its sensitivity as compared to UAB-1x3.
a
Fig. 6. The UAB sensitivity-type of array curve. The line is that of best fit found by
regression (r2 = 0.99). The sensitivity of the UAB exponentially increases as the type of array changing from single biosensor (i.e. 1x1) to array biosensor (i.e. 1x2 or UAB-1x3). Remarks: aStatistically significant differences (independent-samples t test: p < 0.05)
was found as compared to UAB-1x2 and UAB-1x3. bStatistically significant differences
(independent-samples t test: p < 0.05) was found as compared to UAB-1x3.
Fig. 7. The UAB signal-to-noise (SNR)-type of array curve. Data is obtained by using 0.8
mM uric acid solution. The line is that of best fit found by regression (r2 = 0.88). The SNR of the UAB exponentially increases as the type of array changing from single biosensor (i.e. UAB-1x1) to array biosensor (i.e. UAB-1x2 or UAB-1x3). Remarks: aStatistically significant
differences was found as compared to UAB-1x2 (independent-samples t test: p < 0.05) and UAB-1x1 (independent-samples t test: p < 0.001).
Fig. 8. The sensitivity-SNR curve. Data is obtained by using 0.8 mM uric acid solution. The
Fig. 9. The current response of the UAB was found to be about 90% of its initial value after a
2-month storage at 4C, showing a good long-term stability. Data is obtained from the UAB-1x1 tested at 0.8 mM uric acid solution.