Fault-controlled genesis of the Chilung Sea Valley
(northern Taiwan) revealed by topographic lineaments
Gow-Shyh Song*, Chung-Ping Ma, Ho-Shing Yu
Institute of Oceanography, National Taiwan University, P.O. Box 23-13, Taipei 10764, Taiwan, ROC Received 12 January 1999; accepted 23 June 2000
Abstract
The Chilung Sea Valley lies parallel to the coastline off northern Taiwan. It connects the coastal area to the Chilung Shelf through a descending rugged surface. This valley is about 65 km in length, 7–15 km in width, and ends, once across the shelf break, off the Santiaochiao coast in northeastern Taiwan. The descending gradient of the Chilung Valley floor is approximately 1/500, being very close to that of the Chilung Shelf. This implies that the valley might have originated from a solely tectonic event that acted on the shelf surface. On the basis of a well-controlled bathymetric data set collected in the study area, some topographic lineaments were extracted. Tracing these topographic lineaments that connect to a series of the NE–SW orientated faults extending from on-land Taiwan into the ocean, we identified three right-lateral strike–slip faults truncating these lineaments. The occurrence of these right-lateral strike–slip faults is suggested to result from compressive shearing under the orogeny of the convergence between the Philippine Sea plate and the Eurasian plate. The shearing upon the fault plane has been inhomogeneous along the path of the Chilung Valley, and has affected the shape of the valley.䉷 2000 Elsevier Science B.V. All rights reserved.
Keywords: Bathymetry; Topographic lineament; Taiwan; Sea valley; Tectonic
1. Introduction
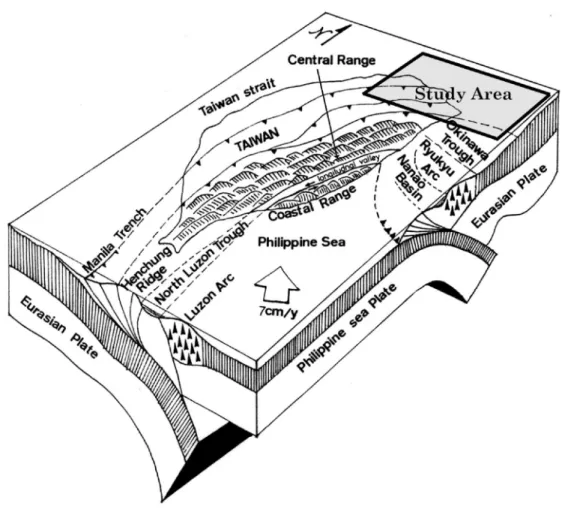
Taiwan lies in the convergence zone between the Philippine Sea plate and the Eurasian plate. In this area, the Philippine Sea plate is moving northwest relative to the Eurasian plate at a rate of 7 cm/yr (Seno, 1977). Consequently, it carries the northern tail of the Luzon Arc (Hsu and Sibuet, 1995), and obliquely collides with the Eurasian plate in forming the Taiwan Orogen. The collision process is then transformed into a subduction process as the sutural trace goes northeast and turns eastwards into the
Paci-fic Ocean off the city of Hualien (at 24⬚N). On the ocean floor, the Philippine Sea plate subducts to the north beneath the Eurasian continental margin form-ing representative submarine topographic features, in sequence from south to north: the Ryukyu Trench, the Ryukyu Arc, and the Okinawa Trough (Fig. 1) (Karig, 1973; Bowin et al., 1978; Tsai, 1978, 1986; Ho, 1982, 1986; Barrier and Angelier, 1986; Huang and Yin, 1990; Huang et al., 1992; Teng et al., 1992). The Okinawa Trough is the morphological expres-sion of a back-arc rifting in the offshore region of northeastern Taiwan (Kimura, 1985; Letouzey and Kimura, 1985; Sibuet et al., 1987). Kimura (1985) named a zone the Greater Okinawa Trough, which has a width about twice that of the Okinawa Trough. The north boundary of this zone is traced by the
0025-3227/00/$ - see front matter䉷 2000 Elsevier Science B.V. All rights reserved. PII: S 0 0 2 5 - 3 2 2 7 ( 0 0 ) 0 0 0 8 4 - 0
www.elsevier.nl/locate/margeo
* Corresponding author. Tel.:23660883; fax: ⫹886-2-23697428.
Tunghai Shelf Fault, following the edge of the East China Sea Shelf southwards to the Mien-Hua Canyon, but the trace of the fault cannot be recognized on the Chilung Shelf across the canyon (Fig. 2) (Song et al., 1997). This observation implies that the rifting phenomenon resulting in the opening of the Okinawa Trough prevails mainly in the area of the East China Sea Shelf.
On land in eastern Taiwan, the Longitudinal Valley Fault (the LVF) (Fig. 1) is along the sutural zone between the Phillipine Sea and Eurasian plates (Ho, 1975). To the east of the LVF, the Coastal Range is a collision front of the Philippine Sea plate. It is only 10 km wide and 130 km long, situated along the east-ern coast of Taiwan. To the west of the LVF, the Central Range is in front of the Eurasian plate, and
the collision has formed a fold and thrust belt under the compressive stress (Suppe, 1981, 1984; Davis et al., 1983; Dahlen et al., 1984). In other words, this compression results in the Taiwan Orogen, in which a series of thrust faults are aligned in the NE–SW direc-tion (Angelier et al., 1986; Yeh et al., 1991; Song, 1992).
The Chilung Sea Valley is located immediately north of the coast of northern Taiwan (Song and Chang, 1993; Song et al., 1997; Liu et al., 1998). Morphologically, the trace of the sea valley can be treated as the northern boundary of the orogenic activ-ity in this region. However, crossing the Chilung Valley northward, the sea floor that forms the Chilung Shelf still has the appearance of the presence of linear fault scarps (Song et al., 1997). Huang et al. (1992) Fig. 1. Schematic diagram showing plate tectonic setting of Taiwan. Vector of relative motion between the Eurasian plate and the Philippine Sea plate is shown as an open arrow. This diagram is modified from Song (1992). The block indicates the study area shown in Fig. 2.
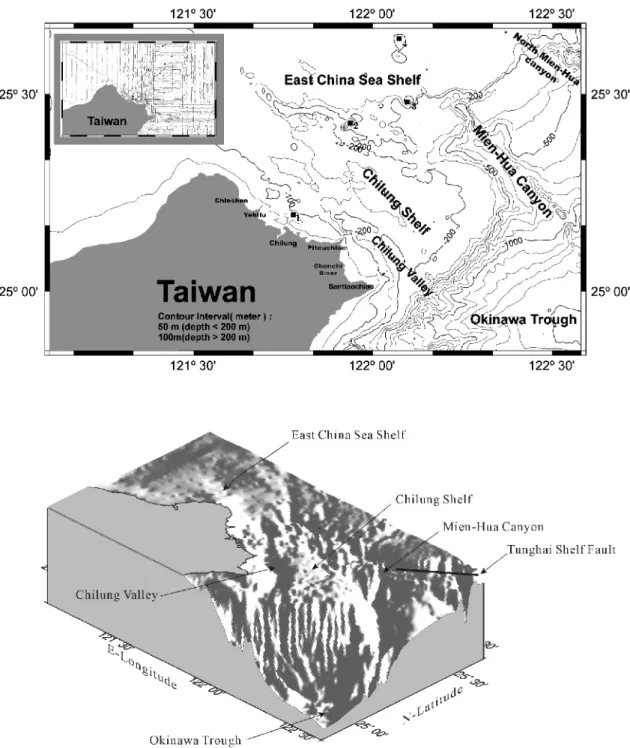
Fig. 2. Bathymetric map of the study area. The data was processed using grid and contour commands in GMT (Wessel and Smith, 1991). Physiographical units are indicated. Solid squares indicate the locations of four islets of the: (1) Chilungtao, (2) Huapingyu, (3) Meinhuayu, and (4) Pengchiayu. The inset shows the tracklines where the bathymetric data sets were collected. A three-dimensional topographic diagram using GMT in the same area is shown in the lower diagram. The topographic relief is presented by the gray-scale shading of the strength of illumination simulated by a light source from the northwest. The bright portion is the surface that faces the illumination. The gridding effects shown in the East China Sea Shelf result from spare spacing between the survey shiptracks in that region.
100 500 0 500 M
PLEISTOCENE OLIGOCENE MIOCENE HOLOCENE KUEICHULIN
FORMATION P TUFFBRECCIA LAVA FLOWS WUCHISHANFORMATIONMUSHAFORMATN
ION TALIAO
FORMATION FORMATIONSHIHTI FORMATIONNANKANG NANCHUANGFORMATION TAPU NUMBER ERHCHIUNUMBER
TERRACE DEPOSITS ALLUVIUM SANDDUNE
tbl tbt tbu bApho’ ap Aph ahp ahy aha ah Wc M s Tu ss T1 St St ss Nk Nc Kct Kec t a s
Yeh-Liu Chinshen Shihmen Fuokwachiu
Taiwan
LINE-8 Km Anticlineaxis Synclineaxis Thrustf aults RecentS ediments IntrusionI
I
Topographic Low Chinshen Faul t A A S S F2 F2 F1 F1 B B Fw? Fw F F L P P'P
P'
A S F2 F1 B Fw F Seaf loor Tw o-wa yT rave lT im e(m s) Km 0 5 50m West EastL I N E-8
revealed the presence of deep-seated fault sets with compressive mechanics in this area, and they suggested those as an extension of the thrusts on land. Besides, an offshore structural map shows that the extent of the fold and thrust belt can be traced on the shelf region of northwestern Taiwan (Fig. 3) (Hsiao et al., 1998; Song, 1999). It is implied that the offshore region of northern Taiwan had been under the activity of orogeny during Late Mio-Plio-cene times around 6–7 Ma (Hsiao et al., 1998).
However, Teng (1996) believed that thrust faulting was activated as normal faulting about 2–3 Ma at the Plio–Pleistocene boundary in northern Taiwan. Hsiao et al. (1998) confirmed Teng’s (1996) hypothesis of the activation of normal faulting, as suggested by Chinese Petroleum Company seismic profiles and drilling data obtained on the shelf. In addition, some intrusions were found to be emplaced along these faults on the Chilung Shelf (Song et al., 1997; Sibuet et al., 1998), and andesite with ultrabasic inclusions, with ages younger than about 2.5 Ma, is also present on the isles of Chilungtao and Pengchiahsu (shown in Fig. 2) (Chen and Wu, 1971; Chen, 1978; Yen et al., 1979; Yen, 1980). These andesites are characterized by the rare earth element (REE) pattern of lower crus-tal contamination (Huang, 1988), suggesting a shal-low-extruded volcanism (Chen et al., 1993). It is suggested that extensional dynamics has been domi-nant in the northern Taiwan region, including the offshore area, since 3 Ma (Lee and Wang, 1988). Sibuet et al. (1998) related it to the major phase of the opening processes in formation of the present-day southern Okinawa Trough.
It is apparent that the stress component normal to the strike of the Taiwan thrusts changed abruptly from compression to extension in northern Taiwan since 3 Ma. Hsu et al. (1996) suggested that the consequent collision from the northern tip of the Luzon Arc with the Ryukyu Arc caused the bending and strike–slip
faulting to the Ryukyu Arc and to the offshore area of northeastern Taiwan. The strike–slip faulting may cause the discontinuity that separates the compressive thrust mechanics in the environment of Taiwan orogeny from the extensional normal mechanics in the domain of Okinawa back-arc opening. Despite the arc–arc collision processes proposed by Hsu and Sibuet (1995) and Hsu et al. (1996), Lu and Malavieil-le’s (1995) experiment also showed the occurrence of strike–slip faults as a consequence of orogenic stress oblique to the Taiwan thrust belt.
Inspecting the multi-fold seismic reflection profiles, Huang et al. (1992) identified one major set of the strike–slip faults striking NW–SE that was mapped in the region occupied by the Chilung Valley. Never-theless, using joint analyses of bathymetric, magnetic, gravity and earthquake data, Hsu et al. (1996) outlined three right-lateral strike–slip faults (Faults A–C) trending roughly NW–SE, out of which Fault C seems to be in the area of the Chilung Valley. However, both interpretations of fault patterns suffered from the restricted survey track lines constraining the mapping of the faults on the shelf, and the limited capacity in judging the presence of strike–slip faults, this depending simply on recogni-tion of the flower-structure pattern shown on the seis-mic profiles.
On the shelf, several thousand bathymetric measurements, positioning from the Differential Global Positioning System (DGPS) and sounding from the Simrad EK500 or the ELAC-4700 Echo-sounders, were determined in northern Taiwan in the early 1990s (the Northern Taiwan Single-Beam data or the NTSB data, hereafter) (Song, 1994). The bathymetric image produced by the NTSB data gave a clear view of the surface of this region (Fig. 2). A linear depression named the Chilung Valley was then identified off the north coast of Taiwan (Song and Chang, 1993).
Fig. 3. Structural map offshore northwest Taiwan (the upper diagram). It was drawn according to 10 profiles of seismic reflection survey, using a 4000 J Sparker Array, collected in May 1999. Processing was done using the Solaris Workstation under the ProMax program. The line-8 profile and its interpretation are shown in the middle diagram, locations of each structural lineament marked by capital letters shown on the upper map are denoted on the profile. Chinshen Fault is shown clearly on the profile; its trace connects with the on-land trace defined by Huang (1984), and it seems to be dislocated in the coastal area, where Fault 3 defined in this study is transversal. In this portion of Chinshen Fault, it forms an imbricated cluster of faults in-between the folds on the west and truncates beddings to the deep, which may imply its thrust origin with a strike–slip component. To the west, the folding structure is dominant, forming a typical pattern of a fold and thrust zone shown on the bottom profile (sited from Huang, 1984) in the presence of the Taiwan Orogen. The location of the on-land profile of P–P is shown in the upper diagram.
Since the surface of the Chilung Shelf is covered with relict sediments (Niino and Emery, 1961; Song et al., 1997), the Chilung Valley has generally been interpreted as the relic of rivers or channels during the subaerial period of sea-level lowering in the late Pleistocene 15,000 yr ago (Boggs et al., 1979; Yu, 1992). With the NTSB data, the images along the Chilung Valley are shown, in this paper, to be varied bathymetrically. Following the trace, the appearance zigzags and is truncated in some portions whilst it is curved and bent in others. The valley develops only on the shallow shelf; nevertheless, its floor has both U-shaped (trough-like) or V-shaped (valley-like) profiles. Together with its surface being both smooth and rugged in alternate regions, the Chilung Valley seems to be a product of tectonic activity.
This study is intended to use the NTSB data, added to an on-land digital elevation data set, for checking the existence of the strike–slip faults delineated by Huang et al. (1992) and/or by Hsu et al. (1996). It has been shown that the thrusts of Taiwan extend northeastward off northern Taiwan, and Deffontaines et al. (1994) denoted that these thrust faults mostly follow the trend of the ridges uplifted by thrusting motions. The argument that the Chilung Valley formed by right-lateral strike–slip faults can be inves-tigated by tracing sets of submarine topographic linea-tions across the width of the valley, and by checking the existence of segmentations within these sets.
With Sea Beam bathymetric data, similar techni-ques in locating fault scarps or structural lineaments have been working particularly on the spreading zones in the deep ocean. These are the areas that show linear ridges to be split by faults within the median valley (Kappel and Ryan, 1991). Alexander and Macdonald (1996) found out that a directional derivative at the azimuth perpendicular to the average ridge trend was a useful aid in locating fault scarps on the East Pacific Rise, even in areas where relief is of lower amplitude. Along the Mid-Atlantic Ridge, Shaw (1992) and Shaw and Lin (1993) used topographic curvature analysis to distinguish the fault scarps lineation, and to recognize the ridge segmentation.
Sea Beam data are distributed evenly on the sea floor, also with good quality in the precision of sound-ings, such that the slope/curvature analysis has been sufficient to the area collecting bathymetry in that
mean. On the shallow shelf, however, there have been few multibeam data collected for academic purposes. This is because of less coverage of beam swathe on shallow water, or is partially because less geomorphologic features are shown on the shelf surface. The NTSB data has the quality satisfying the IHO (International Hydrographic Organization) bathymetry standards (IHO, 1987), and they were designed to be collected along even spacing survey lines in a wide region for producing the Chinese navy chart. For northern Taiwan and its offshore area being the places of orogenic environment, the result of detecting fault lineaments using the NTSB data can be expected.
2. Data and methods
The NTSB data sets were collected during the years of 1990–1994, using single-beam echosounders on small fishing boats in the coastal areas of sounding depths less than about 30 m, and on five cruises of 296, 315, 348, 355, and 363 of the R/V Ocean
Researcher I (R/V OR-I) of the National Taiwan
University in the deeper water region. To the east of 120⬚400E, the spacing between survey tracklines was conducted at about 1.5 km (at 1 km in coastal areas), to produce the navy chart scaled at 1:150,000 (Song, 1994; Song and Chen, 1994). Additional survey lines, however, are spaced at a wider interval at 5 km to the west of 120⬚400E (Fig. 2). This portion sea floor features has a smoother surface than that of the Chilung Shelf, situated in the east (Song et al., 1997) (Fig. 2).
On land, the elevation data of northern Taiwan were obtained by digitizing the contour lines on the Topography Map of Taiwan Region (1987). On the map where spare contours are shown, or in the flat surface region, digitized points were evenly interpolated in the spaces between the contours. The spatial distribution of digitized points is shown in Ma (1995).
This study is to trace topographic lineations from the land to the sea. In order to share the same earth/ project system among the data sets, the earth system of GRS67 (Geodetic Reference System 1967 or Taiwan Datum 1984) used on the Topography Map (1987) was employed. Consequently, the WGS84
(World Geodetic System 1984) in the bathymetry positioned by the Global Position System was trans-ferred to the GRS67 system used in the NTSB data. In addition, each depth sounding was corrected by in situ acoustic velocity profiles obtained in the CTD measurements, and the soundings in the coastal area
were corrected by the tidal measurements (Song and Chen, 1994).
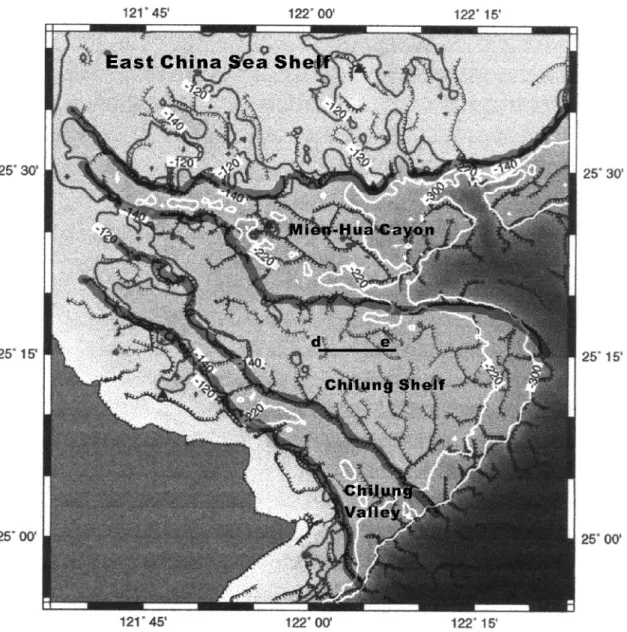
Scarps originating from the faulting are visible as large dips. However, the slope angle cannot uniquely identify faults. Thus the locations of faults have been detected by assuming that they lie along sharp linear Fig. 4. Topographic map illustrating the regions of physiographical units. Each unit is bounded by thick lines on the basis of the distribution and continuity of topography breaks, defined by thin lines with a tick showing the downward side of the break. This is done by the self-developed automatic lineament extraction computer program (Chang, 1997; Chang et al., 1998). The 120, 140, 220 and 300 m isobaths indicate the traces of the inner and outer shelf breaks.
edges unique to the thrust footwall (Shaw, 1992; Oakey, 1994). This has been done by analyzing topo-graphic slopes and is useful for identifying the loca-tions of faults from the bathymetric data (Shaw and Smith, 1990; Alexander and Macdonald, 1996; Lour-enco et al., 1998).
To distinguish the lineaments of thrust faults from the bathymetric data, the following two steps were followed in this study:
(1) The bathymetry/elevation was filtered to show only the topographies having wavelengths of relief between 3 and 5 km. This window of wavelength detects only the faults whose spatial scale matches the defined aperture. However, with this step, in addition to maximizing the desired topographic targets based on the span of fault scales observed in the region (Deffontaines et al., 1994), it was also to be a valid aperture in the analysis with track lines spaced at about 1.5 km in the collected data sets. (2) The topographic lineations were shown by the white/black shading images, representing positive/ negative values of the surface gradient at the 315⬚ azimuth. This is because the geomorphic features are aligned mostly with a NE–SW orientation in the studied area (Deffontaines et al., 1994), and this step has a purpose of obtaining a directional derivative at an azimuth perpendicular to the aver-age ridge trend in locating the lineation of fault scarps.
Seismic reflection profiles were collected along some tracklines in the course of the bathymetric surveys in the cruises of 296, 315, and 355 of the R/V OR-I. Cruise 296 used an EdgeTech Sparker Array operating at 4600 J, and cruises 315 and 355 used 160 and 120 in.3, respectively, and two air-gun arrays. The data set was recorded on a Digital Audio Tape Recorder (DAT), digitized in the SEG-Y format with data having a dynamic range of 96 db. The seismic data processing was done by the SUN Workstation in sequence by a debiased, bandpass filter (10–110 Hz for air-gun data and 80–1000 Hz for Sparker Array data), automatic gain control (AGC) and deconvolution, using the SIOSEIS program developed by the Scripps Institute of Oceanography, University of California.
3. Submarine topography of Chilung Valley and its vicinity
Three major submarine linear depressions known in the studied area are: (i) the Mien-Hua Canyon, a well-developed canyon indenting the shelf region around the islets of Mienhuahsu and of Huapinghsu; (ii) the North Mien-Hua Canyon, a multi-head submarine canyon located at about 30 km north of the Mien-Hua Canyon; and (iii) the Chilung Valley, a sea valley lying parallel to the coast of northern Taiwan (Fig. 2) (Yu, 1992; Song et al., 1997; Liu et al., 1998). These depressions seem to be located in the stretching of the three strike–slip faults delineated by Hsu et al. (1996). Fig. 2 shows that the sea floor of the East China Sea Shelf has an uniform surface with water depths around 110–120 m. The inner shelf was defined by the edge of the East China Sea Shelf, almost following the isobath of 120 m (Fig. 4) (Song et al., 1997). Off northern Taiwan, the shelf break indicates the paleo-coastline of the last Pleistocene glacial period when sea water was 140 m lower than the present sea level (Boggs et al., 1979). The region between the isobaths of 120 and 140 m, therefore, defines the presumed paleo-coastal zone.
The inner shelf edge separates the region of the East China Sea Shelf from the area that is subsiding. The subsiding continental shelf region is called a pseudo-shelf, because it has a greater depth (150–300 m) and a steeper surface than those of typical shelves or of the East China Sea Shelf. North of the Mien-Hua Canyon, it occupies a portion of the area located eastward to the Tunghai Shelf Fault. South of the canyon (Fig.4), it is the region occupied by the Chilung Shelf (Song et al., 1997).
The Chilung Shelf, as a pseudo-shelf, connects the southeastern margin of the East China Sea Shelf off northern Taiwan. It is located immediately north of the Chilung Valley and south of the Mien-Hua Canyon (Figs. 2 and 4). Topographically, the Chilung Shelf has a steep surface descending to the southeast with a gradient of 1/600 which is about twice that of the world average as well as of the East China Sea Shelf. It has a relatively deep shelf edge at around the 300 m isobath, which is about 160–180 m deeper than that of the East China Sea Shelf or of the inner shelf break.
high-angle bank, indicated by the trace of the inner shelf edge of the East China Sea Shelf. In addition, as shown in Fig. 4, the edges of the Mien-Hua Canyon and Chilung Valley can be defined by connecting those linear segments with tick marks, indicating the down-thrown side of scarps, facing the axes of the depressions. In the area between the canyon and the valley, as well as in the territory of the Chilung Valley, the rest of the segments locating traces of fault scarps, aligned mostly in the N–S or NE–SW orienta-tions, are spread over the surface. These fault scarps have been believed to be the product of normal fault-ing (Fig. 5) (Song et al., 1997), with down-thrown sides of the fault always facing the east/southeast or descending azimuths of the Chilung Shelf (Fig. 4). This has been the mechanics resulting in the descent further to the east, and the shelf edge subsided to the depth at 300 m on the Chilung Shelf.
The Chilung Valley lies along the south margin of the Chilung Shelf, stretching southeastwards from 121⬚400E off the Chinshen and Yehliu coast in northern Taiwan for a distance of about 65 km. It ends at the shelf edge about 10 km offshore of the Cape of Santiao (or the Santiao-chiao) (Fig. 6). Fig. 6 shows that the axis of the Chilung Valley follows the SW (or lower) side of
the perimeter of the dark shading band denoted by capital letters A–D.
The view of sea floor profiles, by connecting the bathymetric data points following the tracklines, demonstrates the appearance of the bottom of the Chilung Valley (by “v” marks) and other morpholo-gical features around this valley (Fig. 7). Supporting the shading view shown on Fig. 6, the trace of the valley is diminished, then vanishes at 121⬚400E, at the location marked by “A”. Its termination is at “z” shown on profile 2 in Fig. 7, at the extension of the Chinshen Fault (Fig. 3).
The headland of the Cape of Pitou (Pitouchiao, hereafter) extends about 6 km into the ocean as a submerged ridge (denoted by “g” on profiles 14–16 in Fig. 7). In this area, the Chilung Valley curves around the ridge, with its bottom being sharp and deep up to 270 m. On the 3.5 kHz seismic profile, tilted and folded bedding is seen on its northern flank which is against the ridge (Fig. 8), demonstrat-ing a compressional environment. Fault scarps shown on the same profile, in contrast, demonstrate an exten-sional behavior on the southern flank.
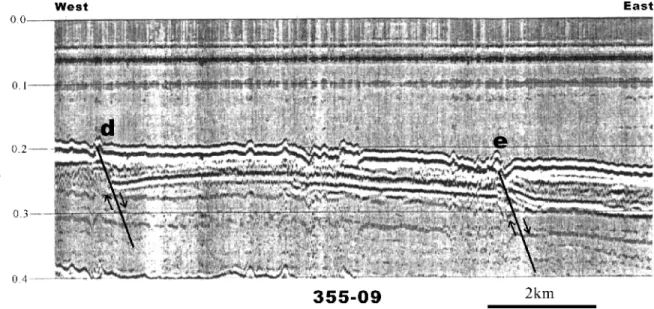
The upstream portion of the Chilung Valley (the UCV, hereafter) is in the region to the west of the Pitouchiao. Profiles 2–13 are situated in the area Fig. 5. Seismic profile across fault lineaments on the Chilung Shelf. This plot uses a single-channel air-gun seismic reflection data set. The location of the profile (denoted by E–W), obtained on Cruise 355 of R/V OR-I, is shown in Figs. 4 and 10. The profile shows a truncation of the beddings under the normal faulting. The letters marked on profile denote the intersecting locations of lineaments d and e, shown in Fig. 10.
Fig. 6. Submarine topography of the Chilung Valley, shaded with illumination from the northeast. The shaded region in the offshore area of northern Taiwan denotes the northern bank of the Chilung Valley, indicating the trace of the valley. Below the map, a profile following the axis of the Chilung Valley is shown. This profile is divided into three sections separated by the points A–D marked in the plot. Each section is produced by interpolating the bathymetric grid-processed data produced by GMT. The bold straight line represents the average descending surface along the valley’s axis. Small letters denote the topographies marked on the profiles shown in Fig. 7.
occupied by the UCV. It is a trough-like feature with varying amounts of relief along its path. It has a rather uniform width of 7 km across (Fig. 6). However, in profile 11, the trace of the valley can hardly be recog-nized, due to the sea floor lift in that area (marked “B” in Fig. 6). Viewing the shading images of the UCV in Fig. 6, its flanks seem to be an echelon trending E–W. It results from the faulting motions truncating in-between, and the fault scarps are seen and can be traced following the path of the valley or on the sides of the UCV (these scarps are marked by “a”, “b”, and “1”–“3” in Fig. 7). In this area, individual undersea mounts are found (“e”, “f” “i” and “j”) (for relative locations of these features refer to Figs. 6 and 7).
To the east of the Pitouchiao, the downstream portion of the Chilung Valley (the DCV, hereafter) has a curved course. The DCV has an asymmetrical V-shaped profile with width ranging from 7 to 15 km eastward, and with depth of relief reaching to 100 m (Figs. 4 and 9). The steeper flank is on its southern
bank with a gradient of 1/25 (2⬚), climbing to the coast of northern Taiwan (Song and Chang, 1993). The sediments from the Shunchi River located between the Pitouchiao and Santiaochiao have the effect of nourishing and smoothing the southern bank of the Chilung Valley (Fig. 6).
On average, the axis of the Chilung Valley has a gradient of about 1/500 (Fig. 6). This gradient is more or less similar to that on the Chilung Shelf, implying that the Chilung Valley was formed before the subsid-ing of the shelf and was molded by similar stresses resulting in the subsiding of the Chilung Shelf.
4. Strike–slip faults along Chilung Valley
The traces of 13 faults that have been recognized on-land were digitized from the Geologic Maps of Taiwan (Huang, 1984; Huang and Liu, 1988). They were then overlaid on the shading diagram showing topographic lineations, in order to test and locate if Fig. 7. Profiles connecting the bathymetric data points following the ship tracks; data points are spaced at about 100 m. Traces of the Chilung Valley situated within each representative profile are marked by the symbol “v”. The numbers 1–3 denote the fault scarps of Faults 1–3, and letter “a”, the fault scarps of the offshore extension of the Chinshen Fault. Other symbols, i, j, etc., represent different bottom features described in the text.
these faults could correspond to the shaded bands, particularly for those trending NE–SW. These faults, such as the Chinshen Fault, Kanchiao Fault and Lung-tung Fault, were under the thrust mechanism resulting in hundreds of meters of stratigraphic elevation (Tang and Yang, 1976; Huang and Liu, 1988). It is shown that these faults following shading bands are reflected in Fig. 10.
The lineaments of those faults were then traced into the shelf region (Fig. 10). They were distinguished from the images with the greatest contrast of light and shade, or by choosing those of the perimeter of shaded bands extending from the land. On the sea floor, the lineaments become fragmental, but the pairs to respective segments have regular amounts of right-lateral displacement among the specific
lineaments, relatively (marked a–g). Therefore, the existence of three sets of right-lateral strike–slip faults (Faults 1–3 marked in Fig. 10) is inferred. The respective fault scarps are found and denoted on the bathymetric profiles (marked 1–3 in Fig. 7).
In areas where strike–slip mechanisms are exerted, the surface imprints of a fault zone are shaped by the flower-structure rooted upon a Main Shearing Plane (MSP, hereafter) (Davis, 1984). This fault zone may consist of numerous closely spaced fault surfaces, with minor folds. In the DCV, the seismic profile shows that shallow sediments were disturbed at the position where Fault 3 intersects (Fig. 9). Fig. 11 shows the representative seismic profiles across Faults 2 and 3, indicates that these faults share an MSP at a depth of about 1000 m and the faulting molds the bottom of the Chilung Valley. The north bank of the Chilung Valley seems to be at the fault scarps of Fault 3, and the south bank seems to be following the trace of Fault 2 (Figs. 4, 7 and 10).
5. Discussion
The Chilung Valley is situated in a set of right-lateral strike–slip faults with a common MSP, and is in-between surface imprints of Faults 2 and 3. The occurrence of the strike–slip faults can be the conse-quence of collision between the northern tip of the Luzon Arc and the Taiwan Orogen (Hsu and Sibuet, 1995; Hsu et al., 1996). The process described in Fig. 12 is analogous to such occurrence in/off northern Taiwan.
Accordingly, during the Late Mio-Pliocene around 6–7 Ma, the compression resulting in the bending of the Taiwan Orogen, in which a series of thrust faults aligned in the NE–SW direction, extended under the ocean off northern Taiwan (Fig. 13A). When the frac-tures appeared and the right-lateral strike–slip occurred, the coastal zone was formed and uplifted (Fig. 13B). Consequently, the Chilung Shelf relaxed from the compression and bending of the orogenic dynamics, and the thrust motions of fault planes across the strike–slip faults were terminated. However, after the area was relaxed from the bending off northern Taiwan, it would rebound. In the begin-ning, the Chilung Shelf was rotated counterclockwise, resulting in widening of the Chilung Valley eastwards Fig. 8. 3.5 kHz seismic profile around the submerged headland of
Pitouchiao. Depth in meters is given based on an acoustic velocity of 1500 m/sec. The submerged headland is denoted by an arrow. Tilted beddings are shown in the northern flank of the Chilung Valley. Layers appear to squeeze out over the ridge and beddings show a gradual slope to the shallows, indicating a compressional environment. EL topographic low under extension, caused by the motions of the strike–slip demonstrated by the models described in Figs. 13 and 15. The profile was obtained on Cruise 355. The loca-tion is shown in Fig. 10.
(Figs. 4 and 13C). This phenomenon is shown by the slower slip rates for Lineament g (Fig. 14). As the rebound compensated some of the slip motions along the slip faults, the process also tended to pull the paleo-fault blocks apart, or gave the extensional dynamics of normal faulting in the Chilung Shelf (Fig. 13C). An increase in subsi-dence of the Chilung Shelf may be related to the extensional environment in northern Taiwan around 2 Ma (Teng, 1996).
Fig. 14 shows histograms of the magnitudes of offsets caused by the motions of the right-lateral strike–slip following the paths of Faults 1–3 to the structural lineaments of a–g (Fig. 10), respectively. Although the slip distances seem variable for each individual fault, the summed slips, representing the slip motion along the MSP joined at the root of Faults 1–3 for each lineament, respectively, are almost the same at about 5.0 ^ 0.5 km in distance (Fig. 14), except in the area near the Pitouchiao. If the slipping began in the early Pleistocene when the orogeny was most prevalent (Ho, 1986; Teng, 1990), or if the tran-sition from mountain buildup to extensional orogenic
occurred at around the Plio-Pleistocene boundary of 2 Ma (Teng, 1996), the estimated slip rate is averaged at 2.5 mm/yr.
Exceptional slip rates are found near the Pitouchiao area. To the north, Faults 2 and 3 have comparatively small slip rates, whereas to the south, Fault 1 slipped comparatively faster (Fig. 14). This phenomenon can be explained if the Pitouchiao acted as an indenter to its neighborhood. The processes can be demonstrated by asperity modeling, shown in Fig. 15. As an asperity tracks in the slip surface, the locking to the motion can be imposed easily. Under this condition, the stress of shear along the right-lateral strike–slip plane will result in the asperity acting as an indenter, causing compression to the material in its front across the fault plane. This compression then lifts the material up (as the bottom high shown around location B in Fig. 6 or “CH” shown in Fig. 15), even squeezing them around (like the squeezed sediment layers in the northern flank of the submerged Pitouchiao head-land shown in Fig. 8), whereas behind the indenter the deformation lags (giving irregular slip distances along Fault Planes 1–3 shown in Fig. 14).
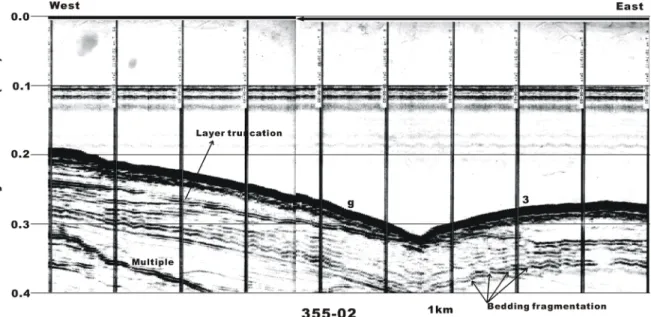
Fig. 9. Air-gun analog seismic profile showing fragmented bedding deep in the sediment layers under the eastern (right) flank of the DCV, through which Fault 3 passes. In the western flank (left), onlap sediment layers truncate the horizontal sediment layers at a depth of about 25 m. The letters marked on the profile denote the intersecting locations of Lineament g and Fault 3 specified in Fig. 10, respectively. The profile was obtained on Cruise 355. The location is shown in Fig. 10.
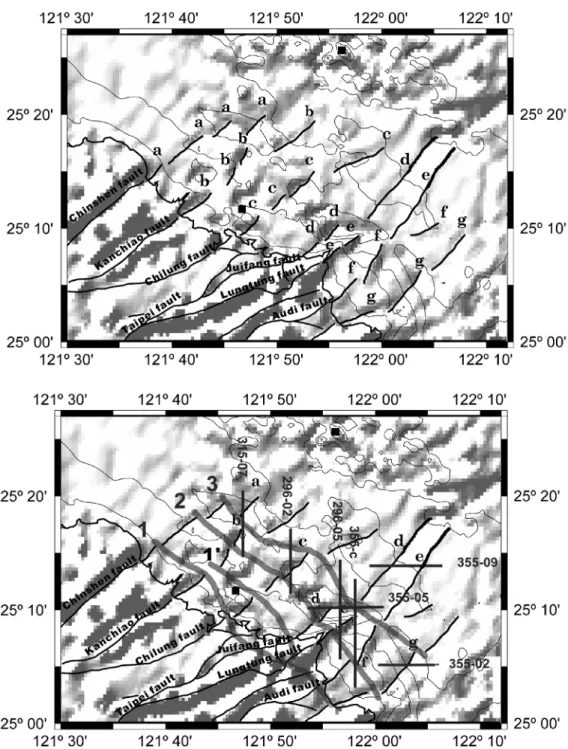
Fig. 10. Traces of faults mapping onto the diagram of topographic lineations. Methods and meanings of topographic shadings are described in the text. Thin lines denote the on-land faults from the digitizing data, emplaced according to Sheets 4 and 5 of the Geological Map of Taiwan (Huang, 1984; Huang and Liu, 1988). Representative names of faults on-land are each annotated. The upper diagram shows the trend of the fault-lines extended from the land, lettered “a”–“g”, respectively. They show the trend of segmentation and were drawn following the trend of boundaries of the illuminated shadings. The lower diagram shows the traces of three right-lateral strike–slip faults with thick lines, numbered 1–3, respectively. They are defined by the segmentation occurring among the fault lineaments of “a”–“g” from the upper diagram. The locations of seven representative seismic profiles in this study are also indicated.
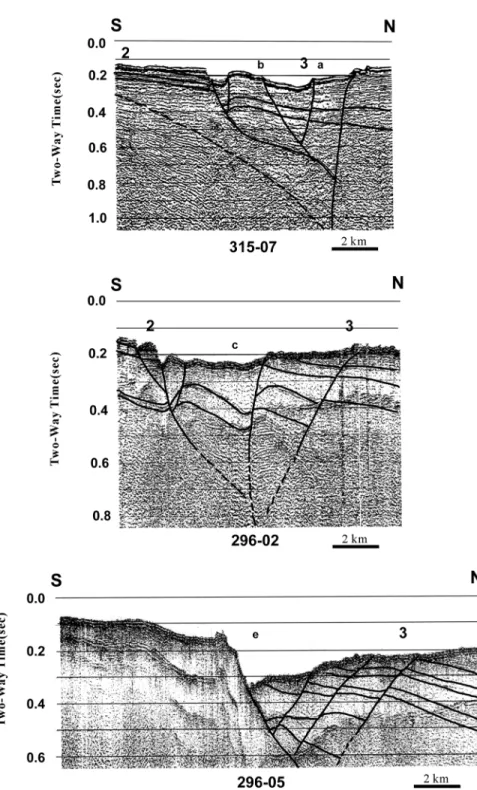
Fig. 11. Seismic profiles showing the flower-structure beneath the sea floor in the area of Chilung Valley. Locations of the representative profiles, and those numbers or/and letters marked on each profile denote intersecting locations of Faults 1–3 or/and Lineaments a–g specified in Fig. 10, respectively. They are both single-fold seismic reflection data sets, in which the 315-07 profile used 160 in.3of two air-gun arrays
Furthermore, the stress has been exerted with less resistance in regions further away from the island of Taiwan. For instance, Fault 2 is situated near the coastline. Its average motion is 1/3 of the slip rate of Fault 3. It is implied that the influence of the resistance exerted by compression is the act of orogeny of Taiwan Island.
6. Conclusions
The Chilung Valley was mainly formed tectoni-cally. Following the traces of structural lineaments off the coast of northern Taiwan, we delineated three right-lateral strike–slip faults that share a common MSP. The occurrence of these strike–slip faults was a product of compressive shearing under
the obliquely colliding mechanisms of the Taiwan Orogeny.
Acknowledgements
We would like to thank the Captain and crew of the R/V Ocean Researcher I, together with T.C. Chen, C.D. Zu and C.T. Chu, for their efforts in collecting the bathymetry data used in this paper. In addition, Y.C. Chang, P.K. Liu, C.Y. Chen, H.J. Chen and H.M. Lee are acknowledged for their help in typing and generating some of the figures. Support for this research was provided by the National Science Council of the Republic of China under grants
NSC-80-0209-M-002A-27,
NSC-81-0209-M-002A-508-K03, NSC-82-208-D-002A-02,
NSC-83-0209-M-002A-022K and NSC-83-208-D-002A-001.
Fig. 12. Demonstrations of bending and fracturing steps (in sequence from A to C), modeling the genesis of the Chilung Valley. (A) Stress is produced by pushing a pole, denoting the rigid Luzon Arc that has been situated in front of the Philippine plate, laterally against a plate, denoting the Taiwan Orogen. (B) This causes the bending of the plate and the indenter moves upwards during the oblique convergence. (C) Further bending accumulates the stress when the sliding motion of the pole (from positions 1 and 2) is resisted against the bend, and fracturing occurs following the axis of the bend. Relative motions of the breaking are indicated by the arrows. The plate is to be fixed at its ends by assuming that this analogous plate may curve following the shape of the boundary of the continental margin of the Eurasian plate in the Taiwan region.
Fig. 14. Histograms showing the magnitudes of offsets separated by Faults 1–3 to Lineaments a–g. Locations of faults and lineations are shown in Fig. 10. Slip distances (in kilometers) shown on the y-axis were estimated by the dislocated lengths shown in Fig. 10 with the scale l0 1852 m.
References
Alexander, R.T., Macdonald, K.C., 1996. Sea Beam, SeaMARC and ALVIN-based studies of faulting on the East Pacific Rise 9⬚200N–9⬚500N. Mar. Geophys. Res. 18, 557–587.
Angelier, J.E., Barrier, E., Chu, H.T., 1986. Plate collision and paleostress trajectories in a fold–thrust belt: the foothills of Taiwan. Tectonophysics 125, 161–178.
Barrier, E., Angelier, J., 1986. Active collision in eastern Taiwan: the Coastal Range. Tectonophysics 125, 39–72.
Boggs, S., Wang, W.C., Lewis, F.S., Chen, J.C., 1979. Sediment properties and water characteristics of the Taiwan shelf and slope. Acta Oceanogr. Taiwanica 10, 10–49.
Bowin, C., Lu, R.S., Lee, C.S., Schouten, H., 1978. Plate conver-gence and accretion in Taiwan–Luzon region. AAPG 62 (9), 1645–1672.
Chang, Y.C., 1997. Automatic extraction of linear features on 2-D
geophysical data. PhD dissertation, Inst. Oceanogr. National Taiwan Univ., 99pp. (in Chinese).
Chang, Y.C., Song, G.S., Hsu, S.K., 1998. Automatic extraction of topographic lineaments using Prominence Weighting Method. Comput. Geosci. 24 (1), 83–93.
Chen, C.H., 1978. Significance of ultrabasic inclusions in the Tatun volcano group, northern Taiwan. Proc. Geol. Soc. China 21, 90– 91.
Chen, C.H., Wu, Y.J., 1971. Volcanic geology of the Tatun geother-mal area, northern Taiwan. Proc. Geol. Soc. China 14, 5–20. Chen, C.H., Lee, T., Shieh, Y.N., 1993. Magmatism at the onset of
back arc basin spreading in the Okinawa Trough. Bull. Inst. Earth Sci. Acad. Sinica 13, 83–85.
Dahlen, F.A., Suppe, J., Davis, D., 1984. Mechanics of fold-and-thrust belts and accretionary wedges: cohesive Coulomb theory. J. Geophys. Res. 89, 10,087–10,101.
Davis, D., Suppe, J., Dahlen, F.A., 1983. Mechanics of Fig. 15. The asperity model demonstrated by the experiment conducts a right-lateral push along the sides of thick papers, with a simulated indenter between them at the mid-portions of the contacted boundaries. The indenter acts as an asperity in the slip motion. Before the slip, straight lines representing topographic lineations described in the text were drawn across contacted boundaries, representing a strike–slip fault line. The act of simulating right-lateral strike–slip motion produces offsets to each of the straight lines across the fault line. Offset distances between the pairs and their relative magnitudes are indicated. Maximum offset occurs just in the area below and in front of the indenter by the rotation of the upper push paper under compression, and in the area behind the indenter, the offset is smaller under the resistance to the motion of the indenter. Areas under compression or extension are also denoted by “CH” surrounded by meeting arrows and denoted by “EL” in the gap between papers, respectively. “EL” could be present topographically as the depression shown in Fig. 8.
fold-and-thrust belts and accretionary wedges. J. Geophys. Res. 88, 1153–1172.
Davis, G.H., 1984. Structural Geology of Rocks and Regions, Wiley, New York (492pp.).
Deffontaines, B., Lee, J.C., Angelier, J., Carvalho, J., Rudant, J.P., 1994. New geomorphic data on the active Taiwan orogen: a multisource approach. J. Geophys. Res. 99 (B10), 20,243– 20,266.
Ho, C.S., 1975. An introduction to the geology of Taiwan: expla-natory text of the geologic map of Taiwan, Ministry of Economic Affairs, Taipei (153pp.).
Ho, C.S., 1982. Tectonic evolution of Taiwan: explanatory text of the tectonic map of Taiwan, Ministry of Economic Affairs, ROC.
Ho, C.S., 1986. A synthesis of the geologic evolution of Taiwan. Tectonophysics 125, 1–16.
Hsiao, L.Y., Lin, K.A., Huang, S.T., Teng, L.S., 1998. Structural characteristics of the southern Taiwan–Sihzi folded zone. Petrol. Geol. Taiwan 32, 133–153 (in Chinese with English abstract).
Hsu, S.K., Sibuet, J.C., 1995. Is Taiwan the result of arc–continent or arc–arc collision. Earth Planet. Sci. Lett. 136, 315–324. Hsu, S.K., Sibuet, J.C., Monti, S., Shyu, C.T., Liu, C.S., 1996.
Transition between the Okinawa Trough Backarc Extension and the Taiwan Collision: new insights on the Southernmost Ryukyu Subduction Zone. Mar. Geophys. Res. 18, 163–187. Huang, C.S., 1984. Geologic map of Taiwan, scale 1:50,000, sheet
4, Central Geological Survey, Taiwan.
Huang, C.S., Liu, H.C., 1988. Geologic Map of Taiwan, scale 1:50,000, sheet 5, Central Geological Survey, Taiwan. Huang, C.Y., Yin, Y.C., 1990. Bathymetric ridges and troughs in
active arc–continent collision region off southeastern Taiwan. Proc. Geol. Soc. China 32, 351–371.
Huang, S.T., Ting, H.H., Chen, R.C., Chi, W.R., Hu, C.C., Shen, H.C., 1992. Basinal framework and tectonic evolution of off shore northern Taiwan. Petrol. Geol. Taiwan 27, 47–72. Huang, W.S., 1988. Geochronology and chemical variations of late
Cenozoic volcanic rocks in Taiwan. PhD dissertation, Institute of Oceanography, National Taiwan University, Taipei, 231pp. IHO Standards for Hydrographic Surveys, 1987. Special publication
no.44, 3rd ed., International Hydrographic Organization. Kappel, E.S., Ryan, W.B.F., 1991. Sea Beam bathymetry along the
Mid-Atlantic Ridge provides evidence of abyssal hill formation. EOS Trans. AGU 72, 467 (Fall meeting suppl.).
Karig, D.E., 1973. Plate convergence between the Philippine and the Ryukyu Islands. Mar. Geol. 14, 153–168.
Kimura, M., 1985. Back-arc rifting in the Okinawa Trough. Mar. Petrol. Geol. 2, 222–240.
Lee, C.T., Wang, Y., 1988. Quaternary stress changes in the north-ern Taiwan and their tectonic implication. Proc. Geol. Soc. China 31 (1), 154–168.
Letouzey, J., Kimura, M., 1985. Okinawa Trough genesis: structure and evolution of a backarc basin developed in a continent. Mar. Petrol. Geol. 2, 111–130.
Liu, C.S., Liu, S.H., Lallemand, S.E., Lundberg, N., Reed, D.L., 1998. Digital elevation model offshore Taiwan and its tectonic implications. TAO 9 (4), 705–738.
Lourenco, N., Miranda, J.M., Luis, J.F., Ribeiro, A., Mendes Victor, L.A., Madeira, J., Needham, H.D., 1998. Morpho-tectonic analysis of the Azores Volcanic Plateau from a new bathymetric compilation of the area. Mar. Geophys. Res. 20, 141–156. Lu, C.Y., Malavieille, J., 1995. Oblique convergence, indentation
and rotation tectonic in Taiwan mountain belt: insights from experimental modelling. Earth Planet. Sci. Lett. 121, 477–494. Ma, C.P., 1995. The genetic study of the Chilung Sea Valley revealed by topographic lineaments, Masters thesis, National Taiwan University, 70pp (in Chinese).
Niino, H., Emery, K.O., 1961. Sediments of shallow portions of the East China Sea and South China. Geol. Soc. Am. Bull. 72, 731– 762.
Oakey, G., 1994. A structural fabric defined by topographic linea-ments: correlation with tertiary deformation of Ellesmere and Axel Heiberg Islands, Canadian Arctic. J. Geophys. Res. 99 (B10), 20,311–20,321.
Seno, T., 1977. The instantaneous rotation vector of the Philippine Sea plate relative to the Eurasian plate. Tectonophysics 42, 209–226.
Shaw, P.R., 1992. Ridge segmentation, faulting and crustal thick-ness in the Atlantic Ocean. Nature 358, 490–493.
Shaw, P.R., Lin, J., 1993. Causes and consequences of variations in faulting style at the Mid-Atlantic Ridge. J. Geophys. Res. 98, 21,839–21,851.
Shaw, P.R., Smith, D.K., 1990. Robust description of statistically heterogeneous seafloor topography through its slope distribu-tion. J. Geophys. Res. 95, 8705–8722.
Sibuet, J.C., Letouzeyl, J., Barbier, F., Charvet, J., Foucher, J.P., Hilde, T.W.C., Kimura, M., Chiao, L.Y., Marsset, B., Muller, C., Sthan, J.F., 1987. Back arc extension in the Okinawa Trough. J. Geophys. Res. 92 (B13), 14,041–14,063.
ACT party, Sibuet, J.C., Deffontaines, B., Hsu, S.K., Thareau, N., Le Formal, J.P., Liu, C.S., 1998. Okinawa trough backarc basin: Early tectonic and magmatic evolution. J. Geophys. Res. 103 (B12), 30,245–30,267.
Song, G.S., 1992. Numerical simulations of collision process in eastern Taiwan. TAO 4 (1), 141–154.
Song, G.S., 1994. Offshore Bathymetry of Northeast Taiwan (scale in 1:150,000). Charted and printed by Chinese Naval Hydro-graphic and OceanoHydro-graphic Office, ROC, September. Song, G.S., 1999. Primitive report of hydrographic observations and
seismic reflection analysis in offshore regions of the nuclear energy plant 1 and 2, Taiwan Power Company (in Chinese). Song, G.S., Chang, Y.C., 1993. Comment on naming of the
submar-ine canyons off northeastern Taiwan: a note by Ho-Shing Yu (1992). Acta Oceanogr. Taiwanica 30, 77–84.
Song, G.S., Chen, M.P., 1994. Final report of bathymetric survey off Northern Taiwan, National Science Council, Taiwan, NSC83-0208-D-002A-001 (in Chinese with English abstract). Song, G.S., Chang, Y.C., Ma, C.P., 1997. Characteristics of
submar-ine topography off northern Taiwan. TAO 8 (4), 461–480. Suppe, J., 1981. Mechanics of mountain building and
metamorph-ism in Taiwan. Mem. Geol. Soc. China 4, 67–90.
Suppe, J., 1984. Kinematics of arc–continent collision, flipping of subduction, and back-arc spreading near Taiwan. Mem. Geol. Soc. China 6, 1–18.
Tang, C.H., Yang, C.Y., 1976. Mid-tertiary stratigraphy break in the northern Hsuehshan Range of Taiwan. Petrol. Geol. Taiwan 13, 139–147.
Teng, L.S., 1990. Geotectonic evolution of late Cenozonic arc– continent collision in Taiwan. Tectonophysics 183, 57–76. Teng, L.S., 1996. Extensional collapse of the northern Taiwan
mountain belt. Geology 24, 949–952.
Teng, L.S., Chen, C.H., Wang, W.S., Liu, T.K., Juang, W.S., Chen, J.C., 1992. Plate kinematic model for the late Cenozoic arc magmatism in northern Taiwan. Proc. Geol. Soc. China 35 (1), 1–18.
Topography Map in Taiwan Region, 1:100,000, chart no. 2, 1st ed., Agriculture Council, Taiwan, 1987.
Tsai, Y.B., 1978. Plate subduction and the Plio-Pleistocene orogeny in Taiwan. Petrol. Geol. Taiwan 5, 1–10.
Tsai, Y.B., 1986. Seismotectonics of Taiwan. Tectonophysics 125, 17–37.
Wessel, P., Smith, W.H.F., 1991. Free software helps map and display data. EOS Trans. AGU 72, 441–446.
Yeh, Y.T., Barrier, E., Lin, C.-H., Angelier, J., 1991. Stress tensor analysis in the Taiwan area from focal mechanisms of earth-quakes. Tectonophysics 200, 267–280.
Yen, T.P., 1980. A geologic consideration on the on-land and offshore of northern Taiwan. Proc. Geol. Soc. China 23, 37–45. Yen, T.P., Tzou, Y.H., Wu, S.W., 1979. Geology of the Chilung volcano group district, northern Taiwan. Proc. Geol. Soc. China 22, 94–104.
Yu, H.S., 1992. Naming of the submarine canyons off northeastern Taiwan: a note. Acta Oceanogr. Taiwanica 29, 107–112.