A Delphi–matrix approach to SEA and its application
within the tourism sector in Taiwan
Nae-Wen Kuo
a,*, Teng-Yuan Hsiao
b, Yue-Hwa Yu
ca
Graduate Institute of Tourism and Health Science, National Taipei College of Nursing, Taiwan, ROC
bDepartment of Tourism Industry, Jin-Wen Institute of Technology, Taiwan, ROC cGraduate Institute of Environmental Engineering, National Taiwan University, Taiwan, ROC
Received 1 February 2004; received in revised form 1 September 2004; accepted 1 September 2004 Available online 23 November 2004
Abstract
Strategic Environmental Assessment (SEA) is a procedural tool and within the framework of SEA, several different types of analytical methods can be used in the assessment. However, the impact matrix used currently in Taiwan has some disadvantages. Hence, a Delphi–matrix approach to SEA is proposed here to improve the performance of Taiwan’s SEA. This new approach is based on the impact matrix combination with indicators of sustainability, and then the Delphi method is employed to collect experts’ opinions.
In addition, the assessment of National Floriculture Park Plan and Taiwan Flora 2008 Program is taken as an example to examine this new method. Although international exhibition is one of the important tourism (economic) activities, SEA is seldom about tourism sector. Finally, the Delphi– matrix approach to SEA for tourism development plan is established containing eight assessment topics and 26 corresponding categories. In summary, three major types of impacts: resources’ usages, pollution emissions, and local cultures change are found. Resources’ usages, such as water, electricity, and natural gas demand, are calculated on a per capita basis. Various forms of pollution resulting from this plan, such as air, water, soil, waste, and noise, are also identified.
D 2004 Elsevier Inc. All rights reserved.
Keywords: Strategic Environmental Assessment (SEA); Delphi method; Tourism activities; International exhibition
0195-9255/$ - see front matterD 2004 Elsevier Inc. All rights reserved. doi:10.1016/j.eiar.2004.09.007
* Corresponding author. P.O. Box 22-96, Taipei 106, Taipei, Taiwan. Tel.: +886 2 23634227; fax: +886 2 23929964.
E-mail addresses: ibis@ntcn.edu.tw, nivenkuo@ntu.edu.tw (N.-W. Kuo). 25 (2005) 259 – 280
1. Introduction
A project’s Environmental Impact Assessment (EIA), as currently practiced, has been unable to respond to increasing complexity and provide for global, sustainable, and sound decision making. Such illusion with the capacity of a project’s EIA to assist, as a single tool, sound environmental decision making in a tiering system was the strongest argument that determined the need for Strategic Environmental Assessment (SEA) in its early days
(Lee and Walsh, 1992; Wood and Djeddour, 1992). Increasingly, decision makers believe
that SEA has the capacity to influence the environmental and sustainability nature of such strategic decisions and to provide for sound, integrated, and sustainable policy and planning frameworks.
However, the application of SEA is still limited in Taiwan and the current assessment method has some disadvantages. Moreover, no literature concerning about SEA within tourism sector in Taiwan has been reported to date. Since tourism development has become main policy of the government of Taiwan recently, to increase employment capacity and economic growth, after many traditional industries moving into China. The Doubling Tourist Arrivals Policy is proposed by the Executive Yuan (the highest administrative organ of Taiwan), and its goal is to double the numbers of tourists visiting Taiwan in 2008. For this reason, the National Floriculture Park Plan (NFP Plan) and the Taiwan Flora 2008 Program (TF2008 Program) have been drawn up in order to make Taiwan become an international attractive destination for foreign tourists by holding an international exhibition. Hence, a new approach to SEA is developed here, and then this new method is used to evaluate the impacts of tourism development plan (program), which are National Floriculture Park Plan and Taiwan Flora 2008 Program in this study. 1.1. Strategic Environmental Assessment (SEA)
The main purpose of SEA is to facilitate early and systematic consideration of potential environmental impacts in strategic decision making (Therivel and Partida´rio, 1996). It is intended to be used on policies, plans, and programs. Although Environmental Impact Assessment (EIA) has been implemented in many countries for many years, some limitations are found with respect to their practices because of various political, socio-economic, and cultural conditions (Partida´rio, 1999). Moreover, a project’s EIA is generally carried out at later stages, and in a lower level, its effects to the whole project are also constrained. Thus, in recent years, the framework of SEA implemented and advocated in the international society is aimed to be supplementary to a project’s EIA so that the deficiency in EIA can be alleviated. SEA was originated in the United States [Section 102(2)(c), National Environmental Policy Act of 1969] and was later relatively successfully put into practice in European countries. The growing significance of SEA as a form of support to decision making is manifested by the recent EC directive (2001/42/EC) on the assessment of environmental effects from certain plans and programs (Feldmann et al., 2001).
Various authors have attempted to summarize the international status of SEA at different occasions (Therivel, 1993; Wood, 1995; Partida´rio, 1996; Therivel, 1998;
Finnveden et al., 2003). This is a highly dynamic process and therefore subjected to
assessment in 1990, and the implementation of the 1999 Directive and Guide for SEA was overviewed by the Canadian Environmental Assessment Agency. However, each federal department and agency and regional institutions develop specific procedures (IAIA, 2002). In the UK, SEA is developed especially at the regional and local land-use planning levels and also at the sectoral policy and planning related to transports and energy. There are no legal requirements so far; practice is led by the existing guidance
(DETR, 1999). Together with the United States, the Netherlands performs an evident
case for the use of a project’s EIA procedure to the assessment of plans and programs, named Strategic Environmental Impact Assessment (SEIA). In contrast, a different system for the level of policy assessment, called Environmental Test (E-Test), has been established (Verheem, 1998).
1.2. Development and current status of SEA in Taiwan
The Environmental Impact Assessment Act of Taiwan was enacted in 1994, and later, in 1997, the Administrative Regulations of Environmental Impact Assessment of Governmental Policies was promulgated, which provided the legal base for SEA of governmental policies, plans, and programs. It was indicated in the document that for nine policy categories that contain 11 items, SEA was required. However, only three SEA case studies have been implemented to date.
The three cases are National Scheme for the Location of Industrial Parks, Construction and Management Guidelines for Golf Courses, and National Water Resources Development Plan. The strategic level, context, scope, and assessment items differ for each of these three studies. The first two cases are concerned about land-use policy, and the last one is about water resource policy. With respect to Taiwan’s three SEA cases, the following limitations are observed (Liou and Yu, 2004):
(1) few or lack of alternatives proposed and considered;
(2) failure to inform and involve the public during the decision-making process; (3) despite legislation, failure to actually incorporate sustainability in policy making;
and
(4) minimal and ineffective communication between involved government agencies. It was also argued that some problems in SEA, and the framework and methodologies need to be improved (Yu and Huang, 2002), such as add scoping procedures, introduce appropriate methodologies and increase public participation. One of the main problems of SEA implementation in Taiwan is that there existed no evaluation criteria (indicators) and no well-defined quantifiable measures. Consequently, the assessment work cannot be finished in short time due to no assessment criteria, and opinions from different assessors cannot concentrate and focus on.
Another problem of the matrix system (see Appendix A) used in Taiwan is its ability of measuring sustainability. SEA can play a significant role in enhancing the integration of environmental concerns in policy and planning processes towards achieving sustainable development. However, the current matrix system for SEA in Taiwan cannot increase its contribution towards sustainability and is still similar to most project’s EIA cases. In addition, some SEA case studies were undertaken by private consultant companies; it
failed to communicate between involved government agencies and to involve the public participation (Liou and Yu, 2004).
1.3. National Floriculture Park Plan and Taiwan Flora 2008 Program
Since tourism development has become the main policy of the government of Taiwan recently, the Doubling Tourist Arrivals Policy is proposed by the Executive Yuan, and its goal is to double the numbers of tourists visiting Taiwan in 2008. Additionally, international conferences, meetings, and exhibitions are regarded as the best way to achieve the goal (Executive Yuan, 2001). Consequently, the National Floriculture Park (NFP) Plan and the Taiwan Flora 2008 (TF2008) Program have been drawn up in order to attract more foreign tourists (3.5 million). The location of the NFP Plan is Changhwa County, and the Hsichou Village (one rural administrative division under Changhwa County) is suggested as the site for international garden and horticultural exhibition, named dTaiwan Flora 2008T.
The best way to evaluate the possible impacts is to assess directly at policy level. Unfortunately, because the development plans and programs concerned with the Doubling Tourist Arrivals Policy are so diverse, and many plans are still unclear and uncertain, the SEA to this tourism policy cannot be implemented at current status. Hence, the NFP Plan and TF2008 Program are selected to assess firstly in this study, because they are more well defined than other plans and programs. In addition, the NFP Plan and TF2008 Program are the core plans of the Doubling Tourist Arrivals Policy; the assessment results can show the potential significant adverse environmental impacts early in the decision-making process. 1.4. Impacts from tourism activities
Tourism has, in fact, long been regarded as having environmental impacts (Mathieson
and Wall, 1982; Mieczkowski, 1995; Holden, 2000). Generally speaking, tourism results
in a full range of environmental impacts and should be regarded as any other industry, especially in natural or semi-natural environment. For example, external stress on an ecosystem, such as caused by tourists, can be classed into four categories: (1) the introduction of non-native species, (2) toxicants and pollutants, (3) habitat destruction, and (4) direct impacts on individual wildlife (Woodley, 1993).
International exhibitions, expositions, and festivals are becoming more and more important in modern tourism (Allen et al., 2002). These special events not only bring positive beneficial to the host communities but also result in a range of negative impacts to physical, social, and even economic environment (Ap, 1992; Fayos-Sola’, 1998; Waitt, 2003). For example, environmental damage, pollution, destruction of heritage, noise disturbance, and traffic congestion are the main negative impacts that are often referred from events (Getz, 1997).Cox (1998) has concluded that rigorous requirements for ongoing impact assessment and clear expectations concerning event management would assist in enabling these events to have minimal impact on host citizens. In addition, an instrument was developed to measure the festival and special event organizers’ perceptions of the impacts of festivals and special events on local communities (Gursoy et al., 2004). Results indicated that the socio-economic impacts of festivals and special events have four dimensions: community cohesiveness, economic benefits, social incentives, and social costs.
For the same reason, the location of exhibitions (like TF2008 Program in this study) will become a popular destination and attracts millions of tourists in a short time, but negative impacts might occur at the same time. Hence, before the NFP Plan and TF2008 Program are put into practice, the possible negative impacts should be identified and the best approach may be the SEA.
1.5. The application of SEA within the tourism sector
Some researchers have applied the concepts of SEAwithin tourism sector, e.g., the SEA of Victoria Falls development program (IUCN-ROSA, 1996). Concerns about the cumulative effects of expanding tourism in the area around the Victoria Falls (a designated UNESCO World Heritage Site) prompted the governments of Zambia and Zimbabwe, with help from the World Conservation Union (IUCN) and the Canadian International Development Agency (CIDA), to conduct an SEA, using a scenario approach, as part of efforts to prepare a master plan for the area. The objective was to provide information for the development of a master plan for the Victoria Falls area and to prepare an outline management plan with policies, management measures, zoning, monitoring, and institutional arrangements.
Other area-based SEA studies about tourism development include Okavango Delta Management Plan (NCSA, 2002), and the SEA of road development in national parks in Tanzania (Mwalyosi, 2003). In contrast, two applications are concerned about tourism policy, one is in Brazil and another is in Fuji. In 2003, under the support of the Inter-American Development Bank (IADB), the Ministry of Sports and Tourism (MST) of Brazil proposes some tourism development plans (the PRODETUR program). The MST conducts both the regional demand study and the SEA study, which together will guide expansion into new areas for tourist development (IADB, 2003).
In addition, the World Wide Fund for Nature (WWF) and the Asian Development Bank (ADB) formed a partnership agreement to carry out a SEA of Fiji’s tourism development plan (WWF, 2003). This case study was chosen because tourism is the fastest growing industry in Fiji with potentially significant impacts on its natural and social environment. The basic objectives of the study were: (1) to inform the mid-term review of the tourism development plan in 2003: to assess the environmental and sustainable development impacts of the current Plan in order to help the Ministry of Tourism and its partners make future plans as sustainable as possible; and (2) to test the usefulness of SEA as a tool for improving the sustainability of strategies and plans in the Asia–Pacific region, with a view to using it more widely. Besides six sustainable options that were finally recommended, this project also raised important points about emphasis and application, which should be reflected in future use of SEA in the South Pacific.
2. Methods
2.1. The Delphi–matrix approach to SEA
The range of methods that can be used in SEA embraces a wide variety, from meetings of a restricted range of parties to the use of specialist analysis techniques such as computer
modeling and Geographic Information Systems (Sadler and Verheem, 1996). However, a matrix system is suggested to be used for impact identification and analysis in Taiwan under the Administrative Regulations of Environmental Impact Assessment of Govern-mental Policies (enacted in 1997). Hence, all SEA case studies are carried out with such matrix system, but this method really has some shortcomings (see Section 1.2) and should be improved.
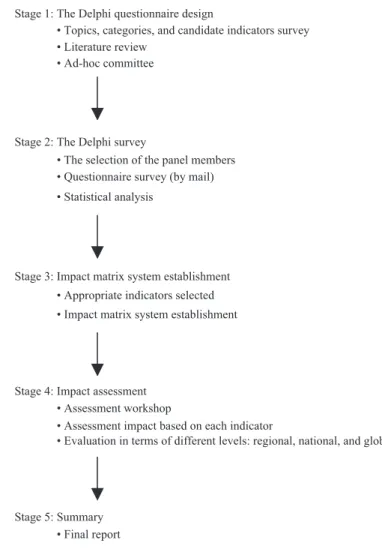
Hence, an innovation method, named the Delphi–matrix approach to SEA, is proposed here in order to enhance the performance of Taiwan’s SEA. This new approach is based on the impact matrix combination with indicators of sustainability, and then the Delphi method is employed to collect experts’ opinions (Fig. 1). The Delphi method was developed in the 1960s as one of the many techniques used in
decision analysis, probability estimates, and long-range forecasts (Linstone and Turoff, 1975). In brief, this technique uses a questionnaire that is circulated among a panel of experts who are not aware of the identity of fellow members of the panel, because the Delphi method aims to encourage independent and unbiased assessments from each individual. The method has been widely used for environmental assessment and for monitoring programs (Kreisel, 1984). Usually, one or more of the following properties of the application leads to the need for employing Delphi (Linstone and Turoff, 1975):
(1) The individuals who are needed to contribute to the examination of a broad or complex problem have no history of adequate communication and may represent diverse backgrounds with respect to experience or expertise.
(2) More individuals are needed than can effectively interact in a face-to-face exchange. (3) Time and cost make frequent group meetings infeasible.
(4) Disagreements among individuals are so severe or politically unpalatable that the communication process must be refereed and/or anonymity-assured.
(5) DThe heterogeneity of the participants must be preserved to assure validity of the results, i.e., avoidance of domination by quantity or by strength of personality (bbandwagon effectQ).
Hence, the advantages of the Delphi–matrix compare to simple expert consultation may be: (1) it lets experts have enough time to analyze data and decide; (2) it can reduce politically disturbance; and (3) it minimizes a person’s psychological effects.
2.2. Indicators of sustainability
Indicators of sustainability are increasingly viewed as quite instrumental in the process of giving a certain dimension to sustainability. They have been used in the Strategic Sustainability Appraisal (SSA) and play an important role (Partida´rio and
Moura, 2000). Strategic Sustainability Appraisal can be understood as an
integrative approach, hosted in an SEA framework, which bears on sustainability priorities and criteria defined at the policy level and translates these into measurable indicators.
The Office of the Deputy Prime Minister of England (ODPM, 2003) confirms the advantage of using indicators in SEA and Strategic Sustainability Appraisal and suggests some possible SEA or Strategic Sustainability Appraisal indicators. These indicators can provide ways of quantifying the baseline, prediction, and monitoring, but they should be adapted to take account of local circumstances and concerns.
2.3. Main steps of the Delphi–matrix approach in this study
The Delphi method is used to collect experts’ opinions through a structured questionnaire in this research. The structured questionnaire is designed based on the sustainability indicators that are often mentioned in previous studies such as bSustainable
Taiwan ProgramQ (Yeh, 2001) and bSustainable Taipei ProgramQ (Huang et al., 1997). The bSustainable Taiwan ProgramQ supported by the National Science Council of Taiwan has established the first sustainable indicator system that is officially accepted by the government. In addition, the indictors of bSustainable Taipei ProgramQ are also accepted by the government of Taipei City. Thus, proper indicators suggested in these two systems are taken into consideration first, and then other suitable indicators for measuring sustainability are added in an ad hoc committee.
Appropriate indicators are selected with the Delphi method, and then the impact matrix system with these selected indicators will be established to identify the impacts of the NFP Plan and TF2008 Program. Opinion stability was selected as the method of consensus measurement in the Delphi approach in this study because the interest lies in the opinion of the group rather than in that of individuals; this method is preferable to one that would measure the amount of change in each individual’s vote between rounds (Scheibe et al., 1975). The use of this stability measure to develop a stopping criterion preserves any well-defined disagreements which may exist. Using the 15% change level to represent a dstate of equilibriumT, any two distributions that show marginal changes of less than 15% may be said to have reached stability, while any successive distributions with more than 15% change should be included in later rounds of the Delphi, since they have not come to the equilibrium position. After the impact matrix system with appropriate indicators established, a workshop composed of various discipline experts will be held to assess the impacts from the NFP Plan and TF2008 Program.
3. Results
First, 98 candidate indicators were listed in the questionnaire and the Delphi survey was carried out from March to December in 2002. Then, the opinions from the experts composed of 33 various discipline professors, experts, leaders of non-governmental organizations, and officials (both of central and local governments) were collected. An interval scale is used here with a maximum score of 5, meaning the indicator is very important, and a minimum score of 1, meaning the indicator is not at all important. After three rounds, the approach has reached stability (less than 15%). The average score of each indicator was calculated and only those indicators with a score no less than 4.0 can be chosen as appropriate indicators for the modified SEA matrix system.
Finally, 69 of the 98 candidate indicators were selected, and the impact matrix system for SEA was established, which contains eight topics and 26 corresponding categories (Table 1). After the assessment matrix system with appropriate indicators established, a workshop composed of 12 various discipline professors, experts, leaders of non-government organizations, and officials was held to analyze the impacts of the NFP Plan and TF2008 Program. These impacts were assessed for their significance in the regional, national, and global levels using the b+Q and b Q scale. For bminor significant positiveQ impacts, a b+Q mark was used, while for bsignificant positiveQ impacts, b++Q was used. On the contrary, b Q and b Q are used to mark bminor significant negativeQ and bsignificant
negativeQ impacts, respectively. In addition, boQ is used to indicate binsignificantQ impacts in terms of an assessment item.
4. Discussion
4.1. The advantages of the Delphi–matrix approach to SEA
According to the experience of this study, the Delphi–matrix approach to SEA is feasible and this new approach has the following advantages:
(1) This approach can evaluate the sustainability of policies, plans, and programs because sustainable indicators are used.
(2) This approach can converge different opinions successfully because the Delphi method is employed.
(3) The Delphi method lets experts have enough time to decide which indicators are appropriate in the questionnaire.
Table 1
The Delphi–matrix approach to SEA established in this study
Topic Category
(1) Physical carrying capacity of the environment 1-1: Air 1-2: Water 1-3: Soil 1-4: Waste
1-5: Noise and vibration
(2) Natural ecosystems 2-1: Terrestrial ecosystems
2-2: Aquatic ecosystems 2-3: Habitat quality
(3) Public health and safety 3-1: Risk of toxic chemicals
3-2: Chemical or radioactive accidents
(4) Use of natural resources 4-1: Forest resources
4-2: Mineral and rock resources 4-3: Water resources
4-4: Biotic resources
(5) Economic analysis of water resources 5-1: Cost effectiveness analysis 5-2: Allocation of water resources (6) Cultural heritage and harmony of natural landscape 6-1: Geographical landscape
6-2: Ecological landscape 6-3: Cultural heritage (7) International environmental rules 7-1: Montreal Protocol
7-2: United Nations Framework
Convention for Climate Change (UNFCCC) 7-3: Basel Convention
7-4: CITES
7-5: Convention on Biodiversity
(8) Others 8-1: Fundamental infrastructure
(4) The assessors can evaluate the impacts more directly on the basis of the indicator system.
(5) The discussion of assessment can be focused on the main topics, categories, and indicators after the impact matrix system is established.
(6) The assessment indicators are flexible and are subjected to each policy, plan, and program, respectively.
(7) This approach also increases communication between other government agencies and public participation (such as non-government organizations).
(8) The final results of SEA are clearer as regards impacts within which topics and categories as well as which degrees of the impact (regional, national, and global); consequently, it can help the decision makers to adapt improvement strategies. 4.2. The impacts of the NFP Plan and TF2008 Program
The assessment indicators in the impact matrix system for SEA established in this study are explained as follows. The possible impacts from the NFP Plan and TF2008 Program are also evaluated in terms of these indicators and shown inTables 2–9.
4.2.1. Physical carrying capacity of the environment
The first topic of the SEA matrix system is the bphysical carrying capacity of the environmentQ that consists of five categories, namely, air, water, soil, waste, and noise and vibration (Table 2). The emissions of PM10, NO2, CO, and O3per year, as well as the ratio
of annual days that Pollutions Standards Index (PSI)N100, are regarded as important assessment indicators in the air category. Significant negative impacts in the regional level and minor significant negative impacts in the national level are concluded. Such negative impacts may result from heavy transportation of construction materials, horticultural materials, flower products, and tourists. Emission of lead (Pb) is not considered here because most vehicles in Taiwan have used lead-free gasoline since 1990s. According to the monitoring data, air pollutants concentrations of PM10, NO2, CO, and O3in Changhwa
County are 69.18 Ag/m3, 0.004, 0.55, and 0.019 ppm in 2002 (EPA, 2002), and they might be taken as benchmarks without such development plan.
Biochemical oxygen demand (BOD), suspended solid (SS), nitrogen, and phosphorus discharge per year are selected here, and negative impacts are considered significant in the regional level. It is because either flower planting or tourism activities will effluent wastewater. Ratios of meeting water quality standards in rivers and groundwater, together with ratio of meeting drinking water standards are regarded as convenient indicators for assessing the impacts because the government reports these data annually. According to the experts’ opinions, the ratios of meeting water quality standards in rivers, groundwater, and drinking water standards will decrease after the NFP Plan and TF2008 Program implementation.
Pesticides and chemical fertilizers are always needed in modern agriculture production. In 1950, the average amount of fertilizer used is 20 kg/ha worldwide. In 2000, this had increased to an average of 90 kg/ha (Cunningham and Cunningham, 2002). The average amount of fertilizer used in Taiwan is 1,391 kg/ha and that of pesticide is 43.57 kg/ha; in comparison, both are higher than that of other countries (EPA, 2002). The flower planting
is not an exception and often needs more pesticides and chemical fertilizers because the flower planting is always under artificial condition. Hence, amounts of pesticides and chemical fertilizers used per unit area are selected, and significant negative impacts in the regional level are concluded. In addition, concentrations of heavy metals in soil, such as chromium (Cr), copper (Cu), and mercury (Hg), might also increase if flowers are cultivated with chemical materials.
Solid waste generation from flower production and tourists must to be considered when this plan and the relative program implemented. In particular, the waste from tourists was
Table 2
Physical carrying capacity of the environment
Category Assessment indicators Regional level National level Global level Air Emission of PM10per year
Emission of NO2per year
Emission of CO per year Emission of O3per year
Ratio of annual days with PSIN100 Water BOD discharge per year
SS discharge per year Nitrogen discharge per year Phosphorus discharge per year Ratio of meeting water quality standards in rivers
Ratio of meeting water quality standards in groundwater Ratio of meeting drinking water standards
Soil Amount of pesticides used per unit area
Amount of chemical fertilizers used per unit area
Concentrations of heavy metals in soil
Waste Amount of solid waste generation from flower production per year Amount of solid waste generation from tourists
Proper treatment rate of solid waste Growth rate of agricultural waste Noise and
vibration
Population within the 65 dB (A)-isophon (Leq) at night Population within the 85 dB (A)-isophon (Leq) Percentage of unsatisfactory monitoring ambient noise
Symbol o + ++
Impact significant negative minor
significant negative insignificant minor significant positive significant positive
Table 3
Natural ecosystems
Category Assessment indicators Regional level National level Global level Terrestrial ecosystems Diversity index of the
terrestrial fauna
+ Diversity index of the terrestrial flora Extent of change of the dominated terrestrial fauna Extent of change of the dominated terrestrial flora Aquatic ecosystems Diversity index of the
aquatic fauna Diversity index of the aquatic flora Diversity index of the benthonic biota Extent of change of the dominated fauna Extent of change of the dominated flora Extent of change of the dominated benthonic biota Habitat quality Extent of habitat
fragmentation
Symbol o + ++
Impact significant negative minor
significant negative insignificant minor significant positive significant positive Table 4
Public health and safety
Category Assessment indicators Regional level National level Global level Risk of
toxic chemicals
Import of toxic chemicals per year
Consumption of toxic chemicals per year
Emission of toxic waste per year Morbidity of pollution-induced diseases Chemical or radioactive accidents Frequency of chemical accidents occurrence Symbol o + ++
Impact significant negative minor
significant negative insignificant minor significant positive significant positive
calculated on a per capita basis (1.1 kg/capita) and shown in Appendix B. According to the results, amount of waste will increase and exceed the capacity of solid waste treatment. Hence, proper treatment rate of solid waste must be taken into consideration. Otherwise, the excess waste might transport to other counties, and its impact is not only regional but
Table 6
Economic analysis of water resources
Category Assessment indicators Regional level National level Global level Cost effectiveness analysis Efficiency of horticultural water use + Efficiency of tourism water use + Allocation of water resources
Conflict between flower production with other agricultures
Conflict between tourism development with local community
Symbol o
Impact significant negative minor
significant negative insignificant minor significant positive significant positive Table 5
Use of natural resources
Category Assessment indicators Regional level National level Global level Forest resources Rate of deforestation o
Percent of protected forest o Mineral and
rock resources
Amount of cement consumption per year
o Amount of rock (sand)
consumption per year
o Water resources Total water consumption
of flower production per day Total water consumption of tourists per day Average number of days when reservoir storages are at low level Ratio of groundwater consumption
Biotic resources Threatened species as a percent of total native species Distribution of exotic species
Symbol o + ++
Impact significant negative minor
significant negative insignificant minor significant positive significant positive
in the national level. Furthermore, growth rate of agricultural waste will increase not only in Changhwa County but also in other areas where agricultural activities are related to flower production industry such as seeding and packaging.
Noise and vibration pollution from the construction of horticultural or tourism facilities can also be a problem for residents and tourists.Briguglio and Briguglio (1996)observe that intense noise is generated by the building of hotels and other construction activity, together with car traffic, and nightclubs in destinations. For the same reason, population within the 65 dB (A)-isophon (Leq) at night, population within the 85 dB (A)-isophon
Table 7
Cultural heritage and harmony of natural landscape
Category Assessment indicators Regional level National level Global level Geographical
landscape
Whether serious impacts to environmental sensitive areas will occur
Harmony of the rural landscape Ecological
landscape
Extent of change in vegetation Cultural heritage Whether irreversible
damages to important cultural heritages will occur
Symbol o + ++
Impact Significant negative minor
significant negative insignificant minor significant positive significant positive Table 8
International environmental rules
Category Assessment indicators Regional level National level Global level Montreal Protocol Consumption of CFCs
UN Framework Convention for Climate Change (UNFCCC) Emission of CO2 per year Emission of greenhouse gases
Basel Convention Import of hazardous waste o CITES Export of endangered
wildlife and products Import of endangered wildlife and products Convention on
Biodiversity
Biodiversity index Protected areas as a percent of total areas
o
Symbol o + ++
Impact significant negative minor
significant negative insignificant minor significant positive significant positive
(Leq), and percentage of unsatisfactory monitoring ambient noise daily are employed to evaluate the noise and vibration pollution from the NFP Plan and TF2008 Program. 4.2.2. Natural ecosystems
The second topic of the SEA matrix system is bnatural ecosystemsQ which consists of three categories, namely, terrestrial ecosystems, aquatic ecosystems, and habitat quality (Table 3). In terms of terrestrial ecosystems, diversity indices of both terrestrial fauna and flora, together with the extent of change of the dominated terrestrial fauna and flora, are considered. Minor significant positive impact is drawn in terms of ddiversity index of the terrestrial faunaT because flower planting may attract many kinds of insects.
Diversity indices of the aquatic fauna, flora, and the benthonic biota are suggested in aquatic ecosystems. Indicators that show an extent of change of the dominated fauna, flora, and benthonic biota are also taken into consideration because the water bodies will also be disturbed by development and tourism. Extent of habitat fragmentation is an important indicator of habitat quality because new road development may result in the reduction of habitat into smaller and more scattered patches.
4.2.3. Public health and safety
The third topic of the SEA matrix system is bpublic health and safetyQ which consists of two categories, namely, risk of toxic chemicals and chemical or radioactive accidents (Table 4). Minor significant negative impacts are concluded not only in regional level but also in national level according to these assessment indicators, because the employees of toxic chemicals production or usage are not restricted in regional level. Moreover, the negative impact might expand to the global level, when the demand of toxic chemicals in flower production increases and then the import of toxic chemicals will become more often.
4.2.4. Use of natural resources
The forth topic of the SEA matrix system is the buse of natural resourcesQ which consists of four categories, namely, forest resources, mineral and rock resources, water
Table 9 Others
Category Assessment indicators Regional level National level Global level Fundamental infrastructure International airport construction Road construction Hospital resources Local cultures Lifestyle
Commercialization and commoditization
Symbol o + ++
Impact significant negative minor significant negative insignificant minor significant positive significant positive
resources, and biotic resources (Table 5). Two indicators, named drate of deforestationT and dpercent of protected forest,T in category of forest resources are selected; however, the impacts are regarded as insignificant. This may due to the location of National Floriculture Park which is far away from forest areas. Compared with other ongoing public engineering such as super railway, the amount of cement and rock (sand) consumption is relatively small for buildings and construction in National Floriculture Park; consequently, the impacts are also regarded as insignificant.
By contrast, consumption of water resources is considered as an important impact category, because Taiwan has recently become a water-poor country. Total water consumption of flower production and tourists are selected here, together with the average number of days, when reservoir storages are at low level, and the ratio of groundwater consumption. Average number of days when reservoir storages are at low level is a warming line, meaning that water of reservoir storages will be depleted in a short time. Moreover, total water consumption of tourists is calculated here on a per capita basis (0.3 m3/capita), and the result is shown in Appendix B.
Threatened species as a percent of total native species and distribution of exotic species are suggested in category of biotic resources. With the use of pesticides and other toxic materials, together with habitat fragmentation, some native species might be affected. The distribution of exotic species is another serious problem because many horticultural plants come from foreign countries and may affect the population of native species. Exotics can be thought of as biological pollution and are one of the greatest threats to biodiversity worldwide (Cunningham and Cunningham, 2002).
4.2.5. Economic analysis of water resources
The fifth topic of the SEA matrix system is the beconomic analysis of water resourcesQ which consists of two categories, namely, cost effectiveness analysis and allocation of water resources (Table 6). Compared with traditional agriculture, per unit water used for flower production and tourism development will produce more income (Changhwa County, 2002). Accordingly, the efficiencies of both horticultural water use and tourism water use are viewed as minor significant positive impacts. In addition, both two indicators of allocation of water resources category seem to have significant negative impacts because of the conflict between flower production with other agricultures and even further conflict between tourism development with local community will arise.
4.2.6. Cultural heritage and harmony of natural landscape
The sixth topic of the SEA matrix system is bcultural heritage and harmony of natural landscapeQ which consists of three categories, namely, geographical landscape, ecological landscape, and cultural heritage (Table 7). dWhether serious impacts to environmental sensitive areas will occurT and dharmony of the rural landscapeT are selected in category of geographical landscape; they seem to have minor significant and significant negative impacts. The dextent of change in vegetationT is the only one indicator of ecological landscape category and is regarded as significant negative impact. In addition, dwhether irreversible damages to important cultural heritages will occurT is also considered in the assessment category of cultural heritage in the NFP Plan because 18 temples, which are the belief centers of local communities, are located here.
4.2.7. International environmental rules
In order to recognize the impacts relative to important environmental issues, the seventh topic of the SEA matrix system is set up as binternational environmental rules.Q It consisted of five categories, namely, QMontreal Protocol,Q bUnited Nations Framework Convention on Climate Change (UNFCCC),Q bBasel Convention,Q bConvention on International Trade in Endangered Species (CITES),Q and bConvention on BiodiversityQ (Table 8), and they are all the important international environmental issues.
The Montreal Protocol is to regulate activities with ozone depletion, and the consumption of CFCs is selected for assessment here. United Nations Framework Convention for Climate Change (UNFCCC) is formulated to regulate activities with global warming; consequently, emissions of carbon dioxide (CO2) and greenhouse gases are selected and seem to have
significant negative impacts both in regional and national levels. Emission of carbon dioxide (CO2) resulting from human activity can be calculated with Life Cycle Assessment (LCA)
method that is a central tenet of industrial ecology (Graedel and Allenby, 2003). Emission of CO2 from Taiwan Flora 2008 Program is estimated according to the experience and
assessment data of Japan Flora 2000 (Hyogo Prefectural Policy Studies Association, 2001), and the results are shown in Appendix C. According to the results, building is the main contribution of carbon dioxide emission during construction stage. In contrast, electricity use becomes the main contribution of carbon dioxide emission during maintenance stage. The Basel Convention is formulated to regulate hazardous waste transportation between nations. dImport of hazardous wasteT is selected to assess such problem, and an insignificant impact is concluded due to neither direct nor indirect relationships between import of hazardous waste with this plan and program. The 1975 Convention on International Trade in Endangered Species (CITES) is formulated to protect endangered flora and fauna. It regulates trade in living specimens and products derived from listed species. dExportT and dimportT of endangered wildlife and products are two indicators selected, and minor significant negative impacts are concluded. In addition, there are also two indicators selected in category of bConvention on BiodiversityQ. One is dbiodiversity indexT and it is viewed as minor significant negative impact owing to the site development and habitat fragmentation. Another is dprotected areas as a percent of total areasT and it is regarded as insignificant impact.
4.2.8. Others
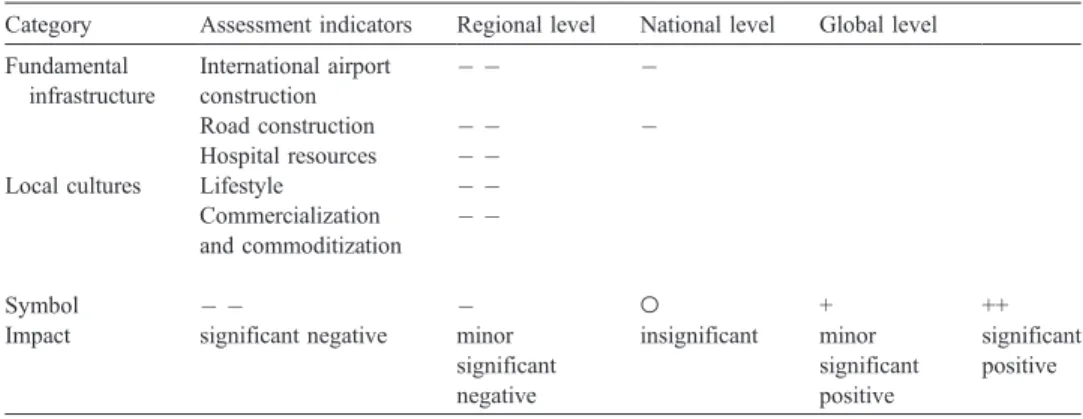
The final topic of the SEA matrix system is bothersQ which consists of two categories, namely, fundamental infrastructure and local cultures (Table 9). International airport and road construction are selected here and significant impacts are concluded because a new international airport for the NFP Plan will be built in Taichung County near the Changhwa County; in addition, a new road network will be established for tourists and transportation of products (Changhwa County, 2002). Another problem is that hospital resources in Changhwa County are not enough for emergency service when the exhibition attracts so many visitors per day.
Tourism’s effect upon local cultures is also regarded as an important assessment category. One of the possible consequences for cultures that are exposed to tourism is what anthropologists term as the ddemonstration effectT (Burns, 1999) as lifestyle of the local population will change. Another criticism often made of tourism’s effect upon local
cultures is that it can lead to their commercialization and commoditization (Holden, 2000); consequently, it is also regarded as significant negative impact in the regional level.
5. Conclusions
A Delphi–matrix approach to SEA and its application within the tourism sector in Taiwan is investigated in this study. This new assessment approach to SEA is based on the impact matrix combination with sustainable indicators, and then the Delphi method is employed to collect experts’ opinions. In addition, an application of this Delphi–matrix approach within the tourism sector is examined; in contrast, most applications of SEA are about energy, transportation, waste management, etc. The assessment of impacts from the NFP Plan and TF 2008 program is taken as an example to explain the procedures of this new approach. First, appropriate indicators are selected with the Delphi method. Then, 69 of the 98 candidate indicators are selected, and the impact matrix system is established containing eight topics and 26 corresponding categories. After the impact matrix system for SEA established, a workshop is held to analyze the impacts from the NFP Plan and TF2008 Program.
According to the findings of this study, the Delphi–matrix approach to SEA is feasible and this new approach has some advantages that can solve problems of Taiwan’s SEA. First, this approach can evaluate the sustainability of policy, plan, and program because sustainable indicators are used. Second, this approach can converge different opinions successfully because the Delphi method is employed, and it lets experts have enough time for decision making. In addition, the assessment indicators are flexible and are subjected to each policy, plan, and program, respectively.
Although many tourism impacts have been described in previous studies, they barely concern exhibitions although international exhibitions, expositions, and festivals are one of the important tourism activities recently. The location of exhibitions often becomes a popular destination and attracts millions of tourists in a short time, but negative impacts might occur at the same time. The impacts resulting from (horticultural) exhibitions are investigated firstly with SEA here and the negative impacts are considered as comprehensive as possible during every stage such as planning, construction, and on exhibition.
According to the results of SEA here, three major types of impacts are significant in the garden and horticultural exhibition program, namely, resources’ usage, behavioral considerations, and pollution. Resources’ usages, such as water, electricity, and natural gas demand, are so huge that the conflict between tourism development with local communities may occur. The behavior of local people might be affected seriously due to mass tourism and perhaps ddemonstration effectT. In addition, a range of different types of pollution will result from garden and horticultural exhibitions such as air, water, soil, waste, and noise. For example, the amount of waste from tourists is 22 tons/day, and it exceeds the capacity of solid waste treatment.
Further tasks can be carried out based on the impact matrix system for SEA established at this phase such as defining quantifiable targets. Clearly, the definition of targets is fundamental in working with indicators. In addition, defining quantifiable targets is often more difficult than identifying indicators, because targets are normally political, cultural,
and geographically specific. They must relate to the scale of decision making, whether a regional or a national scale. Where targets have been established, they can be taken as benchmarks. After an acceptable common set of targets for this assessment system is identified and established, other alternative designs and plans to reduce negative impacts concerning garden and horticultural exhibition can also be proposed and examined.
Appendix A. The matrix system used in Taiwan
Appendix B. Environmental loads of international garden and horticultural exhibitions
Assessment topic Assessment
category Assessment indicators (criteria) Impact assessment Regional level National level Global level (1) Environment carrying capacity No suggestiona No suggestiona (2) Natural ecosystems (3) Public health and safety (4) Use of natural resources (5) Water resources system (6) Cultural heritage and harmony of natural landscape (7) International environmental rules (8) Others a
The assessment categories and relative indicators are not suggested under the Administrative Regulations of Environmental Impact Assessment of Government Policies (EPA, 1997).
Exhibitions EXPO’90a Japan Flora 2000b Pacific Flora 2004c Taiwan Flora 2008
Year 1990 2000 2004 2008
Location Osaka, Japan Hyogo, Japan Shizuoka, Japan Changhwa, Taiwan
Opening days 183 184 187 175
Total area (ha) 140 96 56 66
Number of visitors (in thousands) 23,127 6950 5000 3500
Solid waste (ton/day) 39.63 11.91 8.57 22d
Electricity used (kwh/day) 285,000 86,000 62,000 101,600e
Natural gas (m3/day) 14,260 4290 3086 2400f
Water demand (m3/day) 6750 2026 1457 6000g
a The Commemorative Foundation for the International Garden and Greenery Exposition (1991). b The Association for Projects Commemorating Japan Flora, 2000 (2001).
c The Association for the Shizuoka International Garden and Horticultural Exhibition (2002). d The per capita data used is 1.1 kg/day, and number of visitors per day is 20,000. e
The per capita data used is 5.08 kwh/day, and number of visitors per day is 20,000.
f
The per capita data used is 0.12 m3/day, and number of visitors per day is 20,000.
g
Appendix C. Emission of carbon dioxide from Taiwan Flora 2008 Program
References
Allen J, O’Toole W, McDonnell I, Harris R. Festival and special event management, Milton, Australia. Australia7 John Wiley and Sons; 2002.
Ap J. Residents’ perceptions on tourism impacts. Ann Tour Res 1992;19(4):665 – 90.
Briguglio L, Briguglio M. Sustainable tourism in the Maltese Isles. In: Briguglio L, Butler R, Harrison D, Filho WL, editors. Sustainable tourism in islands and small states. London (UK)7 Pinter Press; 1996. p. 161 – 79.
Burns P. An introduction to tourism and anthropology. London (UK)7 Routledge Press; 1999.
Changhwa County. A master plan of National Floriculture Park Plan and Taiwan Flora 2008 Program. Changhwa (Taiwan)7 Chang-Hong Planning Company Press; 2002.
Cunningham WP, Cunningham MA. Principles of environmental science: inquiry and applications. New York (USA)7 McGraw-Hill Press; 2002.
Cox G. Faster, higher, stronger—but what about our rights? human rights and hallmark events. Impact Assess Proj Apprais 1998;16(3):112 – 21.
DETR. Proposals for a good practice guide on sustainability appraisal of regional planning guidance. London (UK)7 Department of Environment, Transports and the Regions Press; 1999.
EPA. Administrative Regulations of Environmental Impact Assessment of Government Policies. Taipei, Taiwan7 Environmental Protection Agency Press; 1997.
EPA. Yearbook of environmental information of the Republic of China. Taipei (Taiwan)7 Environmental Protection Agency Press; 2002.
Executive Yuan. Doubling tourist arrivals policy. Taipei (Taiwan)7 Executive Yuan, R.O.C. Press; 2001. Fayos-Sola’ E. The impact of mega events. Ann Tour Res 1998;25:241 – 5.
Feldmann L, Vanderhaegen M, Pirotte C. The EU’s SEA directive: status and links to integration and sustainable development. Environ Impact Asses Rev 2001;21(3):203 – 22.
Finnveden G, Nilsson M, Johansson J, Persson A, Moberg A, Carlsson T. Strategic environmental assessment methodologies: applications within the energy sector. Environ Impact Asses Rev 2003;23:91 – 123. Getz D. Event management and event tourism. New York (USA)7 Cognizant Communication; 1997. Graedel TE, Allenby BR. Industrial ecology. New Jersey (USA)7 Pearson Education Press; 2003.
Stage Sector Emission factora
(kg CO2/m2year)
Area of building (m2)
Amount of CO2
emission Planningb Planning and design 0.04 (t=100 years) 132,000 528 tons
Constructionb Building 14.68 (t=100 years) 132,000 193,776 tons
Machinery 4.92 (t=100 years) 132,000 64,944 tons
Maintenance Electricity 105.24 132,000 13,892 tons/year
Natural gas 4.61 132,000 609 tons/year
Petroleum 28.11 132,000 3,711 tons/year
Water 9.61 132,000 1,269 tons/year
Waste water 4.04 132,000 533 tons/year
Reuse water 3.04 132,000 401 tons/year
Other affairs 4.41 132,000 582 tons/year
Ultimate treatment of buildingb
Building 2.94 (t=100 years) 132,000 38,808 tons
Machinery 0.98 (t=100 years) 132,000 12,936 tons
a Emission factor is fromHyogo Prefectural Policy Studies Association (2001). b The life cycle of building is 100 years.
Gursoy D, Kim K, Uysal M. Perceived impacts of festivals and special events by organizers: an extension and validation. Tour Manage 2004;25:171 – 81.
Holden A. Environment and tourism. London (UK)7 Routledge Press; 2000.
Huang SL, Liao RH, Chen TC. Establishment of sustainability indicators for Taipei City. Urban Plann 1997;24(1):150 – 67.
Hyogo Prefectural Policy Studies Association. Environmental management system for Japan Flora 2000. Hyogo (Japan)7 Hyogo Prefecture Press; 2001.
IADB. Tourism development program in northeastern Brazil: 2nd stage (PRODETUR/NE-II) Program document: BR03-23. Harare (Zimbabwe)7 The Inter-American Development Bank, 2003.
IAIA. Strategic environmental assessment: key elements and practices in european approaches IAIA’02 Pre-Meeting Training Course. Hague (the Netherlands)7 International Association for Impact Assessment Press; 2002.
IUCN-ROSA. Strategic environmental assessment of development around Victoria Falls. Harare (Zimbabwe)7 World Conservation Union, Regional Office for Southern Africa (IUCN-ROSA); 1996.
Kreisel WE. Representation of the environmental quality profile of a metropolitan area. Environ Monit Assess 1984;4:15 – 33.
Lee N, Walsh F. Strategic environmental assessment: an overview. Proj Appraisal 1992;7(3):126 – 36. Linstone HA, Turoff M. The Delphi method: techniques and applications. Massachusetts (USA)7
Addison-Wesley; 1975.
Liou ML, Yu YH. Development and implementation of strategic environmental assessment in Taiwan. Environ Impact Asses Rev 2004;24:337 – 50.
Mathieson A, Wall G. Tourism: economic, physical and social impacts. London (UK)7 Longman Press; 1982. Mieczkowski Z. Environmental issues of tourism and recreation. Lanham (USA)7 University Press of America
Press; 1995.
Mwalyosi R. Improving the effectiveness of environmental impact assessment and strategic environmental assessment in southern Africa. Paper Presented at the Proceeding of Workshop of the Southern Africa Institute for Environmental Assessment, Windhoek, Namibia, 15–16 May 2003.
NCSA. Okavango delta management plan—project proposal. Gaborone7 National Conservation Strategy Agency; 2002.
ODPM. The strategic environmental assessment directive: guidance for planning authorities. London (UK)7 Office of the Deputy Prime Minister; 2003.
Partida´rio MR. Strategic environmental assessment: key issues emerging from recent practice. Environ Impact Asses Rev 1996;16(1):31 – 55.
Partida´rio MR. Strategic environmental assessment: principles and potential. In: Petts J, editor Handbook on Environmental Impact Assessment, vol. 1. Oxford (UK)7 Blackwell Press; 1999. p. 60 – 73.
Partida´rio MR, Moura V. Strategic sustainability appraisal: one way of using SEA in the move toward sustainability. In: Partida´rio MR, Clark R, editors. Perspectives on strategic environmental assessment. New York7 CRC Press; 2000. p. 29 – 66.
Sadler B, Verheem R, 1996. Strategic Environmental Assessment: Status, Challenges and Future Directions, vol. 53. Hague (the Netherlands)7 Ministry of Housing, Spatial Planning and the Environment of the Netherlands Press; 1996.
Scheibe M, Skutsch M, Schofer J. Experiments in Delphi methodology. In: Linstone HA, Turoff M, editors. The Delphi method: techniques and applications. Massachusettes (USA)7 Addison-Wesley; 1975. p. 257 – 81. The Association for Projects Commemorating Japan Flora, 2000. Report of Japan Flora 2000: communication
between people and nature. Hyogo, Japan7 Japan Flora 2000 Association Press, 2001.
The Association for the Shizuoka International Garden and Horticultural Exhibition. Action plan for Pacific Flora 2004. Shizuoka, Japan: Pacific Flora 2004 Association Press, 2002.
The Commemorative Foundation for the International Garden and Greenery Exposition. EXPO’90 foundation: the harmonious coexistence of nature and mankind. Osaka (Japan)7 EXPO’90 Foundation Press; 1991. Therivel R. Systems of strategic environmental assessment. Environ Impact Asses Rev 1993;13(3):145 – 68. Therivel R. Strategic environmental assessment of development plans in Great Britain. Environ Impact Asses Rev
Therivel R, Partida´rio MR, editors. The practice of strategic environmental assessment. London (UK)7 Earthscan Publications Press; 1996.
Verheem R. Present status of SEA in the Netherlands. Japan Environmental Agency: the International Workshop on Strategic Environmental Assessment. Tokyo (Japan)7 Japan Environmental Agency Press; 1998. p. 48 – 56. Waitt G. Social impacts of the Sydney Olympics. Ann Tour Res 2003;30(1):194 – 215.
Wood C. Environmental impact assessment: a comparative review. Edinburgh (UK)7 Longman Press; 1995. Wood C, Djeddour M. Strategic environmental assessment: EA of policies plans and programmes. Impact Assess
Bull 1992;10(1):3 – 21.
Woodley S. Tourism and sustainable development in parks and protected areas. In: Nelson JG, Butler R, Wall G, editors. Tourism and sustainable development: monitoring, planning, managing, Canada. Taipei (Taiwan)7 The University of Waterloo Press, 1993. p. 83 – 96.
WWF. A strategic environmental assessment of Fiji’s tourism development plan Report of the South Pacific Programme. Taipei (Taiwan)7 World Wide Fund for Nature, 2003.
Yeh JR. An evaluation system of sustainable development in Taiwan. Taipei (Taiwan)7 National Science Council Press; 2001.
Yu YH, Huang CT. The establishment of the methodologies of SEA in Taiwan. Taipei (Taiwan)7 Environmental Protection Agency Press; 2002.
Nae-Wen Kuo is an Assistant Professor in the Graduate Institute of Tourism and Health Science, National Taipei College of Nursing, Taiwan. His research interests are in environmental impact assessment and management, particularly strategic environmental assessment and health impact assessment.
Teng-Yuan Hsiao is an Assistant Professor in the Department of Tourism Industry, Jin-Wen Institute of Technology, Taiwan. His research interests focus on environmental management of tourism industry.
Yue-Hwa Yu is a Professor at the Graduate Institute of Environmental Engineering, National Taiwan University. His research interests focus on the development of environmental impact assessment and strategic environmental assessment in Taiwan.