國 立 交 通 大 學
光 電 工 程 學 系
博 士 論 文
可調單頻 Nd:GdVO
4雷射及其光譜應用
Tunable single frequency Nd:GdVO
4
laser
and its spectroscopic applications
研 究 生: 施 能 謙
指導教授: 謝文峰 教授
施宙聰 教授
可調單頻 Nd:GdVO
4雷射及其光譜應用
Tunable single frequency Nd:GdVO
4
laser
and its spectroscopic applications
研 究 生: 施 能 謙
Student: Nang-Chian Shie
指導教授: 謝文峰 教授
Advisor: Dr.Wen-Feng Hsieh
施宙聰 教授
Dr.Jow-Tsong Shy
國 立 交 通 大 學
光 電 工 程 學 系
博 士 論 文
A Dissertation
Submitted to Department of Photonics and Institute of Electro-Optical Engineering College of Electrical and Computer Engineering
National Chiao Tung University
in Partial Fulfillment of the Requirements for the Degree of Doctor of Philosophy
in
Electro-optical Engineering
March 2014
Hsinchu, Taiwan, Republic of China
ii
可調單頻 Nd:GdVO
4雷射及其光譜應用
研究生: 施能謙
指導教授: 謝文峰 教授
施宙聰 教授
國立交通大學光電工程學系博士班
摘要
本論文旨在以體積型布拉格光柵做為平凹共振腔輸出端反射鏡而建
立中心波長 1070 nm 之單模 Nd:GdVO
4固態雷射。再經過週期性極化
鈮酸鋰晶體產生二倍頻後,此雷射是鉈原子宇稱性不守恆實驗中的極
佳光源。鉈原子宇稱性不守恆測量需有精密之原子理論計算,本論文
利用此光源對鉈原子
6P3/2 → 7S1/2能階躍遷進行精密頻率測量,測量結
果可驗證原子結構理論計算的正確性。此光源也用於測量碘分子在
535 nm 附近之超精細譜線。
我們建立的單模 1070 nm Nd:GdVO
4固態雷射的輸出功率可達
300 mW。此雷射在輸出功率 200 mW 時之光束傳輸因子
2M
約為 1.2,
擴散角約為 0.37°。在輸出功率 100 mW 時以共振腔調控之單模頻率
範圍達 5.1 GHz。我們以共焦式共振腔對此光源進行鎖頻,得到相對
頻率穩定度為 7.58 kHz。此穩頻光源由光纖放大器提升功率後再經過
週期性極化鈮酸鋰晶體,藉由非線性效應產生二倍頻得到 535 nm 光
源。
iii
Nd:GdVO
4雷射倍頻光源掃描碘分子在 535 nm 附近之 P(28) 30-0
超精細光譜,並針對其中 a
1, a
10及
a
15各超精細譜線進行絕對頻率量
測。本論文利用飽和光譜三次諧波解調技術產生頻率誤差訊號,將
Nd:GdVO
4光源穩頻在碘分子光譜的超精細譜線上,當雷射光源穩頻
在 a
1譜線時之頻率穩定度在平均時間 10 秒時可達
310-12。光頻梳測
量雷射光源穩頻於超精細譜線的絕對頻率,絕對頻率測量結果續經壓
力頻移量的修正後得到零壓力下的絕對頻率值。最後我們也針對 a
10超精細譜線測量其壓力增寬效應及功率增寬效應。
中空陰極管中之鉈原子兩同位素
203Tl 及
205Tl 6P
3/2→ 7S
1/2躍遷
的飽和吸收光譜由 Nd:GdVO
4雷射倍頻光源利用波長調制三次諧波
解調技術得到超精細光譜,並由此得到頻率誤差訊號來進行雷射穩頻。
分析雷射穩頻後的頻率誤差訊號,得到頻率穩定度在 1 秒平均時間時
可達 30 kHz,此穩頻光源將可做為鉈原子的雷射冷卻之用,也可用
來研究鉈原子宇稱性不守恆。藉由精密波長儀測量穩頻光源之頻率得
到鉈原子超精細譜線的絕對頻率,準確度達 30 MHz,經壓力頻移量
的修正兩同位素的躍遷頻率之頻率重心的準確度可達 22 MHz,且推
算出的同位素頻移量符合現知文獻資料。此鉈原子精密頻率測量結果
將可做為鉈原子波動函數精確度的測試及檢驗基準。
iv
Tunable single frequency Nd:GdVO
4laser
and its spectroscopic applications
Student: Nang-Chian Shie Advisors: Dr. Wen-Feng Hsieh
Dr. Jow-Tsong Shy
Department of Photonics and Institute of Electro-Optical Engineering
National Chiao Tung University
Abstract
This thesis work developed a single frequency diode-pumped Nd:GdVO4 laser at 1070
nm using a volume Bragg grating as the output coupler of a short plano-concave cavity. After second harmonic generation with a periodically-poled lithium niobate (PPLN), this laser is an excellent source for parity non-conservation (PNC) experiments using thallium atom. The accuracy of atomic theory which is needed to determine the thallium PNC motivated us to include the precise frequency measurement of the thallium 6P3/2 → 7S1/2 transition as part of this thesis. The light source was also utilized
realize the absolute frequency measurements of the hyperfine components of molecular iodine at 535 nm.
The developed 1070 nm single frequency Nd:GdVO4 laser can achieve an output
power of 300 mW. The beam propagation parameter
M
2at 200 mW was ~1.2, and the divergence angle was ~0.37. The single frequency range with cavity length tuning was 5.1 GHz at 100 mW output power. We also locked the laser frequency to a confocal reference cavity and a relative stability of 7.58 kHz was achieved. After amplification of the fiber amplifier, the frequency stabilized 1070 nm laser passed through a PPLN to obtain a 535 nm light source by second harmonic generation.v
The absolute frequency of the a1, a10, and a15 hyperfine components of molecular
iodine P(28) 30-0 line at 535 nm were measured with the frequency doubled Nd:GdVO4 laser. The frequency doubled 1070-nm Nd:GdVO4 laser was frequency
stabilized to a hyperfine component of I2 using the saturation absorption spectroscopy
and the third harmonic demodulation technique. The frequency stability of 310-12 was achieved at 10 second averaging time when its frequency was stabilized to the a1
component. An optical frequency comb was used to measure its absolute frequency. The pressure shift was investigated to obtain the absolute frequency at zero pressure. The effect of pressure and power broadening of the a10 component were also
investigated.
The saturated absorption spectrum of the 6P3/2 → 7S1/2 transition of 203Tl and 205Tl
in a hollow cathode lamp was observed with the frequency-doubled 1070 nm Nd:GdVO4 laser. Similar to the iodine spectrum measurement, the third-derivative
spectrum of the hyperfine components were obtained using the wavelength modulation spectroscopy and used to stabilize the laser frequency. Analysis of the error signal showed that the frequency stability reaches 30 kHz at 1 s averaging time. Such a frequency-stabilized light source at 535 nm can be used for laser cooling of thallium and for investigating the PNC effect in thallium. The absolute frequencies of hyperfine components were measured with an accuracy of 30 MHz using a precision wavelength meter. Including the pressure shift correction, the center of gravity of the transition frequency was determined to an accuracy of 22 MHz for both isotopes. Meanwhile, the isotope shift (IS) derived was in good agreement with earlier measurement. The precision measurements of thallium atomic structure can serve as the experimental constraints and benchmarks for the improvements of thallium wavefunction calculations.
vi
誌謝
因緣際會下,很幸運地在博士班的學涯中有了謝文峰老師及施宙聰老師兩 位共同指導教授,兩位老師有著不同的行事風範,卻有相同的研究熱忱以及同 樣的教育熱情,在兩位老師的領導下感到收穫滿載,研究工作以及論文撰寫也 在兩位老師共同指導下才得以完成,特此感謝。 也感謝賴暎杰老師、電物系陳永富老師、清大物理系劉怡維老師、中央大 學物理系易台生老師、中央大學光電系鍾德元老師在百忙中撥冗擔任口試委員, 並給予寶貴的意見與指正。 實驗室是個大家庭,彼此協助才得以解決許多實驗問題,在此感謝仕恩及 君瑀在實驗工作上不遺餘力地支援,也感謝阿毛、小丁、佩凌、小花、老爹在 實驗工作上的討論與幫忙,也感謝平時聊天聊是非的家瑜。實驗室的歡笑吵雜 聲將是永遠的回憶。 感謝工研院給予在職進修,感謝工研院朱時梁博士提供此進修機會。 感謝好友吳龍暉博士,在我準備博士班資格考筆試期間出借居屋,也感謝 陳豐榮學弟熱心陪讀,並賀豐榮學弟順利取得博士學位。 感謝學長王井煦博士,從大學時代一直走在前面帶領我,在這過程中不間 斷地解惑與導正,尤其是聽我發牢騷,解悶氣。 感謝和南寺的道懌師父及諸師兄弟多年來持續地關懷。 要感謝的人太多了! 真誠感謝過程中所有的貴人。在工作多年後進修博士 班是一個大挑戰,感謝家人的支持,特別感謝我的另一半純芳無怨無悔地鼓勵 與支持,讓我在工作、學業與家庭的多重考驗下得以完成此學程。vii
Table of Contents
摘要 ... ii
Abstract ...iv
誌謝 ...vi
Table of Contents ... vii
List of Figures ... x
List of Tables ... xii
Chapter 1 Introduction ... 1
1.1 Motivation ... 1
1.2 Achievements of Thesis ... 3
1.3 Organization of Thesis ... 6
Chapter 2 Basic Background ... 7
2.1 Parity Nonconservation and Thallium ... 7
2.1.1 Standard Model... 7
2.1.2 Atomic Parity Non-conversation ... 8
2.1.3 Observations of Atomic Parity Nonconservation ... 11
2.1.3 Thallium Structure ... 12
2.2 Volume Bragg Gratings ... 13
2.2.1 Properties of Volume Bragg Grating ... 13
2.2.2 Volume Bragg Grating Applications in Lasers ... 14
2.2.3 Diffraction Analysis for a Reflecting Volume Bragg grating ... 15
2.3 Nd:GdVO4 Solid State Laser ... 19
2.3.1 Laser Gain Mediun Nd:GdVO4 ... 20
2.3.2 Wavelength Selection ... 22
viii
Chapter 3 Single Frequency 1070 nm Nd:GdVO4 Laser Using a Volume Bragg
Grating ... 25
3.1 Introduction ... 25
3.1.1 Motivation ... 25
3.1.2 Laser Material ... 25
3.1.3 Laser Narrowing by Volume Bragg Grating ... 26
3.2 Experiments and Results ... 27
3.2.1 Experimental Setup of the Nd:GdVO4 laser ... 27
3.2.2 Output Properties of the Single Frequency Nd:GdVO4 Laser ... 29
3.2.3 Frequency Stabilization ... 32
3.3 Laser with Spherical-flat Laser Crystal ... 33
3.4 Laser Frequency Stabilization ... 35
3.5 Second Harmonic Generation 535 nm Laser ... 35
Chapter 4 Absolute Frequency Measurements of the Molecular Iodine Hyperfine Transitions at 535 nm ... 37
4.1 Introduction ... 37
4.2 Experimental Setup ... 38
4.2.1 Laser Setup for Iodine Spectrum ... 38
4.2.2 Iodine Absorption Spectroscopy Experiment ... 39
4.2.3 Iodine Absolute Frequency Measurement ... 40
4.3 Results and Discussions ... 41
4.3.1 Iodine Absorption Spectrum ... 41
4.3.2 Frequency Stability of the Iodine Locked Laser ... 42 4.3.3 Absolute Frequency Measurement of the Iodine Hyperfine Transition43 4.3.4 Pressure and Power Broadening of the Iodine Hyperfine Component46
ix
Chapter 5 Frequency Measurement of the 6P3/2 →7S1/2 Transition of Thallium ... 49
5.1 Introduction ... 49
5.2 Experimental Setup ... 51
5.2.1 Description to Laser Setup for Thallium Spectrum ... 51
5.2.2 See-Through Hollow Cathode Lamp and Optogalvanic Signal ... 52
5.2.3 Thallium Absorption Spectrum... 54
5.2.4 Wavelength Meter Calibration ... 54
5.3 Experimental Results and Discussion... 55
5.3.1 Thallium Hyperfine 6P3/2→7S1/2 Transition Spectrum ... 55
5.3.2 Spectral Linewith of the Thallium Hyperfine Transition... 56
5.3.3 Frequency Stability of the Frequency Locked Laser ... 57
5.3.4 Absolute Frequency, Hyperfine Splitting and Center of Gravity of the Thallium 6P3/2→7S1/2 Hyperfine Transitions ... 58
Chapter 6 Summary ... 61
6.1 Summary ... 61
6.2 Future Works ... 62
x
L
ist of Figures
Fig. 1-1 Partial energy level of 205Tl (203Tl) ... 2
Fig. 1-2 Fluorescence spectrum of the laser crystal 0.5% at. Nd3+ doped GdVO4 at room temperature. ... 4
Fig. 2-1 Electrons in an atom interact with the nucleus through the electromagnetic force and weak force. ... 9
Fig. 2-2 Partial energy-level diagram of 203Tl and 205Tl with the HFSs and isotope level shifts in the unit of MHz ... 13
Fig. 2-3 Comparison of Modeling with experimental diffraction efficiency of finite beam in reflective volume Bragg grating with 1.24 mrad beam divergence and 23 mrad beam divergence ... 18
Fig. 2-4 Reflection spectrum of the VBG used in this thesis ... 19
Fig. 2-5 Schematic diagram of a typical laser. ... 20
Fig. 2-6 A simplified energy level diagram of the 4F3/2→4I11/2 manifolds... 21
Fig. 3-1 Center wavelength and band width of the VBG used in this laser cavity .... 27
Fig. 3-2 Schematic diagram of the single frequency laser. ... 29
Fig. 3-3 Fabry-Perot trace of the single frequency Nd:GdVO4 laser ... 30
Fig. 3-4 The far-field intensity distribution of the 1070 nm laser ... 30
Fig. 3-5 1070 nm laser single frequency output power as a function of the incident pump power ... 31
Fig. 3-6 Schematic diagram of the frequency stabilization setup ... 32
Fig. 3-7 Error signals obtained by scanning laser frequency across the resonance peak and after laser was locked. ... 33
Fig. 3-8 Schematic diagram of the single frequency Nd:GdVO4 laser ... 34
xi
Fig. 3-10 Second harmonic generation of 535 nm laser ... 36 Fig. 4-1 Experimental layout of the iodine laser stabilization ... 38 Fig. 4-2 Hyperfine spectrum a1−a15 of the iodine P(28) 30-0 line. ... 42
Fig. 4-3 Fractional Allan deviation of the measured beat frequency between the laser locked on a1 component and the OFC. ... 43
Fig. 4-4 Measured absolute frequencies versus iodine vapor pressures for hyperfine components a1, a10, and a15 ... 45
Fig. 4-5 Linewidth of a10 versus the iodine vapor pressure for the pump and probe
powers fixed at 22.9 mW and 0.39 mW. ... 47 Fig. 4-6 Linewidth of a10 versus pump power for the cold finger temperature of the
iodine cell fixed at 0.1 ºC (4.2 Pa) ... 48 Fig. 5-1 Energy-level diagram of 203Tl and 205Tl with the hyperfine splittings and
isotope level shifts in the unit of MHz. The six lines investigated in this work are labeled A1, A2, A3 and B1, B2, B3 ... 50 Fig. 5-2 Schematic of the experimental setup. ... 51 Fig. 5-3 Observed spectrum of hyperfine components of the 6P3/2→7S1/2 transition
in atomic thallium at 535 nm. ... 56 Fig. 5-4 Allan deviation of the laser locked to B2 component at 535 nm. ... 57
xii
List of Tables
Table 2-1 Comparison of Nd-doped solid state materials ... 21 Table 4-1 Selected hyperfine transition frequencies of the P(28) 30-0 line and
comparisons to the calculated values... 44 Table 5-1 The absolute frequencies of the hyperfine components within 6 P3/2 → 7S1/2
transition of of 203Tl and 205Tl in HCL at a background neon pressure of 14 torr. ... 60
1
Chapter 1
Introduction
1.1 Motivation
High precision measurements of the PNC effects and the permanent electric dipole moment (EDM) using atomic systems are promising in testing the standard model (SM) and searching for the new physics. Heavy atoms, such as cesium (Cs) and thallium (Tl), are adopted in the PNC and EDM experiments because these symmetry violation effects are enhanced by their large nuclei. However, in the atomic PNC measurement, an accurate theoretical calculation of atomic structure is needed for such test. In the case of Cs, an accurate PNC measurement of 0.35% accuracy combined with an accurate calculation of 0.5% accuracy leads to the most accurate result for the weak charge of cesium nucleus, which can be compared with the prediction of the SM [1, 2]. On the contrary, the 1.7% uncertainty PNC experiment in Tl system using 6 P1/2 → 6P3/2
transition [3, 4], combining with the 2.5% accuracy of Tl atomic theory, leads to a total uncertainty of 3.0% for the inferred weak charge of thallium nucleus. The Tl atom, which has only one unpaired electron, is one of the best candidates to measure the weak charge of nucleus. However, its atomic structure is more complicated than the alkalis and the accuracy of theoretical calculation is limited. Precision measurements of thallium atomic structure, such as the absolute transition energy, hyperfine splitting (HFS) and IS can serve as the experimental constraints and benchmarks for the improvements of theory.
On the other hand, the measurement of the electric dipole moment of atomic Tl [5] has been the most precise experiments to set the upper limit of electron’s EDM for decades, until the recent improvement using the molecular YbF [6]. The implementation of laser cooling on atomic thallium, which produces slow intensive
2
atomic beam or ultracold sample, can offer great advantages for further reducing systematic uncertainties and increasing signal strength for the EDM experiment. A cooling scheme based on the metastable 6P3/2 state has been proposed and investigated
[7]. It utilizes the 6P1/2 ↔6D5/2 transition, which has a high transition rate and can be
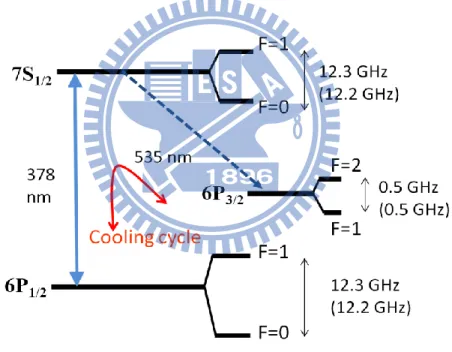
considered as a nearly closed two-level cooling cycle. However, the difficulty of this scheme is the availability of high power 352 nm cooling UV laser source. An alternative approach is the two-color Λ type cooling scheme, which can be adapted to AIII group atoms and has been realized for cooling indium [8]. In atomic thallium, as the energy levels shown in Fig. 1-1, it involves the 6P1/2 - 7S1/2 - 6P3/2 transitions at 378
nm and 535 nm. The 378 nm laser causes an optical pumping effect to trap population
in the 6P3/2 metastable state due to the large branch ratio of 7S1/2 → 6P3/2 decay route (in
comparison with 7S1/2→6P1/2), then a long recovering time back to the 6P1/2 ground
state. This implies a low effective laser cooling process. Another 535 nm laser is required to re-pump the population from 6P3/2 to 7S1/2 to form a closed cycling. Stable
3
and powerful laser sources of 378 nm and 535 nm are required to access the 6P1/2 - 7S1/2
- 6P3/2 transitions and to achieve laser cooling of thallium atom. For the 378 nm
transition a laser source can be generated by frequency doubling the 755-nm light from a Ti:sapphire laser [9]. For the 535 nm transition, however, only dye laser system was available in the past. A reasonable method to acquire a 535 nm laser is to utilize frequency doubling from a 1070 nm laser. In addition to laser cooling, the 535 nm laser can be used in frequency measurement of the 6P3/2 → 7S1/2 hyperfine transitions.
Precision measurements of HFS and IS in thallium atomic structure will be used to guide the refinement and test the accuracy of the atomic theory calculation.
1.2 Achievements of Thesis
The main motivation of this work has been the development of a laser source for achieving the laser cooling of thallium atoms and frequency measurement of the 6P3/2
→ 7S1/2 hyperfine transitions. Fortunately, Neodymium-doped gadolinium vanadate
(Nd:GdVO4), a solid-state laser crystal, has an emission line around 1070 nm which can
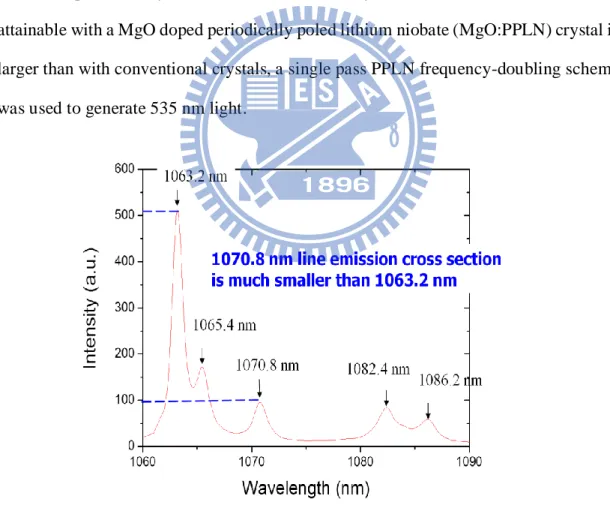
be used to obtain 535 nm by second harmonic generation [10], shown in Fig 1-2. The Nd-doped laser systems are well known for its 1063 nm lasing output wavelength and the 1070 nm emission band of the Nd laser crystal is weak and only 6 nm away from the main peak. The 1070 nm cross section is approximately five times smaller than that for the 1063 nm line. To obtain 1070 nm lasing with the Nd:GdVO4 the competing
transition channel at 1063 nm have to be suppressed. The 1070 nm band is too close to be separated from the 1064 nm band by a dielectric coated mirror. A volume Bragg grating (VBG) with many times narrower than the bandwidth achievable with multilayer coating is an ideal component to act as a wavelength selector [11]. VBGs offer an alternative approach for the wavelength selection and line narrowing in solid
4
state lasers [12, 13]. Using a VBG as an end mirror has been demonstrated great reduction of the laser output linewidth from few or few tenth of nm down to few pm or even single mode operation without a decrease in output power. Our aim was to achieve a 1070 nm single frequency diode-pumped Nd:GdVO4 laser using a short
plano-concave resonator in which a VBG serves the purpose of both the output coupler and the wavelength selector. The laser crystal was mounted on a piezoelectric transducer (PZT) for cavity length tuning. The frequency of the laser can be tuned coarsely by the VBG temperature and finely by the PZT voltage. When this proved to work as intended the single frequency laser was locked to the resonance peak of a confocal optical cavity to demonstrate its stability. Since the conversion efficiency attainable with a MgO doped periodically poled lithium niobate (MgO:PPLN) crystal is larger than with conventional crystals, a single pass PPLN frequency-doubling scheme was used to generate 535 nm light.
Fig. 1-2 Fluorescence spectrum of the laser crystal 0.5% at. Nd3+ doped GdVO4 at room temperature.
5
The tunable 535 nm laser was first applied to the absorption spectrum of molecular iodine. Third-harmonic demodulation technique was applied to analyze Doppler-free saturation spectrum to observe the hyperfine transitions of 127I2 P(28) 30-0 line at 535
nm. The broad spectrum of molecular iodine has been widely used for optical wavelength reference or laser frequency stabilization in the visible and near-infrared region. Several of the iodine stabilized lasers are recommended as the wavelength standards by the Comité International des Poids et Mesures [14, 15]. The extensive precision measurements of iodine spectrum allow characterizing and calculating the iodine hyperfine structures [16]. The accuracy of the calculation depends on the high-precision transition frequencies measured by available stable laser sources. The Nd:GdVO4 laser was stabilized to the a1, a10, and a15 hyperfine components and their
absolute frequencies were measured by an optical frequency comb [17], respectively. Our results are useful for improving the theoretical calculation. After succeeding in the measurement of the iodine spectrum, the Nd laser proved a 535 nm light source for application in thallium spectrum.
The 535 nm laser was thus used to perform a precise measurement of the absolute frequencies of hyperfine components of the 535 nm 6P3/2 → 7S1/2 transition for 203Tl
and 205Tl. A hollow cathode lamp (HCL) was utilized to provide vapor of the atomic thallium at the metastable 6P3/2 state. To tune the laser wavelength to the thallium
transition, the optogalvanic signal from the HCL was first detected to set the parameters of the laser system, e.g., the VBG and PPLN temperatures. The saturation spectroscopy was employed to resolve all the hyperfine transitions, and their absolute frequencies were measured using a precision wavelength meter [18]. We have achieved the frequency determination of the center gravity of the 6P3/2 → 7S1/2 transition with
6
1.3 Organization of Thesis
This thesis is based on the works that have been reported in the published papers. After the introduction, Chapter 2 will introduce the basic background, including Standard Model, atomic parity non-conservation, properties of the volume Bragg grating and Nd:GdVO4 solid state laser, for understanding the experiments and results. The
experimental results achieved are presented in Chapter 3 to Chapter5. Chapter 3 covers the background and experiment of the developed solid state laser, where a 1070 nm Nd:GdVO4 laser have been constructed with a volume Bragg grating as an output
coupler. The experimental results of the absolute frequency measurements of the molecular iodine hyperfine transitions at 535 nm are presented in Chapter 4, where the 535 nm light source is the second harmonic generation of the amplified 1070 nm laser which goes through a PPLN. Chapter 5 presents the precise frequency measurements of the hyperfine transitions of thallium with the developed 535 nm light source, where a hollow cathode lamp provides as the thallium vapor cell. Each chapter has its own brief introduction and a summary of its contents. Finally a summary of this thesis and future works are given in Chapter 6.
7
Chapter 2
Basic Background
2.1 Parity Nonconservation and Thallium
2.1.1 Standard Model
The Standard Model (SM) of particle physics summarizes the present state knowledge of particles and their interactions. It is a quantum based theory using quantum chromodynamics to describe strong interactions and the electroweak theory to unify weak and electromagnetic interactions. The gravity is not included in the SM. The SM theory proposes that these interactions result from exchange of force carrier particles called gauge bosons. The strong interactions of quarks are thought to be mediated by massless gluons. And the electroweak theory claims that the interactions between leptons (electron, muon, tau, neutrinos) and spin 1/2 quarks (up, down, top, bottom, charm, strange) are all mediated by four spin 1 bosons: the photon (), the neutral boson (Z0), and the charged bosons (W+ and W-). The photons mediate electromagnetic
interaction, and the W and Z bosons mediate the weak interactions. There are two types of weak interaction. If a charged boson (W+ or W-) is mediated, the interaction is called charged-current interaction, and is responsible for the beta decay phenomenon. If a neutral boson (Z0) is mediated, the interaction is called neutral current interaction. The
Z0 boson mass has been determined from the experiment at LEP to be 91.1876 ± 0.0021
GeV [19]. And, in the same way that an electric charge of a particle responses to an electromagnetic force, each particle and atomic nuclei have a weak charge Qw which
characterizes the weak force’s effect. SM is the most successful theory of particle physics to date. It provides a precise description of the observed phenomena and has been consistent with nearly all experimental results. Despite this great success, even more precise experiments are needed to continue testing the predictions of the SM as any deviation would imply a sign on new physics.
8
2.1.2 Atomic Parity Non-conversation
Atomic PNC experiments have been important tests of the SM of electroweak interactions because they are sensitive to the electroweak interaction at low energy, determining the bound state of the electron in an atom. Atomic PNC experiments provide an important complement to the accelerator based high energy experiments and search for the new physics beyond the SM. In an atomic system, the interactions between electron and nucleus are ongoing and the electromagnetic interactions dominate through mediated photons. Meanwhile the weak interactions through mediated Z0 boson exist in the presence of the relative huge electromagnetic
interactions, perturbing the wavefunction of the electron by as much as one part in 1010. The amplitude of the weak interaction must be measured under the interference of the electromagnetic interaction. The Z0 boson, however, has a parity non-conserving trait.
That is, the weak interaction violates parity symmetry, while the electromagnetic interaction does not. An observable parity violating effect in an atomic system can only be interpreted by the weak interaction. Precise atomic PNC experiments can be used to measure the weak charge Qw of the nucleus, which determines the strength of electroweak interaction, and test the electroweak theory.
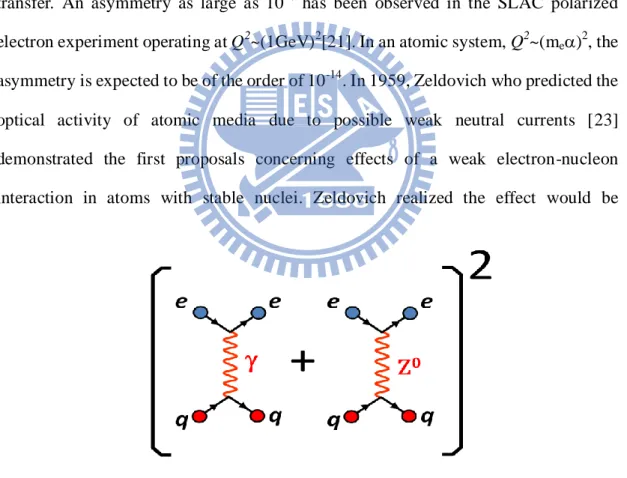
The coupling between electron and nucleon may be determined experimentally by observing the PNC in the electron-nucleon interaction. The electroweak theory describes the electroweak transition amplitude as the sum of two different electron-nucleon contributions (Fig. 2-1): an electromagnetic one of amplitude Aem and
a weak one of amplitude Aw,
w em
AA A . (2.1)
The transition rate is proportional to:
2 2 2 *
2 Re( )
w em w em
9
The first term is of negligible magnitude and can be ignored. The second term is the dominant term. The third term is the interference term. The interference term can be experimentally distinguished as it changes sign under a parity transformation. If a difference in rates between two coordinate system of opposite handedness is observed, a parity violating asymmetry (Apv) is proportional to the ratio of weak and
electromagnetic amplitudes [20-22] 2 2 2 4 w F PV em Z A G Q Q A A M
, (2.3)where GF is Fermi coupling constant, is fine structure constant, and Q is momentum
transfer. An asymmetry as large as 10-4 has been observed in the SLAC polarized electron experiment operating at Q2~(1GeV)2[21]. In an atomic system, Q2~(me)2, the
asymmetry is expected to be of the order of 10-14. In 1959, Zeldovich who predicted the optical activity of atomic media due to possible weak neutral currents [23] demonstrated the first proposals concerning effects of a weak electron-nucleon interaction in atoms with stable nuclei. Zeldovich realized the effect would be
Fig. 2-1 Electrons in an atom interact with the nucleus through the electromagnetic force and weak force. The electromagnetic force is mediated by massless photons (γ). The weak force is mediated by Z0 bosons.
10
immeasurably small at that time. However, the atomic PNC can be enhanced by several mechanisms. In 1974, M.A. Bouchiat and C. Bouchiat demonstrated that the strength of the atomic PNC scales with the cube of atomic number, the so-called Z3 law [24]. Since then, it thus possible to test the atomic PNC effects in heavy atoms.
The parity-violating parts of the weak force between electrons and nucleons in an atom can be separated into two groups according to the dependence on the nuclear spin: nuclear spin dependent effects (NSD-PV) and nuclear spin independent effects (NSI-PV). The spin independent effects are much easier to measure since they are proportional to the number of nucleons, while NSD-PV effects, which include Z boson exchange between electrons and nucleons, and the nuclear anapole moment, have a net contribution only from the unpaired nucleons—of which there is typically only one. Consequently, the NSI-PVs dominate atomic PNC, whereas NSD-PVs contribute small corrections.
In the non-relativistic limit, the NSI-PV can be written as [25],
( ) 5 ( ) ( ) 2 2 NSI F PV w e e G H Q r , ( 2.4)
where GF is the weak coupling constant, Qw is the weak nuclear charge, 5 is the Dirac
matrix and (r) is the nucleon density function. In the SM, the nuclear charge
2
(1 4sin )
w w
Q N
Z N, (2.5)where N is the neutron number, Z is the proton number, and w, the weak mixing angle,
is given to lowest order accuracy by sin2(w)=0.23. The relation between Qw and the
PNC amplitude, EPNC, can be represented as [26]
PNC w
E kQ , (2.6)
where k is an atomic-structure factor that can be computed from the atomic wavefunctions. The size of EPNC is determined not only by the weak nuclear charge, but
11
also the electron probability density inside the nucleus. To interpret a PNC measurement as a measurement of Qw requires an accurate atomic calculation. Precise
measurements of the parameters such as the hyperfine structure and lifetime are helpful in improving the wavefunction calculation. With the atomic-structure calculations of k, an atomic PNC measurement can determine an experimental value of the weak charge. Any deviation of the SM predicted weak charge from the experimental weak charge will indicate a new physics.
2.1.3 Observations of Atomic Parity Nonconservation
Optical rotation and Stark interference are so far the only two different types of experimental measurements of atomic PNC. Optical rotations have been measured in atomic bismuth [27], lead [28], thallium [3, 4] and samarium [29]. In Stark inference experiments the atomic PNC can be measured by observing its interference with a Stark-induced electric dipole (E1) transition amplitude. The E1 transitions between atomic states of the same parity are strictly forbidden by QED. The Stark interference atomic PNC measurements have been performed on atomic cesium [1], thallium [30], and ytterbium [31]. In the case of Cs, a PNC measurement of 0.35% accuracy combined with a calculation of 0.5% accuracy leads to the most accurate result for the weak charge of cesium nucleus, which can be compared with the prediction of the SM [1, 2]. On the contrary, the 1.7% uncertainty of the PNC experiment in the Tl system using the 6P1/2 → 6P3/2 transition [3, 4], combining with the 2.5% accuracy of Tl atomic theory,
leads to a total uncertainty of 3.0% for the weak charge of thallium nucleus. The Tl atom, which has only one unpaired electron, is one of the best candidates to measure the weak charge of nucleus. However, its atomic structure is more complicated than the alkali metals and the accuracy of theoretical calculation is limited. Precision
12
measurements of thallium atomic structure, such as the absolute transition energy, HFS and IS can serve as the experimental constraints and benchmarks for the improvements of theory calculation. Our motivation for measuring the hyperfine structure and IS in thallium atom is to guide the refinement and to test the accuracy of the atomic theory calculation for the short-range electron wavefunction.
2.1.3 Thallium Structure
The thallium atom of atomic number 81 is a lead-like metal with a bright, freshly cut surface. It is soft and can be cut with a knife. After exposure to air an oxide layer forms quickly on surface. The water soluble thallium is highly toxic.
High atomic number makes Tl one of the best candidates to measure the weak charge of nucleus because of the Z3 law [24]. The Tl electron configuration is [Xe]4f14 5d10 6s2 6p1, which has only one unpaired electron outside the S-state. Thallium has two stable isotopes, 205Tl ~70.5% and 203Tl~29.5%. Each Tl isotope has nuclear spin 1/2. This tells us that each fine structure state splits into two hyperfine states. A ground stat 6P1/2 electron has a greater probability of being found near the nucleus. A partial
energy level diagram is shown in Fig. 2-2.
However, Tl with three valence electrons has a more complicated atomic structure compared with Cs, which has only one valance electron. The large correlations between three-valence electrons cannot be accurately calculated using many-body perturbation theory (MBPT) [35]. Several new theoretical approaches have been developed for such atoms, for example, MBPT combined with configuration interaction and MBPT combined with coupled-cluster [36]. Precision measurements of thallium atomic structure, such as the absolute transition energy, HFS and IS can provide cross-checks for the new theory.
13
Early literatures have reported precise HFS measurements with uncertainties less than 1 kHz for both 6P1/2 and 6P3/2 states using microwave magnetic resonance
techniques in the 1950s [32, 33]. Recently precise measurements of the absolute transition frequency and the HFS of the 6P1/2 → 7S1/2 transition have been reported [9].
However, no precise measurements have been carried out for the 6P3/2 → 7S1/2
transition at 535 nm up to now. This motivated us to measure the hyperfine structure of Tl transition 6P3/2 → 7S1/2 using our developed single frequency Nd:GdVO4 laser.
2.2 Volume Bragg Gratings
2.2.1 Properties of Volume Bragg Grating
VBG is a periodic phase grating recorded in a bulk material. Based on a linear Fig. 2-2 Partial energy-level diagram of 203Tl and 205Tl with the HFSs and
isotope level shifts in the unit of MHz. Energy levels are not to scale. [9] [32-34].
14
photosensitivity photo-thermo-refractive (PTR) glasses are the most successful material used to manufacture a high efficiency VBG. The PTR is a silicate glass doped with cerium, silver, and fluorine. After UV-exposure with a holographic technique and thermal development the precipitation of a minor crystalline phase results in a holographic phase pattern throughout the whole glass volume.
The PTR VBGs provide extremely narrow spectral selectivity down to 20 pm, good narrow angular selectivity down to 100 μrad, high absolute diffractive efficiency (above 99.9%), and thermally stability of 400°C [37]. PTR VBG is mechanically, chemically and thermally stable. The damage threshold is close to that of the typical silicate glass. It has a laser damage threshold of 40 J/cm2 for 8 ns pulses, and tolerance to CW laser radiation in the near IR region up to several tens of kilowatts per square centimeter. By changing the temperature of VBG, the central reflection wavelength can be tuned by about 10 pm/K around 1μ m due to thermal expansion of PTR glass. The PTR properties [37]:
o Photosensitivity ranges from 280 to 350 nm o Transparency from 350 to 2700 nm
o Absorption in the near IR region below 0.0001 cm-1 o Refractive index 1.49
o Abbe number 60
o Photo-induced refractive index increment up to 1200 ppm o Spatial frequencies from 0 (zero) to 10,000 mm-1
o Phase pattern cannot be erased by any type of optical or ionizing radiation
2.2.2 Volume Bragg Grating Applications in Lasers
15
These unique features make VBG ideal for working as intracavity wavelength selectors or resonator couplers in various types of lasers, depending on designed properties. VBGs offer an alternative approach for the wavelength selection and line narrowing in solid state lasers [12]. Its excellent wavelength selectivity has been demonstrated with laser diodes [38, 39], solid state lasers [12-13,40-48], optical parametric oscillators [49-52] and fiber lasers [53-56]. Transversely chirped VBG has also been used for the wavelength tuning to obtain tunable solid-state laser [57] and OPO [58]. The VBG can also be used as a high power high-density beam combiner [59]. Thorough reviews of the prosperities and applications were given in refs. [60-64].
2.2.3 Diffraction Analysis for a Reflecting Volume Bragg grating
A theory which is based on a coupled-wave analysis for plane waves incident on a VBG was first presented by Kogelnik [65]. The PTR VBG consists of a sinusoidally varying refractive index modulation with period Λ according ton n0 n1sin(2
x/ ) , where the modulation n1 is up to10
3in magnitude. Assume a plane wave incident on the grating with an angle θ and wavelength λ. The reflected wavelength by Bragg condition is expressed as0 0
2 cos
B n
, (2.7)where
0 is the incident angle at Bragg condition. For each grating period of a reflecting VBG, there is the maximum wavelength
Bmax, which corresponds to normal incidence at
0 0, max 02
Bn
. (2.8)The beam incident on a reflecting VBG with wavelength exceeding
Bmaxcannot be diffracted by this particular grating at any conditions of excitation. The beam with16
shorter wavelengths incident at larger angles can be reflected by a Bragg mirror. The total power reflectivity at the plane x0 can be expressed as [63]
'2 2 '2 2 '2 2 '2 2 2 sinh ( ) cosh ( ) d R d
, (2.9)where the grating thickness d , wavevector mismatch 1 1
0 2 n( B )
and ' 1 cos n . The phase of the reflection is given by
'2 2 '2 2
( )
arctan(
tanh(
)) m
, (2.10)where m is an integer. m should be altered at the reflectivity zero points to give the phase continuity. The peak diffraction efficiency is at 0,
2 ' 2 1 2 1
max
0 0
tanh ( ) tanh ( ) tanh ( )
cos 2 cos cos
B n d n d R d n
(2.11)The zero-to-zero bandwidth of the reflection is defined as the distance between the two zeros closest to the peak to get a simple expression for the VBG bandwidth. The zero-to-zero bandwidth for the wavelength at constant incidence angle is
2 2 1 2 4 2 0 0 4 cos B n n d
, (2.12)where
0is the incident angle at Bragg condition. The bandwidth and the reflectivity can be varied independently by varying parameters n1 and d. At a constant wavelength,the zero-to-zero angular bandwidths for normal incidence are
2 n B
, (2.13)and for oblique incidence
0 0 1 2 tan B
. (2.14)17 1 ( ) B B n T n T , (2.15)
where α is the thermal expansion of the glass material. The measured temperature dependences of wavelength change are 23.4 pm/℃at 2479 nm [66] and 10 pm/℃ at 1024 nm [67]. As the nonlinear refractive index of PTR [68] the wavelength change with temperature is not directly proportional to the Bragg wavelength. The temperature tuning capability can be used to thermally control laser wavelength. The VBG thermal tuning capability for a solid-state laser was demonstrated in a Ti:sapphire laser system. [12]
When a thick VBG is used as one of the mirrors of a short Fabry-Perot cavity, the grating’s physical length can be a substantial part of the total cavity length. The effective round trip distance can be calculated from the phase acquired from a reflection of a Bragg grating. The effective cavity length Lcav is deuced to be [13]
1/2 1/2 2 arctanh cav R L d R . (2.16)
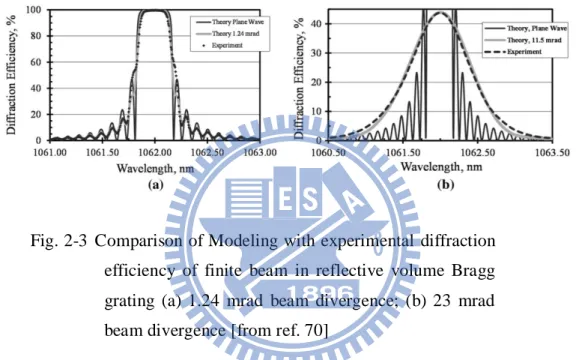
If the incident light is a finite beam with a varying distribution in the transverse direction, the behavior of VBG is different from the plane wave. Reflectivity and spectral bandwidth are dependent on incidence angle and beam waist. Also, the transverse beam profile of a finite incident beam on the grating will be altered in both transmission and reflection, for the different angular components of the incident beam experience different reflectivities. Theory and experiments of finite beams in reflective VBG have been presented in ref. [63] and [69]. In ref. [69], the diffraction efficiency for finite beam incidence was demonstrated and shown in Fig. 2-3. With the finite beam behavior, the VBG can be used as a spatial filter, since higher order transverse modes have a broader angular spectrum. And, adjustingthe beam incident waist can cause the Gaussian mode to be reflected completely, but the higher order
18
ones only partially. Thus the VBG can be used as a mode filter to limit the number of transverse modes in a laser cavity.
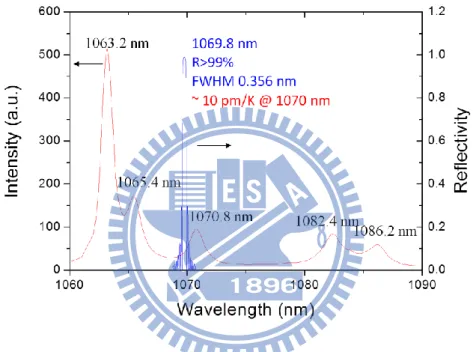
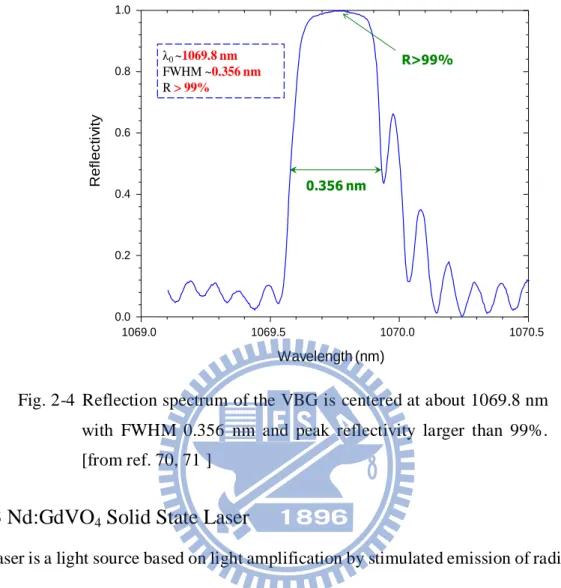
The reflection spectrum of our PTR VBG made from OptiGrate is shown in Fig. 2-4 [from 70]. The peak reflectivity is centered at 1069.8 nm with full width at half maximum (FWHM) about 0.356 nm. The peak reflectivity is larger than 0.99 according to OptiGrate.
Fig. 2-3 Comparison of Modeling with experimental diffraction efficiency of finite beam in reflective volume Bragg grating (a) 1.24 mrad beam divergence; (b) 23 mrad beam divergence [from ref. 70]
19 0.356 nm R>99% λ0 ~1069.8 nm FWHM ~0.356 nm R> 99% 1069.0 1069.5 1070.0 1070.5 0.0 0.2 0.4 0.6 0.8 1.0 Ref le c ti v ity Wavelength (nm)
Fig. 2-4 Reflection spectrum of the VBG is centered at about 1069.8 nm with FWHM 0.356 nm and peak reflectivity larger than 99%. [from ref. 70, 71 ]
2.3 Nd:GdVO
4Solid State Laser
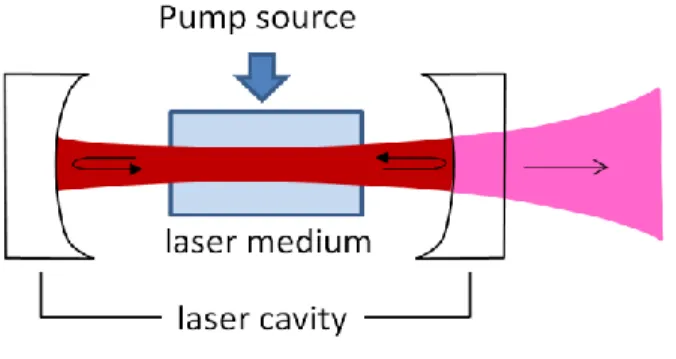
A laser is a light source based on light amplification by stimulated emission of radiation. Every laser system essentially is constructed from three basic components: a gain medium, a pump, and a cavity, shown schematically in Fig. 2-5. A gain medium placed between a pair of optically parallel and highly reflecting mirrors with one of them partially transmitting. An energy source pumps gain medium that has appropriate energy levels, where population inversion is obtained. The cavity provides a resonant amplification via the stimulated emission after the population inversion. The gain media may be solid, liquid, or gas. The basics of the laser theory can be found in photonics textbooks.
20
and the pump source is a laser diode, the so called diode pump solid-state lasers. The laser cavity feedback was constructed by a dielectric mirrors and a spectrally selective volume Bragg grating.
Fig. 2-5 Schematic diagram of a typical laser, showing the three major components: a gain medium, a pump and a resonant cavity by the mirrors.
2.3.1 Laser Gain Mediun Nd:GdVO
4The laser crystal is one of the most important components of a solid-state laser, and it can determine the efficiency of the laser. Nd:GdVO4, which is similar to Nd:YVO4
crystal and Nd:GdVO4 crystal, is an excellent laser crystal for diode pumped laser
used as a four-level laser pumped at 808 nm. It is common lasing at 1064 nm. Nd:GdVO4 have higher optical efficiency than Nd: YAG crystals and better thermal
conductivity and higher power output than Nd: YVO4 crystals, so they are a good
choice for high power output diode pumped solid state laser. Also, Nd:GdVO4 can be
operated at linear polarization. These properties make Nd:GdVO4 a good laser
material for many laser applications. Table 2-1 shows the comparison of Nd-doped solid state materials. Figure 2-6 shows a simplified energy level diagram of the
4
F3/2→4I11/2 manifolds. The close view of 4F3/2→4I11/2 transitions manifold has been
shown in Fig. 1-2. It was acquired by an Agilent 70950B optical spectrum analyzer when the crystal is pumped by an optical power of 2.3 W at 808 nm [70]. Nd:GdVO4
21
has an emission line at about 1070 nm, which was used to generate 535 nm laser by second harmonic generation in this thesis work.
Table 2-1 Comparison of Nd-doped solid state material [96, 97]
Nd:GdVO4 Nd:YVO4 Nd:YAG Crystal Structure Tetragonal Tetragonal Cubic Pump Wavelength 808.5 nm 808.7 nm 807.5 nm Lasing Wavelengths 912.6 nm, 1063.1 nm, 1341.3 nm 914nm, 1064 nm, 1342 nm 1064 nm Thermal Conductivity (W/m/K) 11.7 <110> ∥C: 5.23 ^C: 5.10 14 11 Stimulated Emission Cross-
Section (cm-2 , @1064 nm) 7.60x10 -19 25.0x10 -19 15.6x10⁻¹⁹ 2.8x10 -19 Fluorescent Lifetime ( ms @ 808 nm) 95 90 230
Absorption Coefficient (cm-1 ) 74 (E∥C) 10 (E⊥C) 40 (E∥C)10 (E⊥C)
11 Polarized Laser Emission parallel to optic
axis
parallel to
optic axis Unpolarized Diode Pumped Optical to Optical
Efficiency > 60% > 60%
22
2.3.2 Wavelength Selection
The Nd-doped laser systems are well known for its 1064 nm lasing output wavelength, which belongs to the transition between 4F3/2 and one of the Stark levels of 4I11/2. The
lasing actions between 4F3/2 and other Stark levels within 4I11/2 manifold are strongly
suppressed because of smaller stimulated emission cross sections [72] and close spacing between these Stark levels. Therefore, to achieve 1070.8 nm laser wavelengths of Nd:GdVO4, 1063.2 nm emission has to be suppressed.
Several methods have been commonly used for mode selection and spectral narrowing of a broad band laser toward achieving a single longitudinal mode laser, for example, by introducing an etalon, birefringent plate, surface grating, and (or) prisms in the cavity.The intracavity filters, however, typically induce substantial losses at the desired wavelength to raise the threshold and to lower the slope efficiency. At the same time dispersive elements such as prisms or diffraction gratings necessitates the use of a longer cavity. In most cases multiple selective elements must be used to achieve single frequency laser, and introduce added complexity.
A possible scheme is using a highly spectrally selective cavity mirror. A 1083 nm laser has been achieved and reported using a specially coated dielectric mirror with high reflectivity at 1082.6 nm and lower reflectivity around 1060 nm [10]. However, such a specifically dielectrically coated mirror is impractical for those even closer lines such as 1065 and 1070 nm since these two peaks are too close for coating design and the mirror reflectivity will be too high at 1082.6 nm which makes the 1082.6 nm line dominate in such a system instead of 1070.8 nm.
As a better alternative a highly spectrally selective cavity output coupler can be realized with a new type of robust optical element, a VBG recorded in PTR glass.
23
Owing to its narrow spectral and angular selectivity, VBG offers an advantage of at least 1 order of magnitude in the bandwidth use over a conventional surface diffraction grating. Using a VBG as an end mirror has been demonstrated great reduction of the laser output linewidth from few or few tenth of nm down to few pm or even single mode operation without a decrease in output power [12 , 13 ]. The properties of VBG have been described in Section 2.2.2.
In this thesis, a VBG is used as an output coupler and wavelength selector for obtaining single-frequency-mode generation in an Nd:GdVO4 laser. Changing the
temperature of the VBG can move the central peak and then to tune laser emission central wavelength.
2.3.3 Diode-Pumping of Solid State Laser
Diode pumped solid state (DPSS) lasers are solid state lasers made by pumping a solid gain medium with a laser diode. DPSS lasers are efficient because the diode laser provide direct excitation of the pump beam into the absorption band of the gain medium. And the diode laser itself has an efficient conversion of electric energy to optical energy. Although the beam quality of a laser diode is not good, it is possible to form a single TEM00 operation through the DPSS laser configuration. There are two types of
pumping configuration: side-pumped and end-pumped configurations. In this thesis work, a diode-end-pump solid state laser was developed.
For optimal and efficient pumping, however, requirements have to be considered both spectrally and spatially. The spectral profile of the pump diode should be spectrally overlapped with the absorption line of the gain medium to obtain efficient absorption. And the beam profile of the pump diode should be spatially overlapped with the Gausisian mode of the laser cavity to obtain efficient excitation of only the
24
fundamental transverse cavity mode. A good spatial overlap can be obtained with focusing optics, though the diode laser usually has a divergent beam. The optimal way to do it is that the pump beam is focused to the Gaussian mode size. Besides, twice of Rayleigh length of the focused beam is not longer than the crystal length. Reshaping optics is required for diode lasers which have elliptical beams to obtain a circular spot before the pump beam reach the gain medium.
25
Chapter 3
Single Frequency 1070 nm Nd:GdVO
4Laser Using a
Volume Bragg Grating
3.1 Introduction
3.1.1 Motivation
Single frequency lasers are required in the spectroscopy of thallium atom for testing new physics beyond the standard model, which predicts atomic PNC effect arising from exchange of a Z0-Boson between atomic electrons and nucleons. Atomic thallium (Z =
81) plays an important role in PNC experiments, since the PNC effect grows faster than Z3. The PNC effect has been observed in atomic thallium system using 6P1/2 6P3/2
transition in 1995[3,4]. Laser cooling of thallium atoms, in which a 535 nm laser is needed, can improve the atomic PNC measurement. It is reasonable to obtain a 535 nm laser from a frequency doubled 1070 nm solid state laser.
3.1.2 Laser Material
DPSS lasers with advantages of good stability, narrow linewidth, and good beam quality have been found to be outstanding light sources for spectroscopy. Neodymium-doped gadolinium orthovanadate (Nd:GdVO4) is an ideal laser crystal for
the DPSS lasers due to its high pump absorption coefficient and large thermal conductivity [73, 74]. Most researches involving Nd:GdVO4 crystal focused on the
high power output at wavelength 1064 nm of the main gain peak [75], however, the fluorescence spectrum of a 0.5 at.% Nd:GdVO4 crystal [71], reveals that there are some
weaker emission bands around the main peak. One of the weak emission bands is located at 1070.8 nm which is only 6 nm away from the main peak. As a consequence, a 535 nm light source could be acquired by the second harmonic generation from a
26
1070 nm laser using Nd:GdVO4 crystal. The properties of the Nd:GdVO4 crystal has
been described in Chapter 2.3.1
3.1.3 Laser Narrowing by Volume Bragg Grating
To achieve single frequency operation for DPSS, wavelength selection elements are required. From the fluorescence spectrum of a 0.5% at. Nd:GdVO4 crystal (Fig. 1-2),
the emission cross section at 1070.8 nm is about 20% of that at 1063.2 nm. Therefore, to obtain a 1070 nm laser operation with Nd:GdVO4 crystal, one must suppress the
laser action at 1063.2 nm. A 1083 nm Nd:GdVO4 laser has been demonstrated using a
specially coated dielectric mirror with high reflectivity at 1082.6 nm and lower reflectivity around 1060 nm to suppress the lasing at 1064 nm [10]. However, the 1070 nm band is too close to be separated from the 1064 nm band by a dielectric coated mirror. Other methods for wavelength selection were achieved by inserting an intra-cavity dispersive element, e.g. etalon, which introduces additional loss in the laser resonators resulting in raising the lasing threshold.
VBG offer an alternative approach for wavelength selection and line narrowing for solid state lasers [12]. VBG is a periodic phase grating recorded in PTR glass by thermal development after holographic exposure to UV radiation. PTR glass possesses large transparent range with low loss, high damage threshold, and good thermal stability. PTR VBG has extremely narrow spectral width (below 1 nm), good angular selectivity (below 10 mrad), and high relative diffractive efficiency (above 99.9%). These unique features make VBG ideal for working as intracavity wavelength selectors or resonator couplers in various types of lasers, depending on designed properties. VBG properties have been described in Section 2.2. CW single-longitudinal-mode Nd:GdVO4laser operation has been achieved with a short VBG Fabry-Perot cavity [40]
27
or a monolithic VBG cavity [43]. The monolithic VBG cavity provides over 80 GHz single frequency tuning range. However, the power is limited to 30 mW for single frequency operation by the high intracavity loss (~ 10%). In addition, it is not easy to perform fast frequency modulation which is often needed in laser spectroscopy. Figure 3-1 shows the center wavelength and bandwidth of our VBG and the fluorescence spectrum of the Nd:GdVO4 laser crystal.
Fig. 3-1 Center wavelength and band width (blue) of the VBG used in this laser cavity and fluorescence spectrum (red) of the 0.5% at. Nd:GdVO4 at room temperature
3.2 Experiments and Results
3.2.1 Experimental Setup of the Nd:GdVO
4laser
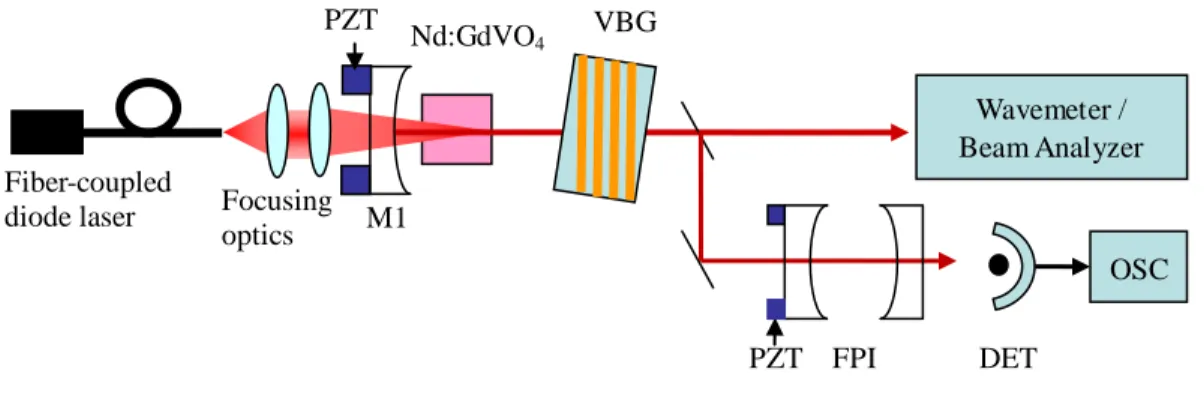
The schematic diagram of the single frequency Nd:GdVO4 laser is shown in Fig. 3-2.
A short plano-concave cavity was employed in our work. An 808-nm fiber-coupled diode laser with a core-diameter of 800 m and a numerical aperture of 0.12 served as
28
the pump source. The pump beam from the fiber end was focused into the laser crystal with a diameter of about 300 m through the focusing optics formed by a pair of lenses. The cavity mirror M1 was a concave mirror with radius of curvature of 300 mm. It had anti-reflection (AR) coating at 808 nm (R < 0.5%) and 1064 nm (R < 0.2%) on the flat face, as well as AR coating at 808 nm (R < 5%) and high-reflection (HR) coating at 1064 nm (R > 99.8%) on the curved face. It was mounted on a PZT for fine tuning the laser cavity length. An a-cut 0.5% at. Nd:GdVO4 crystal with a dimension of 3 × 3 × 4
mm3 was used as the laser gain medium. The crystal was AR coated at 808 nm (R < 2%) and 1064 nm (R < 0.2%) on the side near M1 and AR (R < 0.2%) coated at 1064 nm and 532 nm on the other side. It was wrapped with an indium foil and mounted in a copper heat sink plate without temperature control and placed closely to M1. A PTR VBG (Optigrate Inc.) having peak reflectivity > 99% at center wavelength 1069.8 nm with FWHM of 0.356 nm and dimension of 5 × 5 × 4 mm3 worked as the output coupler of the laser cavity. The VBG was AR coated at 1064 nm on both facets. It was wrapped with an indium foil and mounted in a copper heat sink and its temperature could be controlled at 15 to 60 ℃ by a thermoelectric cooler underneath. The distance between M1 and VBG was 10 mm. The output power was measured by a power meter (Scientech 362) at a distance of 100 mm from the VBG output coupler. The output spectrum was monitored by a home-made scanning confocal Fabry-Perot interferometer (FPI) with free spectral range of 1.5 GHz. An InGaAs detector (Thorlabs DET410) connected to an oscilloscope (Tektronix TDS 2024) was used to detect the spectrum signal after FPI. A wavemeter (Burleigh WA1000) and a beam analyzer (DataRay WinCamD) were used to verify the output wavelength and to monitor the output transverse beam profile respectively.
29
3.2.2 Output Properties of the Single Frequency Nd:GdVO
4Laser
The single frequency operation of this plano-concave cavity laser was achieved by the VBG which acted as an output coupler and a wavelength selector. It should be mentioned that there were four weak beams surrounding the laser output beam. These beams were due to the grating plane in VBG was not parallel to the VBG surface and the reflection of VBG surfaces. They can be used to monitor the single frequency operation with the FPI. The output spectrum (shown in Fig. 3-3) monitored by the FPI indicates that the laser was operated at single frequency. The odd FPI trace was due to discrete sampling of digital oscilloscope. The detail output spectral profile (shown in the inset of Fig. 3-3) of the FPI at output power 200 mW showed a linewdith of 23 MHz which was limited by the instrument resolution of the FPI. The wavelength of the laser output could be tuned by the VBG temperature at a tuning coefficient of ~ 10 pm/K (or ~ 2.6 GHz/K). The vacuum wavelength of the laser was 1070.205 nm (280126.5 GHz) when the VBG was kept at 26℃. From the Fabry-Perot traces the
M1 VBG Nd:GdVO4 Focusing optics Fiber-coupled diode laser OSC PZT FPI DET PZT Wavemeter / Beam Analyzer
Fig. 3-2 Schematic diagram of the single frequency laser. Here, PZT: piezoelectric transducer; FPI: Fabry-Perot Interferometer; DET: detector; OSC: oscilloscope.
30
single frequency tuning range by the PZT tuning was about 5.1 GHz at output power 100 mW. The far-field spatial distribution of the beam at output power 200 mW measured by a beam analyzer is shown in Fig. 3-4. A nearly Gaussian intensity profile with good circularity was observed at a distance 45 cm from the output coupler. The
0 670 1340 2010 2680 3350 0 0.2 0.4 0.6 0.8 1 Position (m) N or m al iz ed Inten si ty ( a.u .)
Fig. 3-4 The far-field intensity distribution of the 1070 nm laser at 200 mW output power. The solid curve is the fitted Gaussian distribution.
Fig. 3-3 Fabry-Perot trace of the single frequency Nd:GdVO4 laser. The inset shows details of the peak. Right inset shows 1070 nm laser spectrum by OSA
31
far field divergence angle of the laser output was around 0.37. To check the beam quality of this laser, we measured the beam radius for the output beam at the 200 mW power level at different distances from a lens with focal length of 100 mm. The measured beam propagation parameter
M
2was 1.16.However, the optimal position of focusing optics depends on the pump power as a result of thermal lens effect of the laser crystal under pumping. We need to fine-tune both the focusing optics position and the VBG angle to acquire a single mode laser with a maximum output power at different pump powers. Figure 3-5 shows the experimental results for the optimal output power for single frequency operation as a function of the pump power. Since the current of 808 nm pump laser could be adjusted by an increment of 1 Amp only, the slope efficiency of 14.5% and threshold pump power of 720 mW were obtained by a linear fitting. A single frequency laser output power of 300 mW had been obtained, limited by the reflectivity of the VBG, and it was difficult to obtain single frequency for higher output power. This fine-tuning procedure makes this laser inappropriate for applications where varying laser power is of prime importance.
Fig. 3-5 1070 nm laser single frequency output power as a function of the incident pump power. The red line is the linear fitting result.
0.5 1.0 1.5 2.0 2.5 3.0 0 50 100 150 200 250 300
Laser Po
wer
(mW)
Pump Power (W)
32
3.2.3 Frequency Stabilization
To demonstrate the application of this laser to spectroscopy, the resonance peak of the FPI cavity was used as a reference for locking the laser frequency. The experimental arrangement is shown in Fig. 3-6. A sinusoidal signal with a modulation frequency of 20 kHz was sent to the input channel 1 of a piezo amplifier (Physik Instrument E663). The PZT attached on one of the FPI cavity mirrors was driven by the output 1 of E663 to dither FPI cavity. To get a proper error signal for frequency locking, the transmitted light after the FPI was demodulated by a lock-in amplifier (Stanford Research SR844). The error signal from the lock-in amplifier was further sent to a PI (proportional and integral) servo controller (Precision Photonics LB1005). The output from LB1005 was amplified by the channel 2 of E663 to drive a piezoelectric actuator attached on the input mirror of the laser cavity for adjusting the cavity length to stabilize the laser frequency.
Fig. 3-6 Schematic diagram of the frequency stabilization setup. Here, VBG: volume Bragg grating; PZT: piezoelectric transducer; FPI: Fabry-Perot Interferometer; DET: detector; OSC: oscilloscope; FG: function generator
33
The first-derivative resonance signal obtained by the lock-in amplifier at 3 sec time constant while scanning the laser frequency is shown in Fig. 3-7(a). This first-derivative signal is proportional to the difference between the laser frequency and the cavity resonance near the resonance center and it was served as the error signal for frequency locking. The error signal was sent to a servo controller and amplified by a piezo controller to stabilize laser frequency. The slope of this frequency discriminator is 0.77 V/MHz. Figure 3-7(b) shows the error signal after the laser frequency was locked, which is proportional to the fluctuation of the laser frequency. From the error signal fluctuation we estimate that the peak-to-peak frequency fluctuation is 7.58 kHz (or 2.5
10-11).
Fig. 3-7 (a) Error signal obtained by scanning laser frequency across the resonance peak. (b) Error signal after laser was locked.
3.3 Laser with Spherical-flat Laser Crystal
A new 1070 nm laser, which is similar to the early version except that that a Nd:GdVO4 laser crystal with a spherical input surface (R= 30 cm, HT at 808 nm, HR at
1070 nm) and a flat end surface (AR at 808 nm and 1070 nm) is adopted to replace the concave cavity mirror and the flat-flat Nd:GdVO4 laser crystal to increase the
-12 -7 -2 3 8 13 0 8 16 24 32 40 48 A m pli tu de (V ) Time (ms) -0.005 -0.003 -0.001 0.001 0.003 0.005 0 0.5 1 1.5 2 V olt ag e (V ) Time (s)
(a)
(b)
5.8 mV (7.58 KHz) 17.6V (23M Hz)34
frequency stability, is shown in Fig. 3-8. Figure 3-9 shows the 3D laser structure. The 1070-nm Nd:GdVO4 laser also used a VBG as the output coupler and the wavelength
selector. The spherical surface of this laser crystal acted as the concave mirror of the plano-concave laser cavity. The laser crystal was mounted on a PZT for cavity length tuning. To reduce the environmental disturbances, the entire laser assembly was put in an aluminum housing whose temperature was stabilized by a thermoelectric cooler. The frequency of the laser can be tuned coarsely by the VBG temperature and finely by the PZT voltage. The VBG is heated to ~45℃ and ∼42.5℃ to generate the correct
Fig. 3-9 3D laser structure
Fig. 3-8 Schematic diagram of the single frequency Nd:GdVO4 laser
VBG Nd:GdVO4 Focusing optics Fiber-coupled diode laser PZT

![Table 2-1 Comparison of Nd-doped solid state material [96, 97]](https://thumb-ap.123doks.com/thumbv2/9libinfo/8344302.176163/34.893.169.732.213.1042/table-comparison-nd-doped-solid-state-material.webp)