國 立 交 通 大 學
生物科技研究所
碩
士
論
文
融合一段 SARS 片段至腫瘤來源的胜肽可提高免疫反應
The Enhancement of Immunogenicity by a SARS Fragment Fusion to
a Tumor-Derived Peptide
研 究 生:高詩涵
指導教授:廖光文博士
融合一段 SARS 片段至腫瘤來源的胜肽可提高免疫反應
The Enhancement of Immunogenicity by a SARS Fragment Fusion to
a Tumor-Derived Peptide
研 究 生:高詩涵 Student:Shih-Han Kao
指導教授:廖光文 Advisor:Kuang-Wen Liao
國 立 交 通 大 學
生 物 科 技 系
碩 士 論 文
A ThesisSubmitted to Institute of Biological Science and Technology College of Biological Science and Technology
National Chiao Tung University in partial Fulfillment of the Requirements
for the Degree of Master
in
Biological Science and Technology July 2006
融合一段 SARS 片段至腫瘤來源的胜肽可提高免疫反應
研究生:高詩涵 指導教授: 廖光文 博士
國立交通大學生物科技研究所
中文摘要
腫瘤細胞會表現低免疫反應之腫瘤相關抗原 (TAA)。一段癌胚抗原 (CEA) 在CT26 腫瘤模式中被用來模擬低免疫反應之腫瘤相關抗原。我們藉由SARS冠狀病毒的片段修 飾之胜肽疫苗提高在Balb/c老鼠動物模式裡的CEA專一療效。並且藉由提高SARS片段上 抗原決定位 (epitope) 與主要組織適應性複合體第一型 (MHC class I) 之結合力來確保 SARS片段之免疫反應效果。利用網路軟體 (http://www.syfpeithi.de/) 分析顯示,突變越 多的抗原決定位表示其與主要組織適應性的結合力越好。這些質體設計分別轉殖入沙門 氏桿菌 (Salmonella typhimurium) 藉以免疫Balb/c老鼠。細胞生理細胞激素測試(in vitro cytokine assay)顯示只帶有CEA的組別只引起介白質IL-4 的分泌,而其他多帶有 SARS片段 的組別,不論有無突變點,都能有效的引起腫瘤壞死因子-α (TNF-α) 及介白質IL-10 的分泌。活體細胞激素測試 (in vivo cytokine assay) 則顯示單獨的CEA不能引起Th1 與Th2 的反應,但多加的SARS片段則可。老鼠在經過免疫後接種腫瘤大小上的表現也以有SARS 片段者來得小,甚者其存活率與無腫瘤率也以SARS組較佳,顯示SARS片段,不論有無 突變,對CT26 有較好的抑制效果。在治療上面,CEA表現無法有效的抑制腫瘤生長,但 SARS則可。 綜合以上結果,低免疫反應之腫瘤相關抗原,如 CEA,是無法在動物模式上面帶 來有效的保護效果,而在我們建立的系統裡,一段普遍的抗原—SARS 片段—則可以加 強原低免疫反應的腫瘤相關抗原的反應,進而提高 DNA 疫苗的效果。此外,我們也建 立了一個平台,可以利用電腦預測的方式提高佐藥疫苗的療效。The Enhancement of Immunogenicity by a SARS Fragment Fusion to
a Tumor-Derived Peptide
Student: Shih-Han Kao Advisor: Dr. Kuang-Wen Liao
Institute of Biological Science and Technology
National Chiao Tung University
ABSTRACT
Tumor cells express tumor-associated antigens (TAAs) that are usually in low immunogenicity. A fragment of carcinoembryonic antigen (CEA) was utilized to simulate the low immunogenous TAA on colon carcinoma, CT26. To enhance the efficiency of our DNA vaccine, it was fused with an exogenous SARS-CoV fragment which is high immunogenous and is expected to induce and enhance the immune response in our animal model, Balb/c mice. The SARS fragment was mutated based on the affinity prediction between the epitope and MHC molecules (H2-Kd) by Internet software (http://www.syfpeithi.de/). The more mutations there are in a construct, the higher the affinity is. These constructs were then transformed into Salmonella typhimurium and orally fed to immunize Balb/c mice. In vitro cytokine profile reveals that CEA alone induces only IL-4 secretion whereas constructs with an additional SARS fragments, whether mutated or not, can significantly induce TNF-αand IL-10 secretion. In vivo cytokine profile shows that CEA alone can not induce any cytokine secretion but an additional SARS fragment fused to CEA can induce both Th1 and Th2 responses. Mice in the protection assay also had smaller tumor volume than those with CEA alone. The efficiency of the CEA-SARS immunization (both non-mutated and mutated) is reflected on their survival rate and tumor-free rate, which are both higher than the CEA alone group. Moreover, the SARS fragment fused with CEA effectively slowed tumor growth in the therapeutic assay. In conclusion, low immunogenous TAAs, such as CEA, can not effectively induce the immune response of animal models. We have set up a system in which the foreign parental or mutated SARS fragments could enhance the anti-tumor efficacy of the tumor vaccine against endogenous tumor antigens. Furthermore, we provide a platform to enhance the adjuvant effect of the foreign peptide by computer prediction.
Acknowledgement
我要感謝許多人,因為有了他們才使得我的論文能夠完成。首先要感謝的是我們實 驗室的大家長—廖光文老師,兩年前他不計我的背景願意收我當他的指導學生,也信任 我可以在這兩年內可以完成實驗和修課內容,因為有了這樣的契機使我得以實現自己的 理想,而每當我實驗遇到困難時,他總是熱心與我討論,謝謝他的指導讓我從什麼都懵 懂無知到開始欣賞科學的嚴謹和邏輯。再來要感謝的是靜宜學姐,總是在實驗實務操作 上給我建議和指導,並且帶著我做了許多實驗;另外還要感謝同組的學弟:侑松和昱丞, 每每為了毒殺實驗必須陪著我早起;源庭要分擔流式細胞儀的分析,其翰很辛苦地打了 無數盤的ELISA,真的很謝謝你們! 另外還要感謝我的同學上知,他陪我去了很多趟鼠房也陪我做了很多實驗,還幫我 們買了便當,以在大家實驗做得焦頭爛額的同時得以溫飽;還要感謝竣元和弘育,在午 夜的時分幫我收膠或收菌。感謝懷堯、韻如、彥谷等學弟妹日常生活中的照顧,為枯燥 不變的生活增添幾分色彩!還要感謝我的實驗老鼠,每次看到他們被犧牲都覺得很不 捨,我希望每一條生命的犧牲都有其代價。 最後還要感謝我的父母,因為有家人的支持和鼓勵,我才能順利地完成學業。感謝 所有曾經幫助過我的朋友,因為有你們的相左,讓我瞭解友誼的真諦。 詩涵 於 2006Contents
中文摘要... 5 ABSTRACT ... 6 ACKNOWLEDGEMENT ... 7 CONTENTS... 8 TABLES ... 12 FIGURES ... 13 ABBREVIATIONS... 15 ABBREVIATIONS... 15 CHAPTER 1 INTRODUCTION... 16 1.1TUMOR ANTIGENS... 161.1.1 TAAs from oncogene mutations or rearrangement... 16
1.1.2 TAAs from mutated tumor-suppressor gene products... 16
1.1.3 TAAs from reactivated embryonic gene products not expressed in adult tissues... 17
1.1.4 TAAs from viral gene products ... 17
1.1.5 TAAs from idiotypic epitopes... 18
1.1.6 TAAs from tissue-specific self antigens expressed by tumors ... 18
1.2MHC TYPES AND ANTIGEN-PRESENTING PATHWAYS... 18
1.2.1 MHC class I molecules and their functions ... 19
1.2.2 MHC class II molecules and their functions ... 19
1.3BINDING AFFINITY AND PRESENTATION STRENGTH... 19
1.3.1 MHC Class I binding of its peptides ... 20
1.3.2 MHC Class I binding affinity and presentation strength... 20
1.3.3 The binding affinity between the MHC-epitope complex and the T cell... 21
1.4TUMOR VACCINES... 21
1.4.1 Tumor-infiltrating lymphocytes (TILs) ... 22
1.4.2 Tumor antigen fusion ... 22
1.4.3 Cytokine fusion... 22
1.4.4 Antigen-presenting cells (APCs) fusion ... 23
1.5VACCINE APPROACHES... 23
1.5.1 Irradiated tumor cells as a vaccine approach... 23
1.5.2 Protein vaccine ... 24
1.5.3 DNA vaccine ... 25
1.6ORAL DNA VACCINE... 26
1.7.1 The concept of design... 27
1.7.2 Strategy ... 28
CHAPTER 2 MATERIALS AND METHODS ... 30
2.1MATERIALS... 30
2.1.1 Primers... 30
2.1.2 Cell lines ... 31
2.1.3 Bacterial strains... 32
2.1.4 Plasmids... 32
2.1.5 Chemicals, Enzymes, and reagents ... 33
2.1.6 Antibodies ... 34 2.1.7 Kits ... 35 2.1.8 Buffers ... 35 2.1.9 Media ... 36 2.1.10 Equipment ... 37 2.2METHODS... 38 2.2.1 Computer prediction ... 38 2.2.2 PCR reaction... 39 2.2.2.1 CEA synthesis ...39 2.2.2.2 SARS synthesis ...39 2.2.2.3 SARS mutation...40 2.2.3 Plasmid construction ... 43
2.2.3.1 Restriction enzyme digestion...43
2.2.3.2 DNA extraction ...43
2.2.3.3 Ligation ...43
2.2.4 Transformation of E. coli ... 44
2.2.4.1 Preparation of competent cells ...44
2.2.4.2 Transformation ...44
2.2.5 Plasmid DNA extraction ... 44
2.2.5.1 Minipreparation...44 2.2.5.2 Midipreparation...45 2.2.6 Cell culture... 46 2.2.6.1 Balb/3T3...46 2.2.6.2 PT67 ...46 2.2.6.3 CT26...46 2.2.6.4 P338D1...46
2.2.7 Transfection of mammalian cells ... 47
2.2.7.1 Seeding cells...47
2.2.8 Infection of mammalian cells ... 48
2.2.9 Dot-blotting... 48
2.2.9.1 Preparation of the CEA antibody...48
2.2.9.2 Confirmation of the CEA antibody...48
2.2.9.3 Dot-blotting ...49
2.2.10 Transformation of Salmonella typhimurium ... 50
2.2.10.1 Preparation of competent cells ...50
2.2.10.2 Transformation ...50
2.2.11 P338D1 incubation with transformed Salmonella typhimurium ... 50
2.2.12 Killing assay ... 51
2.2.12.1 Animal immunization ...51
2.2.12.2 Splenocyte isolation ...51
2.2.12.3 Target cell staining...52
2.2.12.4 The killing assay...52
2.2.13 The cytokine profile assay ... 52
2.2.13.1 The in vitro cytokine assay...52
2.2.13.2 The in vivo cytokine assay ...53
2.2.14 Tumor inoculation ... 54
2.2.14.1 The protection assay ...54
2.2.14.2 Therapy assay ...54
2.2.15 Data analysis ... 54
3.1EPITOPE PREDICTION (CEA-SARS) BY INTERNET SOFTWARE... 55
3.1.1 The epitope score of the CEA-SARS sequence ... 55
3.1.2 Affinity of H2-Kd compared with other epitopes... 55
3.2POINT MUTATION PREDICTION (CEA-SARS) BY INTERNET SOFTWARE... 56
3.3CONSTRUCTION OF PAAV-CEA, PAAV-CEA-SARS, PAAV-CEA-M1, PAAV-CEA-M2, PAAV-CEA-M3 EXPRESSION PLASMIDS... 56
3.4CONSTRUCTION OF PAAV-CEA-B7.1-IVH3H EXPRESSION PLASMID... 58
3.5CONSTRUCTION OF PMSCVNEO-CEA EXPRESSION PLASMID... 59
3.6VERIFICATION OF PLASMID EXPRESSION BY CYTOMETRY... 59
3.7CT26 INFECTION BY RETROVIRUS: SMALL FRAGMENT OF CEA IS SECRETED FROM CT26 ... 60
3.7.1 Transfection of PT67 cell lines with pMSCVneo-CEA expression plasmid ... 60
3.7.2 Infection of CT26 with supernatant of PT67 transfection ... 60
3.7.3 The CEA expression by dot blot ... 61
3.8IN VITRO KILLING ASSAY OF BALB/C SPLENOCYTES... 61
3.8.1 The effect of DIOC18 staining on target cells... 61
3.8.2 The killing assay ... 62
3.9CYTOKINE PROFILE ASSAY... 63
3.9.2 The in vivo cytokine assay... 65
3.10TUMOR GROWTH... 66
3.10.1 The protection assay ... 66
3.10.2 The therapy assay ... 66
CHAPTER 4 DISCUSSION ... 107
REFERENCES ... 113
Tables
TABLE 1.THE EPITOPE SCORES OF THE CEA-SARS SEQUENCE CALCULATED BY THE INTERNET SOFTWARE,
SYFPEITHI... 67
TABLE 2.THE CEA AND CEA-SARS EPITOPES COMPARED WITH OTHER KNOWN EPITOPES THAT HAVE BEEN PROVED TO ELICIT IMMUNITY IN BALB/C MICE.. ... 68
TABLE 3.THE FLOW CHART OF MUTAGENESIS. ... 69
TABLE 4.THE CANDIDATE SEQUENCE OF THE M1 CONSTRUCT. ... 70
Figures
FIGURE 1.THE SCHEME OF CEA AND SARS SYNTHESIS... 39
FIGURE 2.THE SCHEME OF M2, M3 PLASMID CONSTRUCTION... 41
FIGURE 3.THE CONSTRUCT OF PAAV-CEA(WITH A STOP CODON). ... 71
FIGURE 4.RESTRICTION ENZYME DIGESTION OF THE PAAV-CEA CONSTRUCT WITHOUT A STOP CODON. ... 72
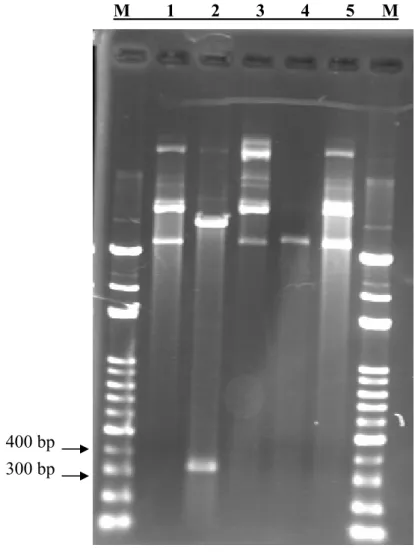
FIGURE 5.RESTRICTION ENZYME DIGESTION OF THE PAAV-CEA-SARS CONSTRUCT... 73
FIGURE 6.RESTRICTION ENZYME DIGESTION OF THE PAAV-CEA-M1 CONSTRUCT... 74
FIGURE 7.RESTRICTION ENZYME DIGESTION OF THE PAAV-CEA-M2 CONSTRUCT... 75
FIGURE 8.RESTRICTION ENZYME DIGESTION OF THE PAAV-CEA-M3 CONSTRUCT... 76
FIGURE 9.THE DIAGRAM OF PAAV-CEA, PAAV-CEA-SARS, PAAV-CEA-M1, PAAV-CEA-M2, AND PAAV-CEA-M3 FOR IMMUNIZATION. ... 77
FIGURE 10.PRIMER ANNEALING OF THE CEA SEQUENCE WITHOUT ITS LEADER SEQUENCE... 78
FIGURE 11.THE CONSTRUCT OF PAAV-CEA-B7.1... 79
FIGURE 12.THE CONSTRUCT OF PAAV-CEA-B7.1-IVH3H... 80
FIGURE 13.THE DIAGRAM OF PAAV-CEA-B7.1-IVH3H FOR CEA ANTIBODY PRODUCTION. ... 81
FIGURE 14.RESTRICTION ENZYME DIGESTION OF PMSCVNEO-CEA. ... 82
FIGURE 15.THE DIAGRAM OF PMSCVNEO-CEA FOR CT26 INFECTION. ... 83
FIGURE 16.THE FLUORESCENCE EXPRESSION OF HRGFP IN P338D1... 84
FIGURE 17.SELECTION OF PT67 TRANSFECTED WITH PMSCVNEO-CEA. ... 85
FIGURE 18.THE G418 RESISTANCE TEST OF CT26... 86
FIGURE 19.INFECTION OF CT26 AT 400 ΜG/ML G418 ON DAY 7... 87
FIGURE 20.THE CEA ANTIBODY IN THE SERA OF BALB/C MICE.BALB/3T3 WAS TRANSFECTED WITH PAAV-CEA-B7.1 AND PAAV-B7.1-IVH3H.. ... 88
FIGURE 21.THE SECRETION OF CEA FROM CT26... 89 FIGURE 22.THE MORTALITY RATE AND SURFACE FLUORESCENCE OF CT26 AFTER OVERNIGHT DIOC18
STAINING. ... 90
FIGURE 23.THE MORTALITY RATE AND SURFACE FLUORESCENCE OF CT26/CEA AFTER OVERNIGHT DIOC18 STAINING.. ... 91
FIGURE 24.THE MORTALITY RATE AND SURFACE FLUORESCENCE OF YAC-1 AFTER OVERNIGHT DIOC18 STAINING.. ... 92
FIGURE 25.THE CT26/CEA KILLING ASSAY... 93
FIGURE 26.THE CT26 KILLING ASSAY... 94
FIGURE 27.CT26/CEA SPECIFIC KILLING AT AN E/T RATIO =25/1... 95
FIGURE 28.THE YAC-1 KILLING ASSAY... 96
FIGURE 29.IN VITRO TNF-ΑEXPRESSION AFTER CT26/CEA SOUP OR CT26 SOUP STIMULATIONS... 97
FIGURE 30.IN VITRO IL-10 EXPRESSION AFTER CT26/CEA SOUP OR CT26 SOUP STIMULATIONS... 98
FIGURE 31.IN VITRO IL-4 EXPRESSION AFTER CT26/CEA SOUP OR CT26 SOUP STIMULATIONS... 99
FIGURE 32.IN VITRO IL-12 EXPRESSION AFTER CT26/CEA SOUP OR CT26 SOUP STIMULATIONS... 100
FIGURE 33.IN VITRO IFN-Γ EXPRESSION AFTER CT26/CEA SOUP OR CT26 SOUP STIMULATIONS.. ... 101
FIGURE 34.IN VIVO CYTOKINE EXPRESSION. ... 102
FIGURE 35.THE TUMOR-FREE RATE OF BALB/C MICE IN THE PROTECTION ASSAY... 103
FIGURE 36.THE TUMOR VOLUME OF BALB/C MICE IN THE PROTECTION ASSAY. ... 104
FIGURE 37.THE SURVIVAL RATE OF BALB/C MICE IN THE PROTECTION ASSAY... 105
Abbreviations
APCs antigen-presenting
cells
CEA carcinoembryonic
antigen
CTLs Cytotoxic
T
lymphocytes
DCs dendritic
cells
DIOC18
3,3’-dioctadecyloxacarbocyanine
DMEM
Dulbecoo′s modified eagle medium
Th cells
Helper T cells
IFN-γ interferon-γ
IL-10 interleukin-10
IL-12 interleukin-12
IL-2 interleukin-2
IL-4 interleukin-4
IL-5 interleukin-5
kDa killoDalton
MHC
major histocompatibility complex
NK cells
natural killer cells
PBS
phosphate buffer saline
PI propidium
iodide
SARS-CoV severe acute respiratory syndrom
coronavirus
TAA tumor-associated
antigen
Chapter 1
Introduction
1.1 Tumor antigens
The immune system surveys the body for abnormal antigens or cells not only of infectious microorganisms but also of tumor. It has been observed that tumor expresses tumor associated antigens (TAAs) that can be recognized and serve as the target for immune cells such as cytotoxic T cells (Boon, Cerottini et al. 1994; Pardoll 1994). Six categories of TAAs can be defined due to the different mechanisms that result in the generation of TAAs and described in the following sections.
1.1.1 TAAs from oncogene mutations or rearrangement
These antigens are the result of point mutations or gene rearrangements, which often arise as part of the process of oncogenesis. For example, the transforming allele of the Ki-ras2 gene present in the human colon carcinoma cell line SW480 differs from its normal counterpart only at the amino acid at position 12. The normal cDNA encodes a glycine at this position, and the transforming allele encodes a valine. Expression of these cDNAs indicates that this amino acid 12 alteration confers oncogenic activity on the mutated gene (McCoy, Bargmann et al. 1984). Chronic myelogenous leukemia (CML) is a human disease associated with a consistent chromosomal translocation that results in sequences from the c-abl locus on chromosome 9 being fused to sequences in a breakpoint cluster region (bcr) on chromosome 22 (Ben-Neriah, Daley et al. 1986).
1.1.2 TAAs from mutated tumor-suppressor gene products
Normal cells contain repressors whose loss result in uncontrolled growth (King 2000). The p53 gene, for instance, which produces the p53 repressor protein, is the gene most
frequently altered in human cancers (King 2000). The p53 gene is frequently mutated or inactivated in all types of human lung cancer. The genetic abnormalities of p53 include gross changes such as homozygous deletions and abnormally sized messenger RNAs along with a variety of point or small mutations, which map to the p53 open reading frame and change the amino acid sequence in a region highly conserved between mouse and human (Takahashi, Nau et al. 1989).
1.1.3 TAAs from reactivated embryonic gene products not expressed in adult
tissues
Some TAAs, which are the embryonic gene products, are somehow turned on in tumors. For instance, MAGE-1 and MAGE-3 are two clinically relevant antigens expressed in many human melanomas and other tumors, but not in normal tissues, except testis (Bueler and Mulligan 1996). Alpha-fetoprotein is another example whose mRNA levels increase in hepatocellular carcinoma (HCC) cells as compared with non-neoplastic tissues (Matsumura, Ijichi et al. 2001).
1.1.4 TAAs from viral gene products
Some viruses can provide an oncogene which codes for a functional product, as in the case of Rous sarcoma virus. The oncogene v-src codes for a 60 kDa phosphoprotein (pp60src) that has tyrosine kinase activity (King 2000). Other viruses may insert a part of the sequence into a host’s genome. For example, the regulatory sequences repeated at each end of the viral genome of mouse mammary tumor virus (MMTV) enhance the transcription of the nearby genes (King 2000). Still others can act directly by virtue of their v-onc protein product binding to and inactivating host proteins, such as human papilloma virus. Inactivation of tumor suppressors, Rb and p53, by viral E7 and E6 proteins is required for cervical cancer (King 2000).
1.1.5 TAAs from idiotypic epitopes
Some of the TAAs are specifically expressed on tumors but not on normal cells, including idiotypic epitopes. One of the best characterized idiotypic epitopes is the idiotypic immunoglobulin (Id) of B-cell lymphoma. The Id is determined by the rearrangements of the variable heavy (VH) and light (VL) chains of the immunoglobulin V regions that are unique for each clonal B-cell population and represent tumor-specific antigens (Muraro, Bondanza et al. 2005).
1.1.6 TAAs from tissue-specific self antigens expressed by tumors
The tissue-specific self antigens are specifically expressed on tumors but not on normal cells as well. They can be exemplified by carcinoembryonic antigen (CEA), which is a membrane-anchored glycoprotein expressed on the great majority of colorectal, gastric, and pancreatic carcinomas as well as 50% of breast cancers and 70% of non-small cell lung cancers (Thompson, Grunert et al. 1991). Another example of self antigens is the tyrosinase of melanoma, which is responsible for the synthesis of melanin in the epidermis via oxidation of tyrosine (Halaban, Pomerantz et al. 1983). Melanin biosynthesis (melanogenesis) is a metabolic pathway exclusively expressed by melanocytes and melanoma cells, and is often altered and/or markedly elevated in the latter cells (Salopek and Jimbow 1996). Therefore, tyrosinase is overexpressed by melanoma and serves as a self antigen for clinical detection (Kounalakis and Goydos 2005).
1.2 MHC types and antigen-presenting pathways
Tumor antigens, whether endogenous or exogenous, are all presented by the major histocompatibility complex (MHC) molecules to different T cells. There are mainly two types
of MHC molecules, MHC class I and MHC class II, each of which functions in different ways.
1.2.1 MHC class I molecules and their functions
MHC class I molecules, expressed on the surface of the all cell types except for red blood cells (RBCs), present peptides derived from endogenous antigens to CD8+ cytolytic T lymphocytes (CTL). Degraded by proteasomes, these peptides bind to MHC class I molecules in the lumen of the endoplasmic reticulum via the transporters associated with antigen processing-1 and -2 (TAP1 and TAP2). The presentation of peptides by the MHC class I molecules initiate the activation of CTL, which is one of the effector cells in antitumor immunity.
1.2.2 MHC class II molecules and their functions
MHC class II molecules, expressed on the antigen-presenting cells (APCs), such as B cells, dendritic cells, and macrophages, present peptides derived from exogenous antigens to CD4+ helper T (Th) cells. These tumor antigens are released from tumor cells, taken up and processed into peptides by APCs, then displayed on MHC class II molecules. The recognition by Th cells releases cytokines, such as IL-2, to promote the activation of CTLs (Li, Zhang et al. 2006).
1.3 Binding affinity and presentation strength
When molecules interact, binding affinity accounts for the strength between them. In the case of the MHC molecule presentation to T cells, there are two kinds of binding affinity that need to be considered to activate the T cell response, namely the binding affinity between the epitope and the MHC molecule and that between the MHC-epitope complex and the T-cell
receptor (TCR) of a T cell.
1.3.1 MHC Class I binding of its peptides
Because tumor antigens are mostly recognized by the CD8+ T cells, it is of importance to introduce the binding between the peptide and the MHC class I molecule.
The binding of a peptide in the peptide-binding cleft of an MHC class I molecule is stabilized at both ends by contacts between atoms in the specific residues of the peptide and invariant sites that are found at each end of the cleft of all MHC class I molecules through a series of hydrogen bonds and ionic interactions. Peptides that bind to MHC class I molecules are usually 8-10 amino acids long. The peptides that can bind to a given MHC variant have the same or very similar amino acid residues at two or three particular positions along the peptide sequence. Theside chains of the amino acids at these positions insert into pockets in the MHC molecule that are lined by the polymorphic amino acids. Because the binding of these side chains anchors the peptide to the MHC molecule, the peptide residues involved have been called anchor residues, which are usually hydrophobic at the carboxyl terminus. In some cases, particular amino acids are preferred in certain positions, whereas in others the presence of particular amino acids prevents binding (Janeway 2005).
1.3.2 MHC Class I binding affinity and presentation strength
Although some tumor antigens can elicit the T-cell response, most of the endogenous T cell responses are weak. This is because the affinity between the peptide antigen and its presenting MHC molecule is generally weak (Cox, Skipper et al. 1994). Such antigens are often characterized by an absence of favored residues at critical anchor positions involved in MHC binding. For weak tumor antigens that fall into the low-affinity MHC binding category, replacement or mutation of unfavorable anchor residues with more effective ones may greatly enhance MHC binding properties (Lurquin, Van Pel et al. 1989; Gervois, Guilloux et al. 1996;
Parkhurst, Salgaller et al. 1996; Bakker, van der Burg et al. 1997). These altered peptides may more effectively activate T cell responses against the wild-type peptide antigen by virtue of the increased efficiency of presentation of the MHC-peptide complex to specific T cells. In both mouse and human studies, these anchor-modified peptides can elicit superior T cell responses against the original antigen in vivo (Dyall, Bowne et al. 1998; Rosenberg, Yang et al. 1998).
1.3.3 The binding affinity between the MHC-epitope complex and the T cell
Some antigens bind to their presenting MHC with affinities in a similar range to the viral antigens yet elicit weak endogenous immune responses (Lee, Yee et al. 1999). For tumor antigens with high MHC affinities, the proposed mechanism for weak endogenous immune responses is that high-affinity T cells are actively tolerated via anergy or deletion, thereby leaving a functional repertoire consisting of T cells bearing T cell receptors (TCR) with low affinity for MHC-peptide complexes. This residual T cell repertoire is postulated to have escaped active tolerance induction by virtue of its low affinity for MHC-peptide ligand. This mechanism is particularly relevant for shared tumor antigens, which, because they are self-antigens, have had a long period of time to induce tolerance (Morgan, Kreuwel et al. 1998).The low binding affinity between the MHC-epitope complex and the TCR can be elevated by amino acid substitution. Slansky et al indicated in their research that the improved immunity results from enhanced in vivo expansion of T cells specific for natural tumor epitopes (Slansky, Rattis et al. 2000).
1.4 Tumor vaccines
strategies have been developed to utilize TAAs for tumor vaccines (Rosenberg 1996; Chen and Wu 1998; Timmerman and Levy 1999). Some of the most important tumor vaccines will be discussed below.
1.4.1 Tumor-infiltrating lymphocytes (TILs)
The earliest discovery of tumor-infiltrating lymphocytes has suggested the involvement of immune cells in the suppression of tumor growth. Studies in animal tumor models have indicated that progressively growing tumors contain weak or nonreactive tumor lymphocytes but that regressing tumors have highly reactive lymphocytes (Gillespie and Russell 1978). In the study by Wang and Rosenberg, the adoptive transfer of cytotoxic T lymphocytes (CTLs) derived from tumor-infiltrating lymphocytes (TIL) along with interleukin-2 (IL-2) into autologous patients with cancer resulted in the objective regression of tumor, indicating that these CTLs recognized cancer rejection antigens on tumor cells (Wang and Rosenberg 1996).
1.4.2 Tumor antigen fusion
Fused tumor antigens have been constructed to elicit antitumor effect. A recent research has indicated that mucin 1 (MUC1), a TAA for epithelial carcinoma, when fused with heat shock protein complexes (HSP65) isolated from tumors, can induce specific and nonspecific antitumor immunity. HSP65-MUC1 induces growth inhibition of
MUC1-expressing tumors and increases survival of the tumor-bearing mice by activating
MUC1-specific CTL and enhancing IFN-γ secretion (Li, Li et al. 2006).
1.4.3 Cytokine fusion
Other researchers enhance the immunity by cytokines that have been well-known for their proinflammatory or T-cell mediated responses. For example, the human IL-2 has been fused with human MUC1, which is over-expressed and aberrantly glycosylated in most breast
tumors. The patients vaccinated intramuscularly with a single dose of the recombinant vaccinia virus resulted in no significant clinical adverse effects. None of the nine patients had a significant increase in MUC1-specific antibody titers after one single injection (Scholl, Balloul et al. 2000).
1.4.4 Antigen-presenting cells (APCs) fusion
APCs can prime naïve T cells and initiate a prime immune response (Steinman 1991; Banchereau and Steinman 1998). Among all, dendritic cells (DCs) are one of the most utilized APCs to induce a T-cell response. Various DC-based strategies, such as DCs pulsed with tumor-associated peptides or proteins, viral transduction of DCs with tumor-specific genes or transfection with liposomal DNA or RNA, have been developed to introduce tumor specific antigens into DCs and thereby to generate cytotoxic T lymphocyte (CTL) responses against malignant cells (Boczkowski, Nair et al. 1996; Condon, Watkins et al. 1996; Gong, Chen et al. 1997; Ribas, Butterfield et al. 1997; Song, Lee et al. 1997; Song, Kong et al. 1997; Specht, Wang et al. 1997). Xu et al. has generated the fusion between human cancer SW480 cells and DCs to elicit interferon-γ secretion against colon cancer (Xu, Ye et al. 2004).
1.5 Vaccine approaches
Approaches to deliver tumor vaccines can vary, but they can be categorized into two main groups by their molecular components, protein injection and DNA vaccine. The previous group is later subcategorized into two subgroups. One utilizes dead tumor cells as a vaccine approach, and the other utilizes TAAs or any other protective molecules in the form of functional proteins.
Irradiated tumor cells were once injected into animal models (Mazurek and Duplan 1959; Shibata, Jerry et al. 1976). However, such an approach may only exert a limited effect. Therefore, they have been engineered later with other molecules to exert a synergistic effect on tumors. For example, in a more recent study, Jain et al. transduced irradiated CT26 cells with granulocyte-macrophage colony-stimulating factor to enhance the efficacy of their tumor vaccine. Along with the help of systemic injection of IL-2, 88% of the treated mice were tumor free on day 21 (Jain, Slansky et al. 2003). Besides, irradiated tumor cells can be incubated with DCs and uptaken by them as a vaccine approach. Such pulsed DCs have been proved to elicit the immune response successfully. The specific T cell responses were observed. In vitro studies showed that fusions effectively activated CD8+ T lymphocytes to secrete IFN-γ (Xu, Ye et al. 2004).
1.5.2 Protein vaccine
Vaccines can be in the form of proteins. Cytokines, such as IL-2, have been injected intratumorally with TILs in a breast cancer model. In the study of Liu DL et al., such an immunotherapy with rIL-2 and TILs were given to Wistar rats with breast cancer. The total response rate was 42%, of which 25% tumors showed partial regression and 17% tumors reached complete remission where infiltration of plenty of T lymphocytes was detected, indicating that T cell-mediated antitumor immunity is primarily responsible for tumor rejection. (Liu, Yang et al. 1996).
Pulsed APCs can be injected into animals to elicit immune responses against tumors. For instance, DCs can be pulsed with an antigenic peptide or tumor lysate to induce specific CTLs against tumors. In the study of Waeckerle-Men et al, autologous DCs were pulsed with multiple T cell epitopes derived from four different prostate-specific antigens in patients with advanced hormone-refractory prostate cancer. The vaccination elicited significant cytotoxic T cell responses against all prostate-specific antigens tested. In addition, memory T cell
responses against the control peptides derived from influenza matrix protein and tetanus toxoid were efficiently boosted (Waeckerle-Men, Uetz-von Allmen et al. 2006).
1.5.3 DNA vaccine
DNA vaccine, which is to construct the desired DNA segment in a vector to elicit immunity, is another approach for vaccine delivery. The desired DNA segment can be a TAA, cytokine, or the combination of both in the form of DNA sequence. For instance, neu is an oncogene for breast cancer. Chen et al generated DNA expression vectors encoding the full-length neu cDNA (designated pNeuN), the neu extracellular domain (pNeuE), and the neu extracellular and transmembrane domains (pNeuTM). The intramuscular injection of pNeuTM or pNeuE, and to a lesser extent pNeuN, induced protective immunity against a subsequent challenge with Tgl-1 cells, a neu-expressing tumor cell line, in FVB/N mice (Chen, Hu et al. 1998).
Cytokine can be delivered into animals in the form of DNA instead of protein. In the study of Schultz J et al., the intramuscular injection of plasmid DNA coding for IL-12 abolished the establishment of pulmonary metastases of B16F10 melanoma cells in a syngeneic mouse model. Moreover, it also resulted in a pronounced reduction of tumor growth in C57/BL6 mice. This antitumor effect correlated with a long-lasting expression of cytokines, which manifested itself as high levels of IL-12 in the serum 12 days after DNA treatment (Schultz, Pavlovic et al. 2000).
However, TAA alone or cytokines cannot always induce enough immunity against tumor. Combined therapy has been adopted in some of the therapeutic approaches. Marshall et al. tested a prostate-specific antigen (PSA) DNA vaccine along with the co-administration of pIL-18 plasmid in a mouse tumor model. Complete tumor protection mediated by both CD4+ and CD8+ T cells was observed in all mice. Analysis of the immune response in mice immunized with either pPSA or pPSA/pIL-18 demonstrated that pIL-18 skewed the
PSA-specific immune response toward Th1. More importantly, stronger CD4+ and CD8+ T cell responses developed in the pPSA/pIL-18-immunized mice with faster kinetics (Marshall, Rudnick et al. 2006).
1.6 Oral DNA vaccine
DNA vaccine, though usually injected intramuscularly, can be administered into the animal model orally by bacteria. It has been observed that some of them display preferential replication or preferential accumulation in the tumor microenvironment (Sznol, Lin et al. 2000). In contrast to viruses, the bacteria reside primarily in the extracellular tumor microenvironment and possess certain features that may be advantageous in the treatment of cancer (Kops 1997). Moreover, because of their large genome size, bacteria can readily express multiple therapeutic transgenes, such as cytokines or pro–drug-converting enzymes, and their spread can be controlled with antibiotics if necessary (Sznol, Lin et al. 2000).
Among all, Salmonella typhimurium has been one of the most utilized bacteria to carry therapeutic transgenes. In 1997, Pawelek et al. reported that Salmonella would infect and preferentially accumulate within implanted tumors in mice, achieving tumor/normal tissue ratios of approximately 1,000:1 (Pawelek, Low et al. 1997). However, wild-type Salmonella contains certain virulence and toxicity that when administered systemically, it may threaten the safety of the host (Clairmont, Lee et al. 2000). Therefore, to develop a clinical candidate with a high safety profile, a wild-type strain of Salmonella typhimurium was attenuated by partial deletion of the msbB gene, whose product is responsible for addition of a terminal myristic acid group in the formation of lipid A (Somerville, Cassiano et al. 1999). Lipopolysaccharide derived from these lipid A mutants is markedly diminished in ability to induce TNF- in vitro in human monocytes and in vivo after administration to mice and pigs (Low, Ittensohn et al. 1999). As an additional safeguard, deletion of the purI gene
(requirement for an external source of purine, e.g., adenine) was engineered into the msbB–
Salmonella strain as a second attenuating mutation (Low K 1999; Low, Ittensohn et al. 1999;
Luo X 1999). The gene modifications do not affect the ability to achieve high tumor/normal tissue ratios in mouse models, and the bacteria maintained their capacity to inhibit the growth of both subcutaneous tumors and lung metastatic diseases (Sznol, Lin et al. 2000).
Other modifications have been reported. For example, the strain used in this study is the attenuated aromatic acid-dependent (aro) Salmonella typhimurium, which has been well characterized as carriers for various heterogeneous antigens (Dougan G. 1986; Fagan, Djordjevic et al. 1997). These vaccine strains are capable of colonizing the gut-associated lymphoid tissues (Peyer’s patches) and secondary lymphatic tissues including spleen and liver following oral administration in mice, to elicit mucosal, humoral and cell-mediated immune responses (Hormaeche CE 1995)
1.7 Strategy
1.7.1 The concept of design
Tumor-associated antigens have some disadvantages. First of all, they are usually in low immunogenicity due to their low binding to the MHC class I molecule (Cox, Skipper et al. 1994). Second, they can be toxic or tumorigenic themselves if not properly handled. For example, the E6 and E7 proteins of the HPV bind p53 and Rb, respectively and inactivate them (King 2000). As a result, a full-length TAA is not a practical approach for a therapeutic target. In contrast, a peptide, if used in the vaccine, can reduce the toxicity or tumorigenicity of the TAA. Yet, peptides are supposedly to be less immunogenous because they generate fewer epitopes than an antigen after proteasome degradation. Therefore, an exogenous peptide that is immunogenous is considered in our strategy to enhance the immunity of our animal model.
Viruses are a suitable source of exogenous peptides. Many viruses can elicit strong immunity in humans. For example, severe acute respiratory syndrome coronavirus (SARS coronavirus) has been proved to elicit a cytokine storm, in which IFN-γ, IL-18, TGF-β, IL-6, etc., are elevated significantly (Wong, Lam et al. 2004; Zhang, Li et al. 2004; Huang, Su et al. 2005). However, the immune response should not exceed the threshold, beyond which viral infection will cause great damage to the host. To solve this problem, a fully replicable virus can not be utilized in the experiment.
1.7.2 Strategy
Here, the construction of a fragment of the SARS coronavirus (SARS-CoV) was preceded by a low immunogenous peptide, carcinoembryonic antigen (CEA) on a vector. The selected SARS fragment has been verified to effectively elicit IFN-γ secretion in human (Xu, Ye et al. 2004). The most possible epitope for Balb/c mice within this SARS peptide was calculated by the SYFPEITHI (http://www.syfpeithi.de/), which is an affinity-predicting website between the MHC molecule and the epitope presented. The higher the score is, the better the affinity predicted by the computer is.
The epitope that has the highest score is modified by point mutation to yield an epitope with even a higher score (m1). Subsequently, the amino acids of this m1 epitope is further mutated by SYFPEITHI to obtain a much higher score sequence (m2). Finally, a third epitope that has another cumulative point mutation is calculated by the SYFPEITHI (m3), which has the highest score among all.
Each plasmid was designed to transform Salmonella typhimurium to generate an immune response within tumor. The genetically engineered Salmonella may stimulate and activate naïve T cells. After immunization with Salmonella transformed with pAAV-CEA, pAAV-CEA-SARS, pAAV-CEA-m1, pAAV-CEA-m2, and pAAV-CEA-m3, respectively,
CT26 cells producing the peptide CEA (CT26/CEA) were inoculated into mice and tumor sizes were measured. In addition, the immune responses, such as cytotoxic activities and cytokine releases of splenocytes, were analyzed. These results showed that the peptide derived from the SARS virus and fused with the low immunogenous tumor antigen can strengthen the immune activities of the host against tumor cells with CEA peptide production.
Chapter 2
Materials and Methods
2.1 Materials
2.1.1 Primers
Gene Primer
Sequence
(5’Æ3’) Tm
( )
℃
P1
TAC GGA ATT CAT GGA GTC TCC CTC GGC CCC TCC CCA CAG ATG GTG CAT CC
71.6
P2 CCT GGC AGA GGC TCC TGC TCA CAG
GTG AAG GGA GGA CAA C 71.5
P3 CTG GGA GAG GGT GGG AGG AGG
GAG CTG GGG TCT CCT GGG T 75.1
P4 CTC CTC CCA CCC TCT CCC AGG TTG
TCC TCC CTT CAC CTG T 71.8
P5 GAG CAG GAG CCT CTG CCA GGG
GAT GCA CCA TCT GTG GGG A 73.7
P6 GCT ATC TAG ATC ACA GCC CTG TCC
TAC CCA GGA GAC CCC AGC TCC 71.1
CEA
P7 GCT ATC TAG ACA GCC CTG TCC TAC
CCA GGA GAC CCC AGC TCC 71.0
P1
TAC GTC TAG AAA AGT CGA GGC GGA GGT ACA AAT TGA CAG GTT AAT TAC A
65.7
P2 GGC AGA CTT CAA AGC CTT CAA ACC
TAT GTA ACA CAA CAA C 63.9
P3 TAA TCA GGA TTA AAT GGC CTT GGT
ATG TTT GGC TCG GCT T 65.3
P4 CAT TGC TGG ACT AAT TGC CAT CGT
CAT GGT TAC AAT CTT G 63.7
P5 GCT AAA GCT TTT AAG TCA TGC AAC
AAA GCA AGA TTG TAA CCA TGA CGA 64.1
P6 TGG CAA TTA GTC CAG CAA TGA AGC
CGA GCC AAA CAT ACC A 67.7
SARS
TTG TGT TAC ATA GGT T
P8 TGA AGG CTT TGA AGT CTG CCT GTA
ATT AAC CTG TCA ATT T 63.2
5’ GTC GAC GCT GAC TTC TCT ACC CCC
AA 72.2
B7.1
3’ AAG CTT AAG GAA GAC GGT CTG TTC
AGC 71.9
5’
CTA GTG GTG AAG GGA GGA CAA CCT GGG AGA GGG TGG GAG GAG GGA GCT GGG GTC TCC TGG GTAGGA CAG GGC TGG 75.3 CEA w/o leader 3’
TCG ACC AGC CCT GTC CTA CCC AGG AGA CCC CAG CTC CCT CCT CCC ACC CTC TCC CAG GTT GTC CTC CCT TCA CCT
76.5
5’ TGG CTC GGC TTC ATT ATT GGA 56.6
SARS m1
3’ TCC AAT AAT GAA GCC GAG CCA 56.6
5’ TGG CTC GGC ACC ATT ATT GGA 59.2
SARS m2
3’ TCC AAT AAT GGT GCC GAG CCA 59.2
5’ TGG CCT TGG TAT GTT CCA CTC 57.1
SARS m3
3’ GAG TGG AAC ATA CCA AGG CCA 57.1
5’
AGC TTT GCC CAA AGT ACG TGA AGC AAA ACA CAC TTA AAC TGG CTA CCG GAA TGA GAA ACG TGC CAG AAA AGC AAA CAT AAC
70.9
IVH3H
3’
TCG AGT TAT GTT TGC TTT TCT GGC ACG TTT CTC ATT CCG GTA GCC AGT TTA AGT GTG TTT TGC TTC ACG TAC TTT GGG CAA
71.3
β-globin
intron 5’ ACA GCT CCT GGG CAA CG 58.3
hGH poly(A) 3’ AAG GCT GGT GGG CAC TGG 61.0
2.1.2 Cell lines
PT67 (mouse retrovirus-packaging cell line, ATCC: CRL-12284) Balb/3T3 (mouse embryo fibroblast, ATCC: CCL-163.2)
P338D1 (mouse lymphoblast, ATCC: TIB-39)
2.1.3 Bacterial strains
Escherichia coli Top10 strain: for general cloning (Invitrogen)
Escherichia coli DH5α™-T1: for site-directed mutagenesis (Invitrogen)
Salmonella typhimurium SL3261 strain: for plasmid uptake (kindly provided by Dr. Wu,
Chang-Jer)
2.1.4 Plasmids
plasmid Description
Source
pAAV-MCS pCMV promoter for MCS Stratagene
pAAV-CEA EcoRI-XbaI fragment,
containing the CEA fragment
This study pAAV-CEA-SARS EcoRI-HindIII fragment,
containing the CEA-SARS fragment
This study
pAAV-CEA-m1 Modified pAAV-CEA-SARS,
with one mutation site
This study
pAAV-CEA-m2 Modified pAAV-CEA-SARS,
with two mutation sites
This study
pAAV-CEA-m3 Modified pAAV-CEA-SARS,
with three mutation sites
This study pAAV-B7.1 Modified pAAV, with a B7.1
fragment
Liao’s lab pAAV-CEA-B7.1-IVH3H EcoRI-XhoI fragment,
containing the
CEA-B7.1-IVH3H fragment
This study
pMSCVneo neomycin resistant and containing 5’ LTR and a viral packaging signal
BD
pMSCVneo-CEA EcoRI-XhoI fragment,
containing the CEA fragment
2.1.5 Chemicals, Enzymes, and reagents
Chemical Source
Catalog
number
Application
100bp DNA ladder Protech M1-100T DNA
electrophoresis
1kb DNA ladder Protech M1-1KB DNA
electrophoresis 3,3’-dioctadecyloxacarbocyanine
(DIOC18)
SIGMA D-4292 Cell staining
Agarose MDBio 929049 DNA
electrophoresis
Ampicillin AMRESCO 0339 Bacterial culture
DMSO MP 196055 Buffer
EDTA Tedia ER-0531 Cell passage
EtBr AMRESCO 3434B14 DNA staining
Ethanol SIGMA E7023 DNA extraction
Fetal Bovine Serum Biological industries
04-001-1A Cell culture
HCl Scharlau AC0741 Buffer
Incomplete Freund’s adjuvant SIGMA F-5506 Immunization
Isopropanol C-Echo PH-3101 DNA extraction
Kanamycin MDBio 226039 Antibiotics
LB agar AMRESCO J637 Bacterial culture
LB broth Scharlau 02-385 Bacterial culture
MEM GIBCO 41500-034 Cell culture medium
NaCl AMRESCO 0241 Buffer
NaHCO3 MP 194847 Additional
ingredient to cell culture medium
NaOH Showa 1943-0150 Buffer
Pfu polymerase MDBio 826049 PCR
Propium iodide (PI) SIGMA P4170 Cell live/dead
staining PSA Biological
Industries
03-033-1B Cell culture
RPMI GIBCO 31800-022 Cell culture
medium
Taq polymerase BioKit Bio Taq PCR
Taq DNA polymerase XL Protech P6a PCR
Trypan blue stain GIBCO 0759 Cell staining
Trypsin GIBCO 27250-018 Cell passage
Tween 20 MP 194724 ELISA
2.1.6 Antibodies
Antibodies Source
Catalog
number
Goat anti-mouse B7.1 R&D AF740
Goat anti-mouse HRP SIGMA A0412
Mouse anti-mouse CEA This study N/A
2.1.7 Kits
Kit Source
Catalog
number
Application
Gene-SpinTM 1-4-3 DNA extraction kit
Protech PT-DNA143XL-V2 DNA extraction,
clean-up Gene-SpinTM Miniprep
Purification Kit
Protech PT-MP530XLO-V2 DNA extraction
Gene TailorTM
Site-Direted
Mutagenesis System
Invitrogen 12397-014 DNA site-directed
mutagenesis
NucleoBond PC100 Macherey-Nagel 740573 DNA extraction
Mouse IL-2 DuoSet DY402 ELISA
Mouse IL-4 DuoSet DY404 ELISA
Mouse IL-10 DuoSet DY417 ELISA
Mouse IL-12 p70 DuoSet DY419 ELISA
Mouse IFN-γ DuoSet DY485 ELISA
Mouse TNF-α DuoSet DY410 ELISA
Mouse Th1/Th2 Cytokine
BD 551287 Cytometric bead
array SuperSignal West Pico
Chemiluminescent Substrate
PIERCE 34080 Dot blot
z 1X ACK lysis buffer
0.15 M NH4Cl, 1.0 mM KHCO3, 0.1 mM Na2EDTA in dd H2O
z 1X PBS (pH7.4)
137 mM NaCl, 10 mM Na2HPO4, 2.7 mM KCl, 1.8 mM KH2PO4
z 2% Blocking buffer
1g nonfat powdered milk dissolved in 50ml 1X PBS buffer z 50X TAE buffer
48.4 g Tris base, 0.5 M EDTA (pH8.0) 20 ml, 11.42 ml acetic acid. dd H2O was added to
200 ml. z EDTA-trysin
2.5g trypsin, 0.1 M EDTA (pH8.0) in 1L 1X PBS, pH7.4, 0.2 μm filtered z Reagent Diluent
1% BSA in PBS, pH7.2-7.4, 0.2 μm filtered z Staining buffer
1% BSA, 0.05%NaN3 in 1x PBS
z Stop solution (for ELISA) 1 N HCl z PBST 0.5% Tween 20 in 1x PBS z Versene 0.2g EDTA in 1L 1X PBS z Wash buffer 0.05% Tween 20 in PBS, pH7.2-7.4
2.1.9 Media
z LB (Luria-Bertani) broth1% tryptone, 0.5% yeast extract, 1% NaCl z LB (Luria-Bertani)/Ampicillin broth
1% tryptone, 0.5% yeast extract, 1% NaCl, 50μg/ml ampicillin z LB (Luria-Bertani)/Ampicillin agar
1% tryptone, 0.5% yeast extract, 1% NaCl, 1.5% agar, 50μg/ml ampicillin z DMEM medium
10% FBS, 1% PSA in Dulbecco’s Modified Eagle’s Medium z RPMI 1640 medium
10% FBS, 1% PSA, 2g NaHCO3 in 1L RPMI Medium 1640
z Opti-MEM I Medium Medium without serum
2.1.10 Equipment
-20 low temperature refrigera℃ tor (Frigidaire)
4 refrigerator (MINI KINGCON)℃
-80 low temperature refrigerator (NUAIRE)℃
Bench top orbital shaker 060 (LMS)
Biophotometer DPU-414 (eppendorf)
Bright
-line chamber (Marienfeld) Centrifuge 5415D (eppendorf)
Centrifuge 5804 R (eppendorf)
DNA electrophoresis unit Gel Mate 2000 (Toyobo)
Dot
-blot machine (Bio-East) Flow cytometer, FACSarray (BD)
Heating block (FIRSTEK)
Inverted research microscope, IX71 (Olympus)
Laminar flow hood, Forma Class II, A 1284 (NSF)
Microplate reader, Sunrise (Tecan)
Microscope, CX31 (Olympus)
Orbital Shaking incubator
OS1500R (TKS)
pH meter SP701 (Suntex)
Thermal cycler (eppendorf)
Uni-photo gel image system (EZ lab)
Water bath (FIRSTECK)
2.2 Methods
2.2.1 Computer prediction
The most probable epitope within the CEA-SARS sequence was calculated by the Internet software, SYFPEITHI (http://www.syfpeithi.de/). The sequence was pasted in the required box, and H2-Kd was selected as the MHC type. The number of amino acids of the epitope was set to nonamers (9 aa).
According to the description on the website, a reliability of at least 80% in retrieving the most apt epitope can be expected. Thus the naturally presented epitope should be among the top-scoring 2 % of all peptides predicted in 80 % of all predictions (http://www.syfpeithi.de/). The sequence that had the highest score was chosen to be our mutation template. To yield a mutated sequence, each amino acid of the template was replaced until another sequence had a highest score among all the changed sequences. It was named m1. Next, the amino acids within this new sequence was changed until another sequence with the highest score was
attained, which was named m2. The same approach was applied so that three cumulative mutations were generated in the m3 sequence.
2.2.2 PCR reaction
2.2.2.1 CEA synthesis
Because the antisense sequences overlap with the sense sequences for 20 bp in the designed primers, they will base pair with each other. Therefore, the whole CEA sequence can be constructed in the polymerase chain reaction (PCR) by DNA polymerase.
5‘ 3‘ 5‘ 3‘ 5‘ 3‘
3‘ 5‘
3‘ 5‘ 3‘ 5‘
DNA polymerase Figure 1. The scheme of CEA and SARS synthesis.
The CEA P1~P6 primers and the CEA P1~P5, P7 were added into a 0.2 ml tube, respectively, each taken 1 μl. The concentration of the first and the last primers in the sequence was 10 μM (P1, P6, P7) while the rest was 1 μM. 5 μl Taq buffer, 4 μl 10 nmol/ml dNTP, 0.5 μl Pro Taq, and 34.5 μl dd H2O were added. The reaction cycle is: 94 for 30 ℃
sec, 50 for 30 sec, and 72 for 20 sec for 2 cycles, 94 for 30 sec, 60 for 30 sec, and ℃ ℃ ℃ ℃ 72 for 20 sec for 34 cycles, 72 for 5 min to ℃ ℃ complete the reaction.
2.2.2.2 SARS synthesis
The SARS P1~P8 primers were added into a 0.2 ml tube, each taken 1 μl. The concentration of the first and the last primers in the sequence was 10 μM (P1, P8) while the rest was 1 μM. 5 μl Taq buffer, 4 μl 10 nmol/ml dNTP, 0.5 μl Pro Taq, and 34.5 μl dd H2O
were added. The reaction cycle is: 94 for 30 sec, 55 for 30 sec, and 72 for 20 sec for ℃ ℃ ℃ 2 cycles, 94 for 30 sec, 65 for 30 sec, and 72 for 20 sec for 33 cycles, 72 for 5 min ℃ ℃ ℃ ℃
to complete the reaction.
2.2.2.3 SARS mutation
The m1 plasmid was mutated by Gene TailorTM Site-Direted Mutagenesis System (Invitrogen, USA). The site-directed mutation has been designed on the primer beforehand. Original plasmid DNA is methylated before PCR so that it can be distinguished from the PCR product. After transformation into DH5αTM-T1 competent cells, McrBC endonuclease in the host cell digests the methylated template DNA, leaving only unmethylated, mutated product.
100 ng plasmid DNA, 1.6 μl methylation buffer, 1.6 μl 10X SAM, 1.0 μl DNA methylase (4 U/μl) were added into a 0.2 ml tube, sterile, distilled water was added to make the total volume 16 μl. These reagents were incubated at 37 for 1 hr. Then, 2℃ μl methylated DNA, 5 μl 10X PCR buffer, 1.5 μl 10 mM dNTP, 1.5 μl SARS m1 5’ and 3’ primers (10 μM each), and 0.5 μl TaqXL (Protech, Taipei, Taiwan) were added into a 0.2 ml tube. The PCR condition is as the following: 94 for 2 min, 94 for 30 sec, 53 for 30 sec, 68 for 10 ℃ ℃ ℃ ℃ min (the last three steps were run for 24 cycles), and 68 for 10 min to finish the unfinished ℃ reaction.
The m2 and m3 plasmids were constructed by the following methods. The original CEA-SARS sequence was run twice to create two segments in which mutation sequence was designed in the primers. Then, these two segments served as the template for a second run of PCR, in which the very beginning and the end of the original CEA-SARS primers were added. After the construct of m2, m3 was created by the m2 template by the same process.
CEA+front SARS CEA 5’ 2nd muta 3’ Rear SARS 2nd muta 5’ SARS 3’ CEA+front SARS Rear SARS CEA 5’ SARS 3’ CCEA-m2
The m1 plasmid serves as the template for m2 PCR. 5 μl template (~4.0 μg/ml), 5 μl 10X buffer, 4 μl 10 mM dNTP, 0.5 μl Pfu were added into a 0.2 ml tube. 1 μl CEA P1 and SARS m2 3’ primers were added for the CEA+front SARS PCR while 1 μl SARS P8 and SARS m2 5’ primers were added for the rear SARS PCR. To make the total volume be 50 μl, an appropriate amount of dd H2O was added. The PCR condition for the CEA+front SARS
sequence is as the following: 94 for 2 min, 94 for 30 sec, 55 for 30 sec (the l℃ ℃ ℃ ast three steps were run for 34 cycles), 72 for 1 min, and 72 for 5 min. The PCR condition for the ℃ ℃ rear SARS sequence is: 94 for 2 min, 94 for 30 sec, 53 for 30 sec (the last three steps ℃ ℃ ℃ were run for 34 cycles), 72 for 1 min, and 72 for 5 min. ℃ ℃
To combine the CEA+front SARS and the rear SARS sequences, 1 μl each PCR product was added, along with 5 μl 10X buffer, 4 μl dNTP, 0.5 μl Pfu, and 1 μl CEA P1 and SARS P8. The PCR condition is: 94 for 30 sec, 57 for 30 sec, 72 for 1 min. This step was run f℃ ℃ ℃ or 3 cycles. The annealing temperature was set at 57 for the annealing of the PCR products. ℃ Then, the next round of PCR condition is: 94 for 30 sec, 50 for 30 sec, 72 for 1 min. ℃ ℃ ℃ This step was run for 34 cycles. The annealing temperature was set at 50 ℃for the annealing of the primers onto the templates.
The m2 plasmid serves as the template for m3 PCR. 3 μl template (~4.5μg/ml), 5 μl 10X buffer, 4 μl 10 mM dNTP, 0.5 μl Pfu were added into a 0.2 ml tube. 1 μl CEA P1 and SARS m3 3’ primers were added for the CEA+front SARS PCR while 1 μl SARS P8 and SARS m3 5’ primers were added for the rear SARS PCR. To make the total volume be 50 μl, an appropriate amount of dd H2O was added. The PCR condition for the CEA+front SARS
sequence is as the following: 94 for ℃ 2 min, 94 for 30 sec, 52 for 30 sec (the last three ℃ ℃ steps were run for 34 cycles), 72 for 1 min, and 72 for 5 min. The PCR condition for the ℃ ℃ rear SARS sequence is: 94 for 2 min, 94 for 30 sec, 48 for 30 sec (the last three steps ℃ ℃ ℃ were run for 34 cycles), 72 for 1 min, and 72 for 5 min.℃ ℃
was added, along with 5 μl 10X buffer, 4 μl dNTP, 0.5 μl Pfu, and 1 μl CEA P1 and SARS P8. The PCR condition is: 94 for 30 sec, 58 for℃ ℃ 30 sec, 72 for 1 min. This step was run for ℃ 3 cycles. The annealing temperature was set at 58 for the annealing of the PCR products. ℃ Then, the next round of PCR condition is: 94 for 30 sec, 50 for 30 sec, 72 for 1 min. ℃ ℃ ℃ This step was run for 34 cycles. The annealing temperature was set at 50 for the annealing ℃ of the primers onto the templates.
2.2.3 Plasmid construction
2.2.3.1 Restriction enzyme digestion
0.5 μg~1 μg DNA was dissolved in an appropriate volume of water and was digested with restriction enzymes (following the commercial protocol). Generally, 1 μg DNA was digested with 5 unit of restriction enzyme in a 10 μl reaction at 37 overnight. ℃
2.2.3.2 DNA extraction
The DNA digested by restriction enzyme was cleaned up by Gene-SpinTM 1-4-3 DNA extraction kit (Protech), following the commercial protocol.
The DNA solution was spun at 13,000 rpm for 30 sec in the spin column. The filtrate in the collection tube was discarded. 700 μl Washing solution (Protech Co., Taipei, Taiwan) was added and the solution was spun for 1 min at 13,000 rpm. This step was repeated twice. Then, the filtrate was discarded by centrifugation at 13,000 rpm for 3 min to remove residual trace of ethanol. The column was additionally incubated at 65 for 5 min to evaporate e℃ thanol. DNA was eluted by 30-50 μl dd H2O in a new tube.
2.2.3.3 Ligation
Generally, the concentration ratio of the vector and the insert was 1:3. The concentration of the insert and the vector was measured by a photometer. 1 μl 10 mM ATP, 1 μl T4 ligase,
1 μl 10X ligation buffer, and an appropriate volume of dd H2O were added into a 500 μl tube
to 10 μl. The mixture was incubated at 16 overnight. ℃
2.2.4 Transformation of E. coli
2.2.4.1 Preparation of competent cells
One pick of E. coli was inoculated in 3 ml of LB broth and grew for 12 hr at 37 wit℃ h vigorous shaking (~225 rpm). One ml of the overnight culture was transferred into 100 ml LB broth and was then incubated at 37 with shaking (~225 rpm) until the OD℃ 600 was between
0.35~0.45. The culture was set on ice for 10 min. The cells were recovered by centrifugation at 4,100 rpm for 10 min and then resuspended in 30 ml ice-cold 0.1 M CaCl2. The cells were
pelleted by centrifugation at 4,100 rpm for 10 min at 4 . The pellet was resuspended in 2 ml ℃ 0.1 M CaCl2 (containing 10% glycerol). The cells were dispensed at 100μl per eppendorf tube
and then were stored at -80 . ℃
2.2.4.2 Transformation
Stored competent cells were thawed on ice. 1 μl~2 μl of plasmid DNA was mixed with 100 μl competent cells and was then stored on ice for 30 min. The mixture was incubated in a preheated 42 heating block for 90 sec and quickly thawed on ice for 2 min. Then 250℃ μl of LB broth was added to the cells. The culture was incubated at 37 with shaking (~225 rpm) ℃ for 50 min. 100 μl of the culture was plated on the LB agar plate with 50 μg/ml ampicillin. The plate was inverted and then incubated at 37 for 12~18 hr. ℃
2.2.5 Plasmid DNA extraction
2.2.5.1 Minipreparation
Plasmid DNA in E. coli was extracted with Gene-SpinTM Miniprep Purification Kit (Protech). The procedure is as the following:
A single colony of E. coli was inoculated in 3 ml of LB broth (with antibiotics) and grew overnight at 37 with vigorous shaking (~225 rpm). ℃ One to two ml of the cells were recovered by centrifugation at 13,000 rpm for 1 min and then resuspended in 200 μl Solution I buffer (Protech Co., Taipei, Taiwan) in a new tube. 200 μl Solution II buffer (Protech Co., Taipei, Taiwan) was added and mixed gently. 200 μl Solution III buffer (Protech Co., Taipei, Taiwan) was added to the mixture and mixed gently again. Cells were spun at 13,000 rpm for 5 min at 4 . The lysate was transferred to the Mini spin column. The solution was ℃ centrifuged at 13,000 rpm for 30 sec. The filtrate in the collection tube was discarded. 700 μl of Washing Solution (Protech Co., Taipei, Taiwan) was added in. The solution was spun at 13,000 rpm for 1 min. This step was repeated once again. After the filtrate was discarded, the column was centrifuged at 13,000 rpm for 3 min and incubated at 65 for 5 min to remove ℃ residual trace of ethanol. DNA was eluted by 30-50 μl dd H2O and centrifuged at 13,000 rpm
for 1 min. Plasmid DNA was stored at -20 .℃
2.2.5.2 Midipreparation
One ml of precultured E. coli was added into 100 ml LB broth (with antibiotics) and incubated at 37 with shaking (~225 rpm) for 12℃ -16 hr. The broth was centrifuged at 8,000 rpm at 4 for 15 min. After supernatant was discarded, 4 ml Buffer S1 (Macherey℃ -Nagel, Inc., Duren, Germany) was added and the solution was vortexed to dispense the pellet. Then 4 ml of Buffer S2 (Macherey-Nagel, Inc., Duren, Germany) was added. The lysate was mixed gently by inverting the tube 6~8 times and incubated at room temperature for 2~3 min. The solution was mixed with the 4 ml pre-cooled Buffer S3 (Macherey-Nagel, Inc., Duren, Germany) and inverted gently 6~8 times until a homogeneous suspension containing an off-white flocculate was formed. The suspension was incubated on ice for 5 min. A NucleoBond AX 100 column was equilibrated with 2.5 ml Buffer N2 (Macherey-Nagel, Inc., Duren, Germany). The flow-through was emptied by gravity flow and discarded. The
bacterial lysate was cleared by centrifugation at 12,000 rpm at 4 . The lysate was then ℃ loaded onto the NuceloBond column, which was emptied by gravity flow. Ten ml of Buffer S3 (Macherey-Nagel, Inc., Duren, Germany) was added to wash the column. This step was repeated once again. Plasmid DNA was eluted with 5 ml of Buffer N5 (Macherey-Nagel, Inc., Duren, Germany). Then 3.5 ml isopropanol was added to precipitate the eluted plasmid DNA. The mixture was incubated on ice for 10 min and centrifuged at 13,000 rpm for 30 min at 4 . ℃ The supernatant was discarded. One ml 70% ethanol was added to the pellet and stored at -20 or the solution was centrifuged at 13,000 rpm for 5 min for further application. Last, ℃ the pellet was redissolved in 20 μl dd H2O.
2.2.6 Cell culture
2.2.6.1 Balb/3T3
Balb/3T3 was cultured in DMEM (Sigma-Aldrich, St. Louis, USA) supplemented with 10% FBS and 1% PSA. Cells were incubated in tissue culture incubator with 5% CO2 at 37 . ℃
2.2.6.2 PT67
PT67 was cultured in DMEM (Sigma-Aldrich, St. Louis, USA) supplemented with 10% FBS and 1% PSA. Cells were incubated in tissue culture incubator with 5% CO2 at 37 .℃
2.2.6.3 CT26
CT26 was cultured in RPMI 1640 (Invitrogen Co., USA) supplemented with 10% FBS, 0.2% NaHCO3 and 1% PSA. Cells were incubated in tissue culture incubator with 5% CO2 at
37 .℃
2.2.6.4 P338D1
0.2% NaHCO3 and 1% PSA. Cells were incubated in tissue culture incubator with 5% CO2 at
37 .℃
2.2.7 Transfection of mammalian cells
2.2.7.1 Seeding cells
The medium in the 75T flask (Corning, NY, USA) was discarded. Three ml of EDTA-trypsin was added and the flask was incubated at room temperature for 5 min or until cells were detached. 5 ml of medium was added to dilute EDTA-trypsin. The solution was centrifuged at 1,500 rpm for 5 min at 4 . The supernatant was discarded. Cells were ℃ resuspended in 2 ml medium. Certain amount of cells was stained by Trypan blue and calculated by a bright-line chamber (Marienfeld, Germany). 2.5×10⁵ cells were seeded in each well of a 6-well plate (Corning, NY, USA). Three ml of medium was added and the cells were maintained in the incubator with 5% CO2 at 37 for 24 hr for further transfection.℃
2.2.7.2 Lipofectamine
TM2000 transfection
Cells were transfected with different plasmid DNA by LipofectamineTM 2000 (Invitrogen, USA). The transfection procedure was as following.
DNA was diluted in 250 μl Opti-MEM I Medium (GIBCO, USA) and mixed gently. 10 μl of LipofectamineTM 2000 was gently mixed with 250 μl Opti-MEM I medium and incubated for 5 min at room temperature. The diluted DNA was combined with the diluted LipofectamineTM 2000 for 20 min at room temperature. The medium in the cells were discarded and cells were gently washed with Opti-MEM I medium twice. The 500 μl DNA- LipofectamineTM 2000 mixture was added to 80-90% confluent cells. 500 μl of Opti-MEM I medium was added into each well gently and the cells were incubated at 37 in a CO℃ 2
incubator for 12 hr. Two ml of growth medium (DMEM or RPMI) was added into each well and cells were incubated at 37 in a℃ CO2 incubator for 24-48 hr prior to the following assay.
2.2.8 Infection of mammalian cells
CT26 was plated 12-18 hr before infection in a 6-well plate at the cell density of 1 x 10⁵ per well. DMEM from packaging cells, PT67, was collected. Equal amount of RPMI 1640 medium was added and the mixture was filtered through a 0.45-μm cellulose acetate or polysulfonic (low protein binding) filter. Three ml of the mixed medium was added into CT26, which was then incubated in a CO2 incubator for 24 hr. New DMEM was added into PT67
and collected 24 hr later by the same procedure. Then it was added into CT26 to replace the mixed medium. Infection was carried out four times within 4 days.
2.2.9 Dot-blotting
2.2.9.1 Preparation of the CEA antibody
The pAAV-CEA-B7.1-IVH3H plasmid was constructed beforehand. It was transfected into Balb/3T3 by the transfection protocol described above. 48 hr later, cells were harvested and centrifuged at 1,500 rpm for 5 min. The supernatant was discarded and 600 μl 1x PBS was added to resuspend the cells. 600 μl of incomplete Freund’s adjuvant (SIGMA, USA) was added to emulsify the mixture. Each mouse received 200 μl of the emulsified mixture. Blood was collected one week later and sera was collected by centrifugation at 4,000 rpm at 4 ℃for 30 min. The inoculation of plasmid was carried out once a week for a month. Every transfectant had been examined by cytometer for the existence of the construct.
2.2.9.2 Confirmation of the CEA antibody
To test whether the sera contained the CEA antibody, Balb/3T3 cells were first transfected with pAAV-CEA-B7.1-IVH3H by the transfection protocol described above. 48 hr later, medium was discarded. 1 ml of versene was added and cells were incubated at 37 for ℃ 5 min. 1 ml DMEM was added to harvest the transfectants. The cells was recovered by
centrifugation at 1,500 rpm at 4 for 5 min. The supernatant was discarded. 5 ml of staining ℃ buffer was added to gently suspend the cells. Sera were added as the 1st antibody and the mixture was incubated on ice for 1 hr. The pellet was collected by centrifugation at 1,500 rpm at 4 for 5 min. The supernatant was discarded and washed with 1 ml staining buffer twice. ℃ Then, 2nd antibody was added into the cell solution and the cells were incubated in dark on ice for 30 min. The mixture was washed with 1 ml staining buffer and centrifuged at 1,500 rpm at 4 for 5 min. This step was repeated once. Finally, the cells were resuspended in 1 ml ℃ staining buffer and filtered by a mesh before further analysis by cytometer.
2.2.9.3 Dot-blotting
The supernatant of the infected CT26 was collected in a 1 ml tube. Cells were recovered by centrifugation at 1,500 rpm at 4 for 5 min and resuspended in 100 ml PBS. Cells were ℃ then lysed by repeated freeze-thaw cycles. Both kinds of samples (the supernatant and the lysed cells) were applied onto the nitrocellulose (NC) paper, which was prewetted with 1x PBS buffer on a dot-blot machine (Bio-East, Taiwan). Samples were vacuumed gently for 30 min. The NC paper was blocked by 2% blocking buffer for 30 min and washed with PBST three times (5 min, 10 min, and 10 min) at room temperature. The sera containing the CEA antibody were diluted 1000X in staining buffer and applied onto the NC paper gently at room temperature for 1 hr with shaking. The mixture was then discarded. The NC paper was washed with PBST three times (5 min, 10 min, and 10 min) at room temperature. The 2nd antibody conjugated with HRP was diluted 1000X in staining buffer and applied on the NC paper for 30 min in dark with shaking. Then, the mixture was discarded. The NC paper was washed with PBST three times (5 min, 10 min, and 10 min) at room temperature. The substrate was applied onto the NC paper for 5 min in dark. The NC paper was covered in the lead blocker (Okamoto, Japan) with the film for 25 min. Then, the film was developed in the developer for 1 min. The film was washed in water before it was stained in the fixer for 1
min.
2.2.10 Transformation of Salmonella typhimurium
2.2.10.1 Preparation of competent cells
A colony of Salmonella typhimurium was inoculated in 25 ml of LB and grew for 20 hr at 37 with vigorous shaking (~225 rpm). The overnight culture was transferred into 500 ml ℃ SOB containing 2 M MgCl2 and was then incubated at 37 with shaking (~225 rpm) until ℃
the OD600 was between 0.35~0.4. The cells were recovered by centrifugation at 2,500 rpm for
15 min at 4 and the supernatant was discarded. An appropriate amount of dd H℃ 2O was
added to resuspend cells. This step was repeated twice. The pellet was resuspended in 1 ml dd H2O with 10% glycerol. The cells were dispensed at 20 μl per eppendorf tube and then were
stored at -80 .℃
2.2.10.2 Transformation
Stored competent cells were thawed on ice. 1 μl of plasmid DNA was mixed with 20 μl competent cells and transferred into a pre-cooled cuvette. Cells was then electroporated at 2.5 mF, 2.5 kV, and 200Ω for 4~5 msec. The mixture was immediately recovered in 1 ml LB, transferred to a test tube, and incubated at 37 with agitation (~225 rpm) for 1 hr. 100μl of ℃ the culture was plated on the LB agar plate with 50 μg/ml ampicillin. The plate was inverted and then incubated at 37 for 12~18 hr. ℃
2.2.11 P338D1 incubation with transformed Salmonella typhimurium
2.5 x 10⁸ Salmonella typhimurium transformed with pAAV-hrGFP were incubated with 5
x 106 P338D1 seeded in the 10-cm dish for 2 hr in the 5 ml DMEM medium without PSA. Then, 5 ml of DMEM medium supplemented with 30 μg/ml kanamycin was added to kill the remaining bacteria in the medium. The mixture was incubated at 37℃ in a CO2 incubator for