國 立 交 通 大 學
光電工程學系暨研究所
博 士 論 文
鈣鈦礦結構對螢光及鐵性材料特性的影響
Influence of perovskite structure on
luminescence and characteristics of ferroics
研 究 生:黃同慶
指 導 教 授:謝文峰 教授
中 華 民 國 九 十 八 年 十 月
鈣鈦礦結構對螢光及鐵性材料特性的影響
Influence of perovskite structure on
luminescence and characteristics of ferroics
研 究 生:黃 同 慶 Student:Tung-Ching Huang
指導教授:謝 文 峰 教 授 Advisor:Dr. Wen-Feng Hsieh
國 立 交 通 大 學
光 電 工 程 研 究 所
博 士 論 文
A Dissertation
Submitted to Department of Photonics and Institute of Electro-Optical Engineering College of Electrical Engineering and Computer Science
National Chiao Tung University In Partial Fulfillment of the Requirements
for the Degree of Doctor of Philosophy
in
Electro-Optical Engineering
October 2009
Hsinchu, Taiwan, Republic of China
誌謝
由衷地感謝許多的老師與夥伴們給予我無盡的幫助和建議,讓我順利地完成 我的博士學位,也感謝這個過程中你們給予我的感動和歡笑。 首先,我最要感謝的是我的指導老師 謝文峰教授,在學術上,謝謝老師帶 我進入光譜的研究領域,教我如何增進自己的知識,訓練我如何尋找研究方向、 獨自做實驗、建立自己一套邏輯性思考模式,進而架構一套研究模式,此外,特 別感謝老師這幾年來給我許許多多的人生建議,我想告訴老師,很多您說過的話, 我是有聽進去的,而且我想那些將會是我人生用之不盡的寶藏。 接著,我要感 謝 張振雄教授、 徐嘉鴻老師和 許火順老師在我研究上的幫助,也要感謝口試 委員們對我的論文的指導與建議。 最後我要感謝陪我走過研究生生涯的交大光 電所雷射診測實驗室的夥伴們,老郭和阿政學長引領我進入研究的領域和智章學 長給予的建議與幫助; 潘晴如學姊(雖然她不喜歡我叫她學姐),她的美食團是我 可以繼續念完博士班的最大動力,特別感謝她即使在畢業後的這一兩年來還是不 斷地給我鼓勵和加油; 楊松和林國峰不只在研究上給予許多的幫助,也感謝在吃 喝玩樂上一路相伴,他們可是陪我走過美國和歐洲; 感謝劉維仁在生活上和學業 上的相互鼓勵; 邱偉豪、郭晉嘉、王玫丹、蔡明容、黃冠智和蔡智雅,很高興在 人生旅途上與你們相遇,更感謝你們在我研究生涯的協助! 最後我要感謝的是我的家人,感謝阿公、阿媽、爸爸和媽媽,謝謝他們這麼 都多年來支持與鼓勵,也要特別感謝我老婆和女兒一路的相伴與鼓勵,你們都是 我過去、現在和未來不斷前進的最大動力。鈣鈦礦結構對螢光及鐵性材料特性的影響
研究生:黃同慶 指導教授:謝文峰 教授
國立交通大學光電工程學系暨研究所
摘要
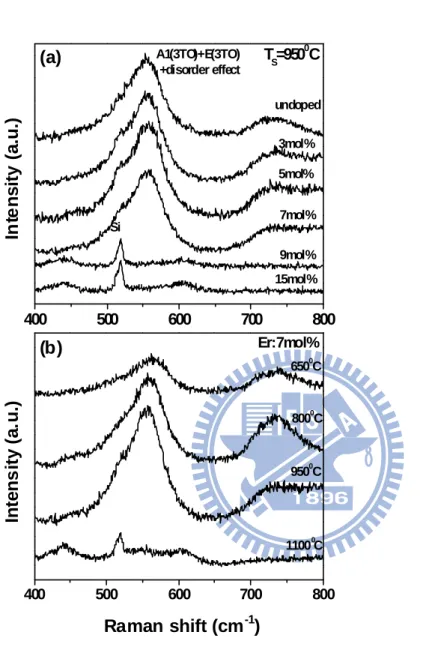
我們利用拉曼散射實驗研究物質尺寸和介面應力效應對鐵性材料(包含鈣鈦 礦和尖石礦結構)物理特性的影響,同時也探討因取代而造成結構變化對摻雜在 ABO3 鈣鈦礦結構中稀土族元素的發光機制的影響。所有的實驗樣品我們利用簡 單的化學溶液合成法加以合成。由於取代效應,利用觀察到螢光和拉曼信號消失 的現象,我們發現在鈦酸鑭鉛(Pb0.8La0.2TiO3)薄膜中當摻雜的三價鉺離子(Er3+)超 過 7 mol%時,會對原先微距(short-range)結構中的鈦原子的移位量造成破壞。 這個由於鈦原子的移位量造成的擾動(disorder)會破壞寄主(host materials) 鈣鈦礦結構之中心對稱,進而激發稀土元素的螢光輻射和鈣鈦礦的拉曼訊號。在 另外一個取代效應的研究中,當以 980nm 的半導體雷射激發鉺和鐿雙摻雜的鈦酸 鉛、鈦酸鋇、和鈦酸鍶粉末,觀察 upconversion 螢光光譜時,我們發現發紅光 的機制由 energy-back-transfer (EBT) 程序所主導。EBT 的效率不僅依賴鐿離子的濃度大小,也和鉺離子(Er:4
S3/2→4I13/2)與鐿離子 (Yb:2F7/2→2F5/2) 的殼層躍
遷能階大小是否吻合息息相關。而這個殼層能階大小是否吻合,則取決於摻雜取 代造成結構變化,所產生的晶格場(crystal field)變化對離子的殼層能階的影
響程度。 不同尺寸(size)鈦酸鋇奈米顆粒的晶格動力學研究中,當粉末顆粒由 140 nm 縮減到 30 nm 時,顆粒的四方晶特性(tetragonality)也隨之變弱,同時伴隨著 單位晶胞(unit-cell)體積的膨脹,這也是造成光學聲子的縱模和橫模的分裂隨 著顆粒尺寸變小而減少的主要機制;另外我們在這部份的研究中,也發現了 A1(TO1) 和 A1(TO2)的耦合強度隨著顆粒尺寸變小而減少,進而造成 A1(TO1)原先在拉曼光 譜是以下陷(dip)表現的形式變成在奈米尺寸下是以峰型(peak)展示。 最後,在鈦酸鉛-氧化鐵鈷的多重鐵性系統的研究中,發現兩介質介面間的 應力造成的磁電效應(magnetoelectric effect)和介質的聲子頻率位移有很強 的相關性。受介面影響的聲子能量和多重鐵性系統中的鐵磁物質的鐵電特性都會 受到介面間的應力影響;而這個介面間的應力大小,同時受到兩介質晶格不匹配 和介質間的化學鍵鍵結程度的影響。在埋有自成長碟型氧化鐵鈷的鈦酸鉛 (disk-3 type structure)的樣品,闡明了兩介質間有強的彈性交互作用。而這 個較強的作用造成了它的鐵磁特性和晶格特性都有較大的變化,當鐵磁部分有較 大的非對稱性磁頑力差和出現不存在飽和的磁化率,伴隨著的是鐵電部分的聲子 存在較大的聲子頻率位移。
Influence of perovskite structure on luminescence and
characteristics of ferroics
Student: Tung-Ching Huang
Advisor: Dr. Wen-Feng Hsieh
Department of Photonics & Institute of Electro-Optical Engineering
National Chiao Tung University
Abstract
We investigated on the physical characteristics of ferroics, ABO3-type perovskite and AB2O4-type spinel, which depend on size and strain effects by Raman spectroscopy, and the emission mechanism of rare-earth doped / co-doped ABO3 films on substitution effect. All the samples discussed in this thesis were prepared by chemical solution methods. In one of the cases of substitution effect, we found destruction to a displacement of Ti in the short-range structure by observing the disappearance of emission and Raman signals when the Er3+ concentration exceeds 7 mol% in sol-gel-derived Pb0.8La0.2TiO3 (PLT) polycrystalline films. The disorder due to a displacement of Ti breaks the centrosymmetry to activate emission of rare earth ions such as Er3+ and Raman modes of perovskites. We found that the symmetry breaking diminishes with introducing more Er3+ ions. Furthermore, in another case of substitution effect, we found that quenching of green upconversion (UC) emission accompanied with enhancement of red UC emission under a 980 nm laser pumping was observed dominated by the energy back-transfer (EBT) process in Er3+ and Yb3+ co-doped PbTiO3 (PTO), BaTiO3 (BTO), and SrTiO3 (STO)
polycrystalline powders. The efficiency of the EBT process depends not only on Yb3+ concentration but also on level match of the doped Er3+ and Yb3+ ions caused by the crystal fields with different symmetries. Results of emission spectra and X-ray diffraction (XRD) confirm that the centrosymmetric crystal field arising from reducing tetragonality causes level match of transition 4S3/2→4I13/2 of Er3+ and
2F
7/2→2F5/2 of Yb3+ that is responsible for enhancing red UC emission.
Moreover, in the case of size-dependent lattice dynamics of BTO nanoparticles, we found, upon decreasing the particle size from 140 nm to 30 nm, the tetragonality of BTO nanocrystallites is reduced accompanied with expanding unit-cell volume, which is the dominant mechanism for reducing giant splitting of longitudinal optical (LO) and transverse optical (TO) phonon modes in BTO system. The weakening coupling of two low-frequency modes among three A1(TO) phonons leads to change the lowest one from a spectral dip to a peak; whereas the increasing coupling strength between two high-frequency modes, repels them farther so that the less reducing in spectral separation.
Finally, in the part of strain effect, we found the energy of interfacial phonons and ferromagnetic properties depend on stress due to not only the lattice misfit but also the degree of chemical bonding at the interface between CFO and PTO matrices. The disk-3 type structure, the self-assembled CFO disks embedded in PTO matrix, illustrates the strong elastic interactions between these two phases. The largest nonsymmetrical coercivity Hc and the absence of saturation magnetization Ms of CFO matches with the largest Raman shift of A1(TO2) and A1(TO3) modes of PTO found in the disk-3 type as compared with the CFO and PTO multilayered structure and the CFO particles embedded in PTO matrix.
Table of of Contents
Abstract in Chinese……… I Abstract in English ………..……….…….. III Contents………...………V List of Figures……….……….IX List of Tables………...XIII
Chapter 1 Introduction………1
1.1 Ferroelectricity, Photorefractive effect, and Perovskite………..1
1.2 Ferromagneticity and Spinel…………..……….6
1.3 Multiferroic materials……….……11
1.4 Motive (develop a solution for integrated modulable decices)………….….13
1.4.1 Dependence of crystal structure on substitution, size, and shape….…….13
1.4.2 Dependence of mechanism of luminescence on crystal structure in rare-earth ions doped materials………….………14
1.4.3 Dependence of coupling of electricity and magnetism on lattice mismatch……….…….…..15
1.5 Organization of this dissertation………...……16
References………...….18
2.1 Vibrational spectroscopy……….………..…20
2.1.1 IR absorption………...…..20
2.1.2 Raman scattering………...22
2.2 Coupled phonon model……….24
2.3 Born effective charges and LO-TO splitting……….………26
2.4 Optical transitions of rare earth doped materials and upconversion………….…31
2.4.1 Fundamental optical transitions………..…31
2.4.2 Upconversion………..………33
2.5 Multiferroic magnetoelectrics ………..………35
References………...……….…39
Chapter 3 Experimental procedures and characterization techniques…...…41
3.1 Synthesis mechanisms and sample preparation………..………..41
3.1.1 Barium titanate nanoparticles ……….……41
3.1.2 Barium titanate rods ………...43
3.1.3 Rare earth doped perovskites………..45
3.1.3.1 Er3+-doped PLT poly-crystalline films……….…………45
3.1.3.2 Er-Yb codoped ferroelectrics……….……..46
3.1.4 Multiferroic films………..…..47
3.2 Characterization of structure………...…..48
3.2.1 X-ray Diffraction………...……48
3.2.3 Raman spectroscopy ….………49
3.3 Characterization of optical properties--Photoluminescence spectroscopy…...…51
3.4 Characterization of megnetic properties--Superconducting quantum interference device magnetometry………..…..51
References………....……52
Chapter 4 Destruction of the short-range disorder due to erbium doping in Pb0.8La0.2TiO3 films………...…..53
4.1 Crystal structure (results of XRD)………53
4.2 R e l a t i o n s h i p b e t w e e n r e s u l t s o f e m i s s i o n s p e c t r a a n d R a m a n spectra……….……….58
4.3 Summary……….64
References………...…….66
Chapter 5 Er-Yb codoped ferroelectrics for controlling visible upconversion emissions……….…..67
5.1 Upconversion emission……….………68
5.2 Mechanisms of upconversion emission………..…72
5.2.1 Crystal structure (results of XRD)………...72
5.2.2 Symmetry-dependent upconversion mechanism………..75
5.2.3 Pump power dependent upconversion………...76
5.3 Summary……….78
References………80
Chapter 6 Size-dependent lattice dynamics of BaTiO3 nanoparticles…...…81
6.2 Size-dependent Raman spectra of BaTiO3 nanoparticles………...…87
6.3 Born effective charges and LO-TO splitting in BaTiO3 nanoparticles system………...95
6.4 Summary………...…98
References………99
Chapter 7 Correlating phonon frequency shift with magnetoelectric effect in the PbTiO3-CoFe2O4 multiferroic system due to interfacial stress………...101
7.1 Microstructure and morphology………...102
7.2 Magnetic properties………...….108
7.3 Relationship between interfacial phonon behavior and magnetic properties….112 7.4 Summary……….…116
References……….…….118
Chapter 8 Conclusions and Prospective ………....…..119
8.1 Conclusions……….119
8.2 Prospective……….123
References……….….127
Vita……….128
List of Figures
Figure 1.1 Schematic illustrations for A-cell and B-cell types of unit cell for
cubic-ABO3 and possible alternative ways to derive cubic-ABO3 structure.…..……..4
Figure 1.2 Properties of paramagnetism, diamagnetism, and ferromagnetism.……….7
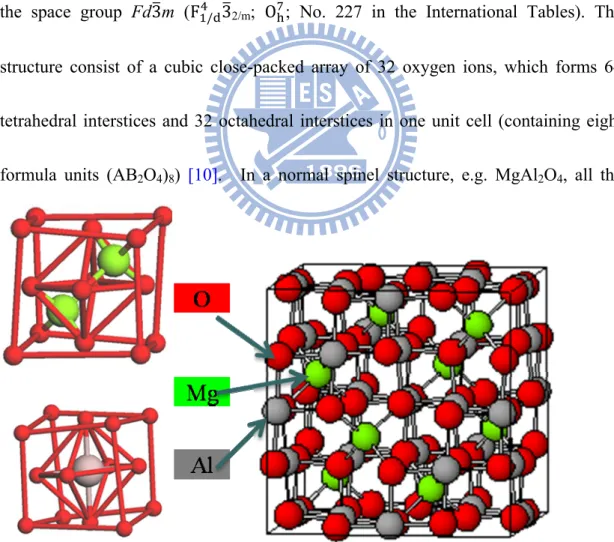
Figure 1.3 Arrangement of atoms within the MgAl2O4 unit cell..………....…10
Figure 1.4 Schematic illustration of multiferroic material………...12
Figure 2.1 Diagram of dipole moment………...21
Figure 2.2 Transition from level i to f………..22
Figure 2.3 Energy level diagram of PLT:Er+3 thin films………..………32
Figure 2.4 Energy level diagram of Er3+ and Yb3+ ions as well as the proposed mechanisms to produce UC spectra……….34
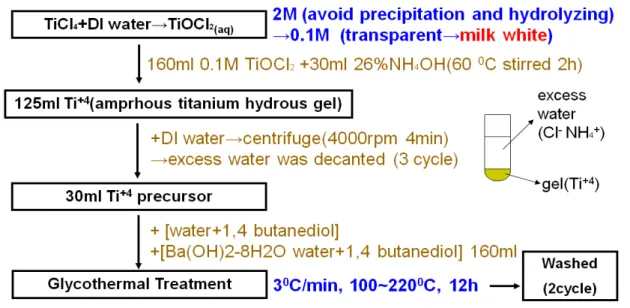
Figure 3.1 Flowchart of BaTiO3 nanocrystals preparation by glycothermal treatment method………..42
Figure 3.2 Proposed schematic diagram of the synthetic mechanism of BaTiO3 rods………...43
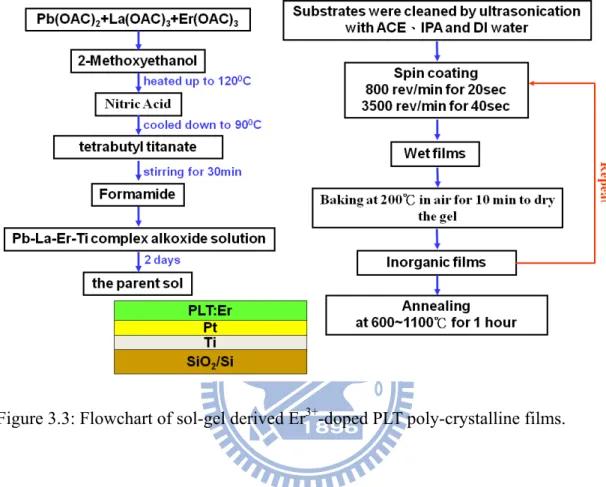
Figure 3.3 Flowchart of sol-gel derived Er3+-doped PLT poly-crystalline films…….45
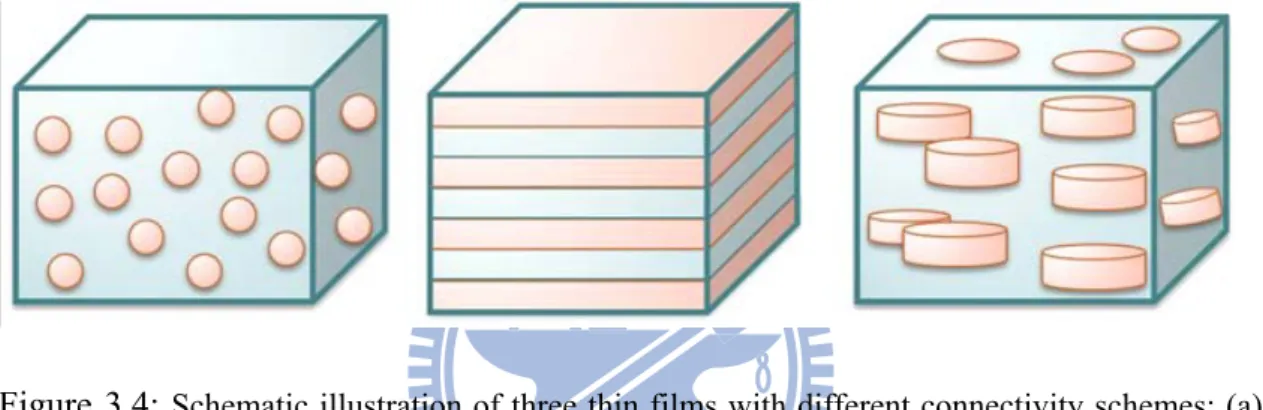
Figure 3.4 Schematic illustration of three thin films with different connectivity schemes: (a) the 0-3 type with CFO particles embedded in PTO matrix, (b) the 2-2 type with CFO and PTO nanolayers, and (c) the disk-3 type with CFO disc aligned in PTO matrix………...47
Figure 3.5 BL01C Experimental Station………...49
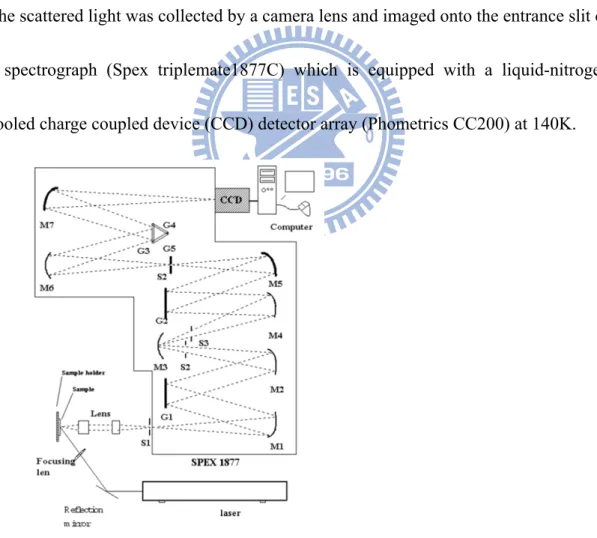
Figure 3.6 Setup of typical Raman and PL measurements……….…..50
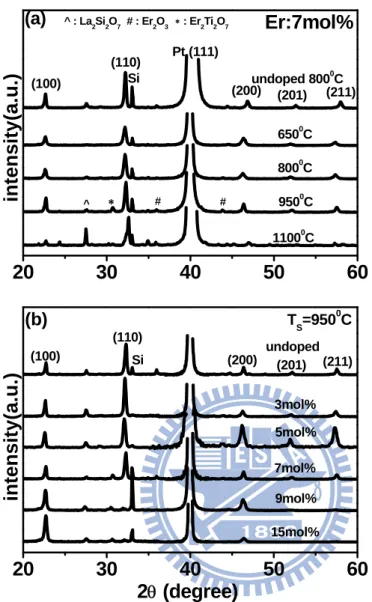
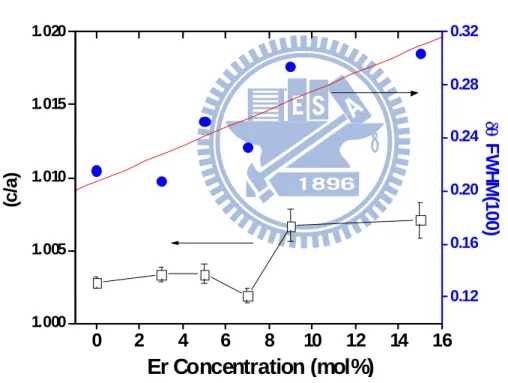
Figure 4.1 XRD patterns of Er3+-doped PLT films with 7 mol% Er3+ doping at various sintering temperatures and with different Er3+ concentrations at sintering temperature 950℃………..55 Figure 4.2 The ratio of lattice constants c/a after Rietveld refinement and the FWHM
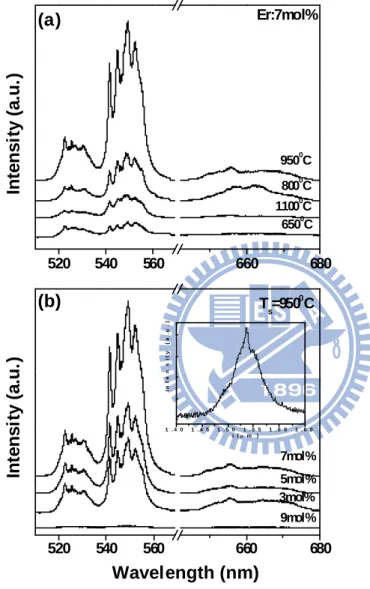
of (100) with different Er3+ concentrations at sintering temperature 950℃………....57 Figure 4.3 Dependence of the green emission intensities of Er3+-doped PLT films on
Er3+ concentrations and sintering temperature……….59
Figure 4.4 Raman spectra of Er3+-doped PLT films with different Er3+ concentrations at sintering temperature 950℃ and with 7 mol% Er3+ dopant at various sintering temperatures………61 Figure 4.5 Schematic representation of the position of B atom in ABO3 structure………63 Figure 5.1 UC fluorescence spectra of (a) PbTiO3, (b) BaTiO3, and (c) SrTiO3 doped with 6 mol% Er3+ ions and various concentrations of Yb3+ ions under the same pump power of 980 nm diode laser at 107 mW………69 Figure 5.2 XRD patterns of PbTiO3 and BaTiO3 doped with 6 mol% Er3+ ions and
various concentrations of Yb3+ ions………..…73
Figure 5.3 Rietveld pattern of PbTiO3 doped with only 6 mol% Er3+ ions and 6 mol%
Yb3+ ions. ………..….….74
Figure 5.4 c/a (a and c are lattice constants) ratio as function of Yb3+- ion concentrations after Rietveld refinement……….…74 Figure 5.5 Pump power dependence of the red upconversion emission of PbTiO3 and BaTiO3 doped with 6 mol% Er3+ ions and various concentrations of Yb3+ ions in a logarithmic scale………..…..76 Figure 6.1 Microstructure (FESEM) of BaTiO3 nanoparticles with average grain size of 140 ± 8 nm, 60 ± 6 nm, and 30 ± 5 nm……….………...83 Figure 6.2 Rietveld pattern of BaTiO3 nanoparticles with average grain size of 60 nm ……….…84 Figure 6.3 The lattice constants a and c of BaTiO3 nanoparticles after Rietveld
refinement procedure and the ratio of c/a (b)………...…86 Figure 6.4 Size dependence of Raman spectra for BaTiO3 bulk (> 1 m) and nanoparticles of diameter 140, 60, and 30nm, respectively……….88 Figure 6.5 Structural model of the cubic- and tetragonal-phase occurring with bulk
BaTiO3 crystals……….……...….89
Figure 6.6 The fitted parameters using the coupled-phonon model as a function of particle size. ………..………...…93 Figure 6.7 The LO-TO splitting of the A1(LO3) and A1(TO1) modes as function of particle size……….…96 Figure 6.8 Normalized square difference of phonon frequencies of A1(LO3) and
A1(TO1) and normalized reciprocal of unit cell volume for nanometer size samples to the micrometer size………..…96 Figure 7.1 Schematic illustration of three thin films with different connectivity schemes: the 0-3 type with CFO particles embedded in PTO matrix, the 2-2 type with CFO and PTO nanolayers, and the disk-3 type with CFO disc aligned in PTO matrix……….……….103 Figure 7.2 Top view of FESEM and OM images of the disk-3 type showing the
CoFe2O4 disks in the PbTiO3 matrix………..………103
Figure 7.3 X-ray diffraction patterns of the 2-2, 0-3, and disk-3 multiferroics together with those of, pure CFO powder, pure PTO powder, and PTO on Pt/Si film for comparison……….104 Figure 7.4 Hysteresis loops of out-of-plane and in-plane magnetization for the pure CFO, 0-3, 2-2, and disk- samples……….…..109 Figure 7.5 Micro Raman spectra of disk-3, 2-2, 0-3 multiferroics together with those of PTO on Pt/Si, and PTO powder for comparison……….113
Figure 7.6 The fitted Raman shift of the A1(TO3), A1(TO2), and A1(TO1) modes as a function of film type………...116 Figure 8.1 SEM images of the three-series products: BT-1, BT-2, and BT-3…125
List of Tables
Table 6-1 Refined crystal parameters and reliability factors of BaTiO3 nanoparticles...85 Table 7-1 The refined lattice parameters of PTO for the pure PTO powder and the films with different types……….………..105 Table 7-2 The refined lattice parameters of CFO for the films with different types………...105
Chapter 1 Introduction
1.1 Ferroelectricity, Photorefractive effect, and Perovskites
Ferroelectricity is a spontaneous electric polarization of a material that can be reversed by the application of an external electric field, upon cooling the material below a certain temperature called the Curie temperature. Ferroelectric ceramics were born in the early 1940s with the discovery of the phenomenon of ferroelectricity with high dielectric constant in barium titanate (BaTiO3). Ferroelectric materials have long been used in bulk forms in variety of fields such as ceramic capacitors. Furthermore, ferroelectric materials in the forms of thin films are essential for variety of devices such as ferroelectric random access memory (FRAM), infrared pyroelectric sensors, transistors, microwave electronics, electro-optic modulators, and in other integrated devices. Among the many classes of ferroelectric materials, the perovskite compounds such as lead lanthanum titanate (PLT) [1], lead zirconate titanate (PZT) [2], lead titanate (PTO) [3], and barium titanate (BTO) [4] have been the most intensively investigated.
Because of the beneficial properties of light such as wide bandwidth and high speed switching, photonic devices have the trend to replace electronic ones when they are available. Photorefractive materials particularly offer many fascinating
possibilities for applications in the development of communication networks and volume holographic memories [5]. The photorefractive effect is a phenomenon whereby the local refraction index is modified by spatial variations of the light intensity. When two coherent rays interfere with each other in a photorefractive material to forms a spatially varying pattern of illumination, charge carriers will be produced in the material and migrate owing to drift or diffusion and space charge separation effects. The resulting electric field from charge separation induces a refractive index change via the electro-optic effect. Owing to the large electro-optic effect present in perovskite materials such as barium titanate, the perovskite compounds are an extremely important group of not only ferroelectric but also photorefractive materials.
Perovskites are a large family of crystalline ceramics that derive their name from a
specific mineral known as perovskite. The parent material, perovskite, was first described in the 1830’s by a geologist Gustav Rove, who named it after the famous Russian mineralogist Count Lev Aleksevich von Perovski. The general formula of perovskite oxides is ABO3 (see Fig. 1.1), which is composed of three distinct chemical elements in the ratio of 1:1:3. Ideal oxide perovskite of the aristotype assumes cubic group Pm3m with atom positions of cation “A” at (1/2, 1/2, 1/2) of Wyckoff position 1a, cation “B” at (0, 0, 0) of Wyckoff position 1b, and anions “O” at
(1/2, 1/2, 0), (1/2, 0, 1/2) and (0, 1/2, 1/2) of Wyckoff position 3d. The cation “A” is usually larger than vation “B” in the perovskite oxide structure and the “A” and “B” sites are normally occupied by “+2” and “+4” ions, respectively. Conventionally, two types of unit cells with (1) A-cation and (2) B-cation located at center are adopt and often termed the A-cell and B-cell. For type A-cell, the corner-sharing BO6 octahedra where A-cation is located in the cubo- octahedral interstice of coordination number CN=12 is easily visualized. On the other hand, B-cation of CN=6, forming BO6 octahedron with six oxygen ions, is situated at the octahedral interstice. The configurations of two types of unit cells are illustrated schematically in Fig. 1.1(a) for A-cell type and Fig. 1.1(b) for B-cell type [Galasso 1970]. B-cell type unit cell has adopted recently since it clearly represents the BO6 octahedra from whose distortion the ferroelectricity in t-BaTiO3 and other ferroic properties, e.g. ferroelasticity, ferromagnetism are derived. Take cubic-ABO3 (Pm3 m), the 3C-polytype, to exemplify how perovskite structure is constructed is illustrated schematically in Fig. 1.1(c). Its crystal structure designated to E21 using Strukturbreicht symbols may be derived in the way from either α-ReO3 (D09), α-Cu3Au (L12) or CsCl (B2). When A2+ is inserted into D0
9 at eight corner sites, the structure becomes perovskite B-cell type. Similarly, removing “A” from B-cell type, the structure becomes ReO3 with all A-site vacant. Removing “B” from B-site of B-cell type, the crystal
structure becomes ordered fcc α-Cu3Au (L12). And then, by removing O2- from B-cell type, the structure perovskite is reduced to ordered bcc CsCl (B2). The atomic structure of perovskite is very sensitive to the alteration in the temperature of Figure 1.1: Schematic illustrations for A-cell and B-cell types of unit cell for cubic-ABO3 and possible alternative ways to derive cubic-ABO3 structure. [Galasso 1970].
the crystal. As the temperature changes, the crystallographic dimensions change and the crystal structures of ABO3 include cubic, tetragonal, orthorhombic, and rhombohedral due to distortion of the BO6 octahedra[6]. According to Landau free energy [Putnis 1992], the phase transition is discontinuous first-order in nature. All of the ferroelectric materials have a transition temperature called the Curie temperature (Tc). When the crystal temperature goes above the Curie temperature, T > Tc, the elongated crystallographic dimensions allow the B cation to sit at the center of BO6 skeleton. In this case, the crystal structure is cubic with no spontaneous or permanent electric dipole. Therefore, the crystal doesn’t exhibit ferroelectricity. While for T < Tc, the shrinkage of the octahedral lets the B cation be more energized to move farther from the center of the original octahedron. Shifting of the B cation causes the structure to alter, thus to induce spontaneous electric dipole. As a result, the distorted octahedral are coupled together, and a very large spontaneous polarization can be achieved. This large spontaneous polarization will lead to a large dielectric constant highly sensitive to temperature. It possesses ferroelectricity in this non-cubic crystal structure and is called ferroelectric phase. A ferroelectric crystal undergoes a phase transition from a non-ferroelectric phase to a ferroelectric phase on decreasing the temperature through the Curie point. The structure of perovskite is also sensitive to A cation substitutions [7-9] and the behavior is similar
to the alteration in the temperature of the crystal.
1.2 Ferromagneticity and Spinel
The spin of an electron combined with its orbital angular momentum results in a magnetic dipole moment and creates a magnetic field. But, the total dipole moment of all the electrons in many materials which have a filled electron shell is zero. Only atoms with partially filled shells can undergo a net magnetic moment in the absence of an external field. Ferromagnetic materials contain many atoms with unpaired spins. When the tiny magnetic dipoles are aligned in the same direction, they create a measurable macroscopic field. These magnetic dipoles tend to align in parallel to an external magnetic field, an effect called paramagnetism (see Fig. 1.2(a)). A related but much weaker effect is diamagnetism (see Fig. 1.2(b)), due to the orbital motion induced by an external field, resulting in a dipole moment opposite to the applied field. Ferromagnetism involves an additional phenomenon---the dipoles tend to align spontaneously even without any applied field (see Fig. 1.2(c)). This is a purely quantum-mechanical effect. According to the classical electromagnetism, two nearby magnetic dipoles will tend to align in opposite directions. However, they tend to align in the same direction because of the Pauli exclusive principle: two electrons with the same spin cannot sit at the same "position", which effectively
reduces the energy of their electrostatic interaction compared to electrons with opposite spin. This difference in energy is called the exchange energy.
The exchange interaction is primarily responsible for the ordering of atomic moments occurring in magnetic solids and for two other major magnetic ordering types, antiferromagnetism and ferrimagnetism. For instance, in iron (Fe) the exchange interaction between two atoms is about 1000 times stronger than that of classical interaction. There are a small number of "exotic" ferromagnets in which the exchange interactions are exceptionally weak, and then the classical dipole-dipole Figure 1.2: Properties of paramagnetism, diamagnetism, and ferromagnetism.
interaction may become the dominant ones. However, such systems become ferromagnetic only at very low temperature, usually below 1 K. But if the Curie point in a given material is higher than a few kelvins, then its ferromagnetism is surely produced by exchange interaction. In such systems the classical dipole-dipole interaction may only give rise to secondary effects.
For the long range, the advantage of exchange energy is overtaken by the classical tendency of dipoles to anti-align. This is why, in an equilibriated ferromagnetic material, the dipoles in the whole material are not aligned. Rather, they organize into magnetic domains (also known as Weiss domains) that are aligned at short range, but at long range adjacent domains are anti-aligned. The boundary between two domains, where the magnetization flips, is called a domain wall (i.e., a Bloch/Néel wall, depending upon whether the magnetization rotates parallel/perpendicular to the domain interface) and is a gradual transition on the atomic scale.
Thus, an ordinary piece of iron generally has little or no net magnetic moment. However, if it is placed in a strong enough external magnetic field, the domains will re-orient in parallel with that field, and will remain re-oriented when the field is turned off, thus creating a "permanent" magnet. The domains don't go back to their original minimum energy configuration when the field is turned off because the
domain walls tend to become 'pinned' or 'snagged' on defects in the crystal lattice, preserving their parallel orientation. This is shown by the Barkhausen effect: as the magnetizing field is changed, the magnetization changes in thousands of tiny discontinuous jumps as the domain walls suddenly "snap" past defects. This magnetization as a function of the external field is described by a hysteresis curve. Although this state of aligned domains is not a minimal-energy configuration, it is extremely stable and has been observed to persist for millions of years in seafloor magnetite aligned by the Earth's magnetic field. Alloys used for the strongest permanent magnets are "hard" alloys made with many defects in their crystal structure where the domain walls "catch" and stabilize. The net magnetization can be destroyed by heating and then annealing the material without an external field, however. The thermal motion allows the domain boundaries to move, releasing them from any defects to return to their low-energy unaligned state.
As the temperature increases, thermal motion and entropy competes with the ferromagnetic tendency for dipoles to align. When the temperature rises beyond a certain point, called the Curie point, there is a second-order phase transition and the system can no longer maintain a spontaneous magnetization, although it still responds paramagnetically to an external field. Below that temperature, there is a spontaneous symmetry breaking and random domains form. The Curie temperature itself is a
critical point, where the magnetic susceptibility (χ) is theoretically infinite and, although there is no net magnetization, domain-like spin correlations fluctuate at all length scales.
Spinel is an important class of mixed-metal oxides, which has the general chemical composition of AB2O4. Atom “A” is a divalent ion of radius between 80 and 110 pm, such as Fe, Mn and Cu; atom “B” is a trivalent atom of radius between 75 and 90 pm, such as Ti, Fe and Co. The majority of spinel compounds belong to the space group Fd3m (F / 32/m; O ; No. 227 in the International Tables). The structure consist of a cubic close-packed array of 32 oxygen ions, which forms 64 tetrahedral interstices and 32 octahedral interstices in one unit cell (containing eight formula units (AB2O4)8) [10]. In a normal spinel structure, e.g. MgAl2O4, all the
trivalent cations (Al3+) are located in half the octahedral sites, while all the divalent cations (Mg2+) occupy 1/8 of the tetrahedral sites. Figure 1.2 shows a typical spinel structure. Notice the red oxygen atoms, the green “A” atoms are in the tetrahedral holes, and the grey “B” atoms in the octahedral holes.
Cobalt ferrite, CoFe2O4 (CFO), has an inverse spinel structure. The normal crystal structure of an AB2O4 spinel consists of the A2+ atoms occupying the tetrahedral coordination sites and the B3+ atoms occupying the octahedral sites [11]. An inverse spinel is an alternative arrangement where the divalent ions swap with half of the trivalent ions so that the Co2+ now occupy octahedral sites i.e. Fe(CoFe)O
4.
The Co cation occupies one half of the octahedral coordination sites and half the Fe3+ cations occupy the other half of the octahedral coordination sites as well as all of the tetrahedral coordination sites.
1.3 Multiferroic materials
Multiferroics displaying both ferroelectric and ferromagnetic properties is
known possessing the magnetoelectric (ME) effect between the two parameters [12]. The ME effect in multiferroics possesses not only simultaneous magnetic and electric ordering but also interconversion of energies stored in electric and magnetic fields.
It is also an important mechanism in applications of transducers, actuators, and sensors [13, 14]. There are some theoretical studies [15-17] on calculating the coupling effect of different geometric structures and many experimental reports [13, 18] of ME effect in various types of materials, different geometric shapes, and operational modes. The coexistence of magnetic and electric subsystems engenders the material with the “product” property (i.e., the composite exhibits responses that are not available in the individual component phases), thus allowing an additional degree of freedom in the design of actuators, transducers, and storage devices. However, the choice of single-phase materials exhibiting coexistence of strong ferro/ferrimagnetism and ferroelectricity is limited [19, 20]. Van Suchtelen et al. [21]
proposed that composites of piezoelectric and magnetostrictive phases can be electromagnetically coupled via stress mediation (see Fig. 1.4). The ME coupling Figure 1.4: Schematic illustration of multiferroic material.
results from the elastic bonding at the interface and is transmitted through the stress/strain exerted by a magnetized magnetostrictive phase on a piezoelectric phase or vice versa along their boundary, hence it induces a net polarization or magnetization [12, 22, 23].
1.4 Motive
To develop a solution for integrated modulable devices, study on not only the emission properties of rare-earth (RE)-doped ferroelectric materials but also the various properties of host materials is strongly motivated.
1.4.1 Dependence of crystal structure on substitution,
size
, and shapeThe physical properties of complex oxide perovskites have been dramatically influenced by various effects, such as temperature [24-26], pressure [25, 27], substitution [28], size, and shape [29-33]. With the development of miniaturization of electronics, recent advances in solid-state science have resulted in ferroelectric materials and devices with nanostructures with length scales less than 200 nm. The size dependence of Curie temperature and tetragonal distortion of the ferroelectric phase has been investigated theoretically based on the Landau-Ginsburg-Devonshire (LGD) theory in the case of isolated particles.[34-37] The change of the ferroelectric phase in isolated particles is mainly the consequence of the surface effect and a transition from the ferroelectric phase to a cubic paraelectric phase at room
temperature for a critical particle size from a few nanometers to a few tens of nanometers is predicted. However, it is often difficult in experiment to separate true size effects from other factors that change with the size. The fixity of the ferroelectric phase can be determined by additional factors like defect chemistry, incorporation of foreign atoms and bulk hydroxyl groups, aggregation level of the particles, porosity level, and residual stresses.[38-43] To avoid the disturbance of other causes, powders with uniform size therefore seems a more convenient system to study size effects. In this part, we synthesize BaTiO3 nanocrystals with uniform crystal size less than 200 nm by using glycothermal synthesis method. We probe the size dependence of structure characterization with crystal size ranging from ~μm to ~10 nm by using the x-ray diffraction (XRD), scanning Electron microscope (SEM) and Raman scattering. The research topic will focused on the behavior of phonon modes, including the displacement of B cation and the coupling of phonon, as the crystal size decreases from ~μm to ~10 nm. We also attempt to synthesize BaTiO3 nano-wires (nano-rods) by using molten-salt synthesis method.
1.4.2 Dependence of mechanism of luminescence on crystal structure in rare-earth ions doped materials
The different crystal field caused by structure symmetry of the host material would contribute to different perturbation terms for the rare-earth ions inner shell
transitions. Therefore, the crystal structure is a more important mechanism for not only emission efficiency in erbium-doped Pb0.8La0.2TiO3 system, but also converting up-conversion (UC) green radiation to red radiation due to the EBT process in Er-Yb codoped ferroelectrics. In this part, we have studied the dependence of emission mechanism on the crystal structure of perovskites doped with rare-earth ions.
1.4.3 Dependence of coupling of electricity and magnetism on lattice mismatch
Multiferroics displaying both ferroelectric and ferromagnetic properties is known possessing the ME effect between the two parameters. Van Suchtelen et al. [21]
proposed that composites of piezoelectric and magnetostrictive phases can be electromagnetically coupled via stress mediation. The ME coupling results from the elastic bonding at the interface and is transmitted through the stress/strain exerted by magnetized magnetostrictive phase on piezoelectric phase or vice versa along their boundary and hence it induces a net spontaneous polarization or magnetization [12, 22, 23]. Moreover, it is well known that the behavior of interfacial phonon is sensitive to the giant residual stress/strain resulting from the lattice misfit between the different media [44]. It is interesting and important to investigate the relationship between the ME effect and the behavior of interfacial phonon. Recent studies on phonon behavior of multiferroics were reported [45-47], but the results are inconclusive. In this part, we report on the stress dependence of the behavior of interfacial phonon and
the magnetic properties in three multiferroics consisting of the different geometric shapes of ferromagnetic CoFe2O4 (CFO) embedded in ferroelectrics PbTiO3 (PTO) by using the micro-Raman spectroscopy and superconducting quantum interference device (SQUID).
1.5 Organization of this dissertation
In this thesis, I present investigations of the influence of perovskite structure on luminescence and characteristics of ferroics. The dissertation is organized as follows. I first describe the related theoretic background in Chapter 2, including a general concept of crystal structures, lattice dynamics, fundamental optical transitions, and magnetoelectric (ME) effect. In Chapter 3, I present the synthesis of the samples with different processes and also show the brief illustrations of characterization techniques. In Chapter 4, I discuss the dominant mechanisms on visible emission of the Er3+ doped Pb0.8La0.2TiO3 polycrystalline films. Combining with examining the disappearance of Raman modes, I show destruction to a displacement of Ti in the short-range structure for doping concentration exceeding 7 mol%. The diminishing of symmetry breaking causes quench of Er3+ emission. As increasing Yb3+ co-doped concentrations in 6 mol% Er3+ doped PbTiO3, BaTiO3, and SrTiO3 polycrystalline powder samples, the dominant mechanisms of visible upconversion emissions in Er-Yb codoped ferroelectrics are discussed in Chapter 5. In Chapter 6, I discuss the
attractive LO-TO splitting behavior and depict the low frequency TO spectral peak along with change of the tetragonal phase toward the cubic one for reducing diameter of BaTiO3 nanocrystals from 140 nm to 30 nm. In Chapter 7, I discuss the characteristics of three different geometric forms of the PbTiO3-CoFe2O4 multiferroics. The analysis of the magnetic and Raman measurements under different geometric forms indicates the dependence of magnetic property and interfacial phonon behavior on stress/strain due to the lattice misfit and the strongest chemical bonding at the interface between CoFe2O4 and PbTiO3 matrices. In the final Chapter 8, I conclude the studies on the ferroics and propose the several topics worthy of the future work.
References
[1] S. Bhaskar, S. B. Majmder, P. S. Dobal, R. S. Katiyar, and S.B. Krupanidhi, J. Appl. Phys. 89, 5637 (2001).
[2] J. Cheng and Z. Meng, Thin Solid Films 385, (2001).
[3] C. H. Wang and D. J. Choi, J. Am. Ceram. Soc. 84, 207 (2001). [4] H. Kumazawa and K. Masuda, Thin Solid Films 353, 144 (1999). [5] D. Psaltis and F. Mok, Sci. Am. 11, 52 (1995).
[6] C. N. R. Rao and K. J. Rao: Phase Transitions in Soild (Megrqw-Hill International Book Company, 1978).
[7] S.Y. Kuo, W.Y. Liao, and W.F. Hsieh, Phys. Rev. B 64, 224103 (2001) [8] S.Y. Kuo, C.T. Li, and W.F. Hsieh, Appl.Phys. Lett. 81, 3019 (2002) [9] S.Y. Kuo, C.T. Li, and W.F. Hsieh, Phys. Rev. B 69, 184104 (2004) [10] W. Gary, Inorganic Chemistry, University Science Books, 691 (2000). [11] Modern Ferrite Technology: Crystal structures of Ferrites, 52-69.
[12] H. Zheng, J. Wang, S. E. Lofland, Z. Ma, L. Mohaddes-Ardabili, T. Zhao, L. Salamanca-Riba, S. R. Shinde, S. B. Ogale, F. Bai, D. Viehland, Y. Jia, D. G. Schlom, M. Wuttig, A. Roytburd, and R. Ramesh, Science 303, 661-663 (2004). [13] C. W. Nan, M. I. Bichurin, S. X. Dong, D. Viehland, G. and Srinivasan, J. Appl.
Phys. 103, 031101 (2008).
[14] J. F. Scott, Nat. Mater. 6, 256-257 (2007).
[15] V. M. Petrov, G. Srinivasan, M. I. Bichurin, and A. Gupta, Phys. Rev. B 75, 224407 (2007).
[16] C. Q. Liu, W. D. Fei, and W. L. Li, J. Phys. D-Appl. Phys. 41, 125404 (2008). [17] C. K. Wong and F. G. Shin, J. Phys. D-Appl. Phys. 41, 135002 (2008).
[18] J. Zhai, Z. Xing, S. Dong, J. Li, and D. Viehland, J. Am. Ceram. Soc. 91, 351-358 (2008).
[19] F. A. Smolenskiı˘, I. E. Chupis, Sov. Phys. Usp. 25, 475 (1982). [20] J. Wang et al., Science 299, 1719 (2003).
[21] J. Van Suchtelen, Philips Res. Rep. 27, 28 (1972).
[22] J. G. Wan, X. W. Wang, Y. J. Wu, M. Zeng, Y. Wang, H. Jiang, W. Q. Zhou, G. H. Wang, and J. M. Liu, Appl. Phys. Lett. 86, 122501 (2005).
[23] C. W. Nan, G. Liu, Y. H. Lin, and H. Chen, Phys. Rev. Lett. 94, 197203 (2005). [24] R. Pirc and R. Blinc, Phys. Rev. B 70, 134107 (2004).
[25] J. I´n˜ iguez and D. Vanderbilit, Phys. Rev. Lett. 89, 115503 (2002). [26] D. Damjanovic, F. Brem, and N. Setter, Appl. Phys. Lett. 80, 652 (2002).
[27] U. D. Venkateswaran, V. M. Naik, and R. Naik, Phys. Rev. B 58, 14256 (1998). [28] S. Y. Kuo, W. Y. Liao, and W. F. Hsieh Phys. Rev. B 64, 224103 (2001).
[29] M. H. Frey and D. A. Payne, Phys. Rev. B 54, 3158 (1996).
[30] S. Tsunekawa, S. Ito, T. Mori, K. Ishikawa, Z. Q. Li, and Y. Kawazoe1, Phys. Rev B 62, 3065 (2000).
[31] Z. Zhao, V. Buscaglia, M. Viviani, M. T. Buscaglia, L. Mitoseriu, A. Testino, M. Nygren, M. Johnsson, and P. Nanni, Phys. Rev. B 70, 024107 (2004).
[32] T. Hoshina, H. Kakemoto, T. Tsurumi, S. Wada, and M. Yashima, J. Appl. Phys. 99, 054311 (2006).
[33] M. Yashima, T. Hoshina, D. Ishimura, S. Kobayashi, W. Nakamura, T. Tsurumi and S. Wada, J. Appl. Phys. 98, 014313 (2005).
[34] C. L. Wang, and S. R.P. Smith, J. Phys.:Condens. Matter 7, 7163 (1995)
[35] S. Li, J. A. Eastman, Z. Li, C.M. Foster, R. E. Newnham, and L. E. Cross, Phys. Lett. A 212, 341 (1996)
[36] B. Jiang, and L. A. Bursill, Phys. Rev. B 60, 9978 (1999)
[37] H. Huang, C. Q. Sun, and P. Hing, J. Phys.: Condens. Matter 12, L127 (2000). [38] E. K. Akdogan, M. R. Leonard, and A. Safari, in Handbook of Low and High
Dielectric Constant Materials and Their Applications, edited by H. S. Nalwa (Academic Press, San Diego, 1999), Vol. 2, p. 61.
[39] K. Ishikawa, K. Yoshikawa, and N. Okada, Phys. Rev. B 37, 5852 (1988); [40] K. Ishikawa, and T. Uemori, ibid. 60, 11 841 (1999)
[41] S. Tsunekawa, S. Ito, T. Mori, K. Ishikawa, Z.-Q. Li, and Y. Kawazoe, ibid. 62, 3065 (2000).
[42] M. H. Frey and D. A. Payne, Phys. Rev. B 54, 3158 (1996) [43] X. Li and W.-H. Shih, J. Am. Ceram. Soc. 80, 2844 (1997).
[44] D. S. Fu, T. Ogawa, H. Suzuki, and K. Ishikawa, Appl. Phys. Lett. 77, 1532-1534 (2000).
[45] J. Barbosa, B. G. Almeida, J. A. Mendes, A. G. Rolo, J. P. Araujo, and J. B. Sousa, J. Appl. Phys. 101, 09M101(2007).
[46] N. Ortega, A. Kumar, P. Bhattacharya, S. B. Majumder, and R. S. Katiyar, Phys. Rev. B 77, 014111(2008).
[47] H. M. Zheng, J. Kreisel, Y. H. Chu, R. Ramesh, and L. Salamanca-Riba, Appl. Phys. Lett. 90, 113113(2007).
Chapter 2 Theoretical Background
In this chapter, lattice vibration in crystals, optical transitions of rare earth, and multiferroic magnetoelectrics are reviewed. Lattice dynamics corresponding to lattice vibrational properties, the behavior of coupled phonon and, the mechanism of LO-TO splitting are discussed. Optical transitions in rare earth doped materials have been described, including the mechanism of fundamental optical transitions and upconversion.
2.1 Vibrational spectroscopy
2.1.1 IR absorption
For infra-red (IR) wavelengths, absorption must in some way be related to a variation in the charge distribution. This arises due to a change in the dipole moment associated with molecule. After bonding, one atom of the molecules has a local charge q then the rest of atoms have charge q and the dipole moment , is given by
l
q
, (2-1) where l is the separation of the charges (see Figure 2.1).Electromagnetic wave can be absorbed or emitted by a medium if during its interaction there is a change in the charge distribution within the medium. During the interaction with photon, the dipole moment will change, thus one can rewrite the dipole moment as
Q
Q
0 , (2-2) where Q (rreqm) is the displacement from the equilibrium position “reqm ”.In order to describe the excitation of a molecule from vibrational level, v to i f
v , as shown in Figure 2.2, an interaction Hamiltonian Hint E that
expresses the interaction of an atom with a photon is added to the unperturbed Hamiltonian H0to describe the total Hamiltonian,
int
H H
H o (2-3)
Thus the transition moment, R , can be written as
H iH f R i intf int , (2-4) so, E f Q Q i f E Q Q i R (0 ) (2-5)Figure 2.1: Diagram of dipole moment.
q
IR absorption occurs as the transition R0, in other words, there must be a change in the dipole moment due to vibration of the molecule which is induced by the applied field E, since the transition probability P is equal to| |R 2. The condition that an
IR absorption or emission must be associated with a change in dipole moment is known as the dipole selection rule. The dipole selection rule plays an important role in IR spectroscopy because it tells us whether a molecule will be IR active or not.
2.1.2 Raman scattering
When light passes through a medium, most of the light is reflected, transmitted, absorbed, elastic or inelastic scattered. Raman scattering is an inelastic scattering process. When the light encounters the medium, it interacts inelastically with phonon (vibration) modes and produces outgoing photons whose frequencies are relatively shifted by an amount of energy correspondent to phonon energy from that of the incoming light. The scattered outgoing photons are called the Raman-scattered photons. If the light of frequencyv0 is scattered by some media,
the spectrum of the scattered light contains a strong line of frequencyv0 and much Figure 2.2: Transition from level i to f.
f
weaker lines of frequenciesv0 v1, v0 v2, ………, v0 v2,v0 v1, etc. Those
lines on the low frequency side of the exciting lines (i.e., v0 vi,i1,2,...) are
always matched by lines on the high frequency side (i.e., v0 vi,i1,2,...) but the latter are much weaker when the scattering medium is at room temperature. Raman scattering is inherently a weak process, but laser provides enough intensity that the spectra can be routinely measured. In analogy with terms used in the discussion of fluorescence spectra, lines on the low frequency side of the exciting line are known as Stokes lines and those on the high frequency side as anti-Stokes lines.
The incident photon loses its energy by producing a phonon (Stokes shifted), or gain energy and momentum by absorbing a phonon (anti-Stokes shifted), according to the energy conservation rules:
2
1
hv
W
W
hv
i
s
, (2-6)
h
(
v
s
v
i)
h
v
W
1
W
2, (2-7) wherev
i andv
s are the incoming and scattered photon frequencies, W and 1 W are 2 the energy of the molecule before and after the interaction, respectively.Assuming that the scattering medium is in temperature equilibrium at temperature T, the distribution of the molecules over the energy states will be Boltzmann and the ratio of the number of molecules N1 in a state of energy W to the 1
number of molecules N2 in a state of energy W is given by 2
kT v h
e
N
N
/ 2 1
, (2-8) if degeneracy is neglected. If one includes the fact that scattered intensity is proportional to the fourth power of the frequency then the relative intensities ofStokes to anti-Stokes lines and their temperature dependence be consistent with the ratio kT v h Stokes Stokes anti
e
v
v
v
v
I
I
(
)
4 /
. (2-9) All the Raman mode frequencies, intensities, line-shape, and line-width, as well as polarization behavior can be used to characterize the lattice and impurities. The intensity gives information on crystallinity. The line-width increases when a material is damaged or disordered, because damage or disorder occurs in a material will increase the phonon damping rate or relax the rules for momentum conservation in Raman process. All these capabilities can be used as a judgment for layered microstructure as well as bulk materials, subject only to the limitation that the penetration depth of the exciting radiation ranges from a few hundred nanometers to few micrometers.2.2 Coupled phonon model
The Hamiltonian of an isolated system can always be brought to a diagonal form, which means that any coupling of the quantum states is reducible. Under this assumption, the reflectivity of the crystal with more than one infrared active mode is often quite well reproduced by a formula involving the sum of contributions from independent classical oscillators. However, no system above the temperature 0K is isolated, for that we have least the blackbody radiation connecting it with the environment. In some notable cases, the Hamiltonian of the system is intrinsically
non-diagonal. The profile of the energy spectrum of such system is not composed of a set of Lorentzian peaks, but contains asymmetric interfering features.
Since the occurrence of coupling in the lattice modes was recognized by Barker and Hopield to explain the infrared reflectivity of some perovskites, a handful of spectral anomalies in data on Raman. Brillouin and neutron scattering were observed and associated with phonon-phonon coupling. Because the coupling phenomenon is a temperature-induced effect, it seems probable that its occurrence will be more frequent in crystal showing other thermal anomalies in the phonon behavior. In fact, most of the crystals undergo a structural phase transition at some temperature not far from where the interference starts to be observable. BaTiO3 presents three structural phase transitions, at -80, 0, and 130℃. In the tetragonal phase between 0 and 130℃ the dynamics of the crystal is complicated. All the three A1 modes of vibration are strongly coupled and two of them are heavily damped.
Because the three A1(TO) modes are strongly coupled and two of them are heavily damped in the tetragonal phase of ABO3, Sood, [1] and Chaves, et al. [2] have considered three coupled A1(TO) modes to describe the complicated coupling phenomenon. The Raman intensity of the three coupled modes can be expressed by
) (
I
A [n()1]Im[T*GT], (2-10) where A is a constant, ( )n is Bose-Einstein factor, T is a vector involving Ramanscattering amplitudes, and the inverse matrix response is
G-1()
Ω2 2IiΓ. (2-11)In Eq. (2-11), I is the unit matrix, Ω2 is the force constant matrix, and Γ is the damping matrix: Ω2 2 3 2 23 2 23 2 2 2 12 2 12 2 1 0 0 and Γ 2 3 2 2 2 1 0 0 0 0 0 0 . (2-12)
Here i and ij ( ,i j1, 2,3) are the uncoupled mode frequencies and the coupling strengths between modes i and j. The coupling between the lowest ( 1)
and the highest (3) modes was set to zero (13 0 ), to allow less fitting parameters; this is a reasonable approximation because they are too far from each other, having no spectral superimposition.
2.3 Born effective charges and LO-TO splitting
The total polarization in the crystal can be expressed as a sum of contribution from the displacements of the charged ions and from the displacements of electrons relative to their ionic nuclei
electron i ion i P P P (2-13) and
i i ion e U V N P , (2-14)where i is the label of Cartesian coordinate, N is the number of primitive cells in the crystal volume V and e is the charge of the
th ions in a primitive cell, all ions ofthe same label suffering the same displacementU.
It is convenient to express the ionic polarization in terms of the normal coordinates. The polarization is a vector, and the vibrational modes that contribute to the polarization are limited to those with the same symmetry character as a polar vector. These polar modes can be chosen so that their contributions to the polarization are parallel to principal axes of the susceptibility tensor. Let be a
unit vector parallel to the polarization contributed by the displacement of normal coordinatesW. Then one of the Cartesian components i
is unity and the other two are zero. The ionic polarization can be written as
W Z V N Pi i ion , (2-15)
2 1 * M c e Z i i , (2-16)whereZ is the effective charge of the normal mode
and the mass of the
thatom is denoted by M. By simplifying equations of motion, we obtain
W ci Ui
W 12 , (2-17)
where the transformation coefficients can be chosen to satisfy the orthonormality relations ' ' *
ci ci . (2-18) The presence of an electric field E modifies the harmonic oscillator equation of the normal modes toi iE Z W W W 2 . .. . (2-19) The applied electric field of frequency
, therefore, produces a steady-state normal-mode amplitude, i E Z W i i 2 2 , (2-20)and the ionic polarization can be written in a form proportional to the electric-field components. We assume that
is in the vicinity of the vibrational frequencies and well below the frequencies of all electric transitions. The relative permittivity is then
i V NZ i i i 2 2 0 2 2 / , (2-21) where i is a constant electric contribution to the relative permittivity, so that
i i
i
electron E
P 0( 1) . (2-22) The electric field and polarization of any electromagnetic wave frequency
and wavevector q will satisfy the Maxwell’s equation :2 2 2 2 2
0c q q E( ) 0(c q )E P.
(2-23) This equation is unfortunately very complicated in its most general form, but simplification can be made for most applications. The most striking simplification occurs when the frequency and wavevector satisfy cq. We obtained
0 2 2 2 y y z z x xq q . (2-24) By combining the equation for the divergence of the electrical displacement,
, 0 ) ( 0 E P q (2-25) with Eqs. (2.23) and (2.24), we can obtain the general representation
) ( ) ( ) ( 2 2 2 0 .. z z y y x xq q q V W q Z q NZ W W
, (2-26)where
is summed over all the polar modes. In cubic symmetry crystal, the polar-vector representation is threefold degenerate. The crystals are optically isotropic and the principal axes are not restricted to lie in any particular directions. For any direction of the wavevector of a threefold polar mode, it is permissible to choose two of the polarization vectors perpendicular to q and the third parallel to q. The two transverse polar modes have a frequency determined by the standard lattice dynamics calculation. The longitudinal polar mode has the associated macroscopic electric field, and its frequency is determined by the equation above, which reduces to
0
(2-27) in the cubic case. The simplest cases to consider first are the cubic crystals that have a single threefold polar mode. The relative permittivity has the isotropic form
, / 2 2 0 2 i V NZ T (2-28) where the mode frequency is replaced by0 to emphasize its transverse nature T
and redundant subscripts and superscripts are omitted. The longitudinal frequency obtained from the equation mentioned above with the damping removed is
, ) ( 0 12 T L (2-29) where is the zero-frequency value of the relative permittivity 0
. 2 0 2 0 T V NZ (2-30) This expression for the longitudinal frequency is the Lyddane-Sachs-Teller relation. The equation of motion for the longitudinal mode takes the form
, 0 2 2 .. V W NZ W W T (2-31)
and leading to . 0 2 2 2 V NZ T L (2-32)
Resta et al. [3] have shown that polarization is linear in the change of the position vector of the basis atom to a good approximation. The Born effective charge tensor * m Z is rewritten through
N m m m u Z e P 1 * . (2-33) Here, N is the number of atoms in the primitive unit cell, is the first-order um change of the position vector of themth basis atom, and
is the volume of the unit cell.The Born effective charge tensor reflects the effects of the Coulomb interactions and is directly related to the LO-TO splitting. The general representation of the dynamical material for LO and TO modes at q =0 are the related by
0 * * 2 4 m n TO mn LO mn Z Z e D D , (2-34)
where D represents the dynamical matrix and is proportional to the square of the vibration frequency. Zhong, et al.[4] and Waghmare, et al. [5] have calculated that the softest TO mode is most associated with the hardest LO mode via Coulomb interaction to give rise to giant LO-TO splitting in ABO3 compounds, especially for the ferroelectric phonon modes.
2.4 Optical transitions of rare earth doped materials and
upconversion
2.4.1 Fundamental optical transitions
Trivalent rare-earth (RE) ions are well known for their special optical properties, which result from the fact that the electrons of the partially filled 4f-shell are shielded from the surrounding completely filled 5s and 5p shells. The energy levels of the 4f-shell have equal parity, and hence electric dipole transitions are forbidden. In a solid, the slight mixing with odd-parity wavefunctions makes the transition slightly allowed. The influence of the electric field around the ion removes the degeneracy of the 4f-levels, resulting in a Stark-splitting of the energy levels. However, due to the shielding by the outer lying shells, the magnitude of the splitting is small, resulting in relative narrow emission lines, of which the wavelength is almost independent of the host material.
The energy levels of the 4f-level arise from spin-orbit interactions and are often denoted using Russel-Saunders notation 2S+1LJ, in which S is the total spin angular momentum, L is the total orbital angular momentum quantum number and J the magnitude of the total angular momentum, J-L+S according to vector model. There exist 14 rare-earth elements, that all have a different number of electrons in the incompletely filled 4f-shell. As a result, each rare-earth ion has its own specific energy levels, and hence typical luminescence lines. The rare-earth ion erbium (Er) has transition at 1.53 μm, which is the standard wavelength used in optical
telecommunication. The energy level scheme of trivalent RE ions was presented in the classic work by Dieke and Crosswhite [6] and then was reproduced in many reviews. Figure 2.3 has shown the energy levels and laser transitions of trivalent rare-earth ions.
As already mentioned, the choice of host material in rare-earth doped components does not influence significantly the position of the energy levels of the
rare-earth ions.
Therefore, in principle any material that little absorption at the pump and emission wavelengths can be used. Many different rare-earth doped materials have been Figure 2.3: Energy level diagram of PLT:Er+3 thin films [6].
studied, like pure SiO2, silicate and phosphate glasses, LiNbO3, Al2O3, and GaN. By combing the excellent opto-electric properties and chemical stability, ferroelectric perovskite (Pb0.7La0.3TiO3) is being considered in our research.
2.4.2 Upconversion
Upconversion (UC) in rare-earth (RE) ion-doped materials has been intensively studied in recent years of applications in laser devices [7], three-dimensional display
[8], sensors [9], and biological fluorescent labels [10-12]. Energy UC of radiation can exist by intra-ionic successive absorption, cooperative energy transfer, and photon avalanche processes [13, 14]. The research of these mechanisms provides intellects on the physics of energy transfer processes and fluorescence converters. Recently, green and red UC radiation induced by a 980-nm diode laser excitation in Er3+-doped and Er3+—Yb3+ co-doped Y2O3 and ZrO2 nanocrystals were reported [15-17]. It is known that the Er3+ ion absorbs one laser photon and jumps from the ground state
4I
15/2 to the long-lived 4I11/2 state, which is termed the ground-state absorption (GSA). Then, the excited-state absorption (ESA) could happen to populate 4F7/2 state. Subsequently, the Er3+ ions at 4F7/2 state could further rapidly relax to the 2H11/2 / 4S3/2 state by multiphonon processes, from which the green UC emission arises. Thus, the green UC emission is a result of two-photon excitation (GSA followed by ESA) process. The codoped Yb3+ ions provide excitation of the 4I11/2(Er3+) state by the
larger absorption cross section of Yb3+ ions.
The strong red UC emission is reported enabled by quenching the 4S
3/2(Er3+) state to the saturation of the 4I
13/2(Er3+) state through the so-called efficient energy back-transfer (EBT) process. [17] Through the exciting the nearest-neighboring Yb3+ ion at the ground state 2F
7/2(Yb3+) to the 2F5/2(Yb3+) state, the excited Er3+ ion located at the 4S
3/2(Er3+) state, which originally emits green UC radiation, will transit
to the 4I
13/2(Er3+) state. This excitation was expressed as: 4S3/2(Er3+) + 2F7/2(Yb3+) →
4I
13/2(Er3+) + 2F5/2(Yb3+) and the energy diagram schematically presented in Figure 4 of Ref. 17 was duplicated in Figure 2.4 for making explanation clearer. Chen, et al.
[17] reported that the energy mismatch in the EBT process is about 320 cm−1 and can be easily dissipated by one phonon of the ZrO2 lattice (470 cm−1). The excited Figure 2.4: Energy level diagram of Er3+ and Yb3+ ions as well as the proposed mechanisms to produce UC spectra [17].
4 I15/2 4 I13/2 4 I11/2 4 I9/2 4 F9/2 4 S3/2 4 H11/2 4 F7/2 Er3+ Er3+ + Yb3+ 2 F7/2 2 F5/2
2F
5/2-Yb3+ ions can be further dissipated by another excitation that the Er3+ ions transited from the ground state to the 4I
11/2(Er3+) state then further relaxed to the long-lived 4I
13/2(Er3+) state by the EBT process. The higher Yb3+ ion concentration could provide the more Yb3+ ions nearly neighboring to the Er3+ ions to cause the efficient EBT process. The 4I
13/2-Er3+ ion subsequently absorbs a laser photon from the 4I
13/2(Er3+) state or directly relaxes from the high-lying states to populate 4F9/2(Er3+) state that the red UC emission arises. Thus, the efficient red UC radiation requires not only Yb3+ concentration but also level match of 4S
3/2→4I13/2 in Er3+ and
2F
7/2→2F5/2 in Yb3+ under assistance of phonon for efficient EBT process. Therefore, the red UC emission would be a mixing process of one-photon process [12] through the efficient EBT process and two-photon process through relaxing from the high-lying states after GSA and ESA.
2.5 Multiferroic magnetoelectrics
[18]The magnetoelectric response is the appearance of an electric polarization upon applying a magnetic field and/or the appearance of magnetization upon applying an electric field. This magnetic-field- induced electric polarization has been observed as an intrinsic effect at low temperature and high magnetic field in some natural material systems (e.g., in RMnO3 with R=Tb, Dy [19-21]). Alternatively and with