University students’ perceptions of and attitudes toward (online) peer assessment
MEICHUN LYDIA WEN1 AND CHIN-CHUNG TSAI2
1
Graduate Institute of Science Education, National Changhua University of Education, ChangHua, Taiwan;2Institute of Education & Center for Teacher Education, National Chiao Tung University, Hsinchu, Taiwan (E-mail: cctsai@mail.nctu.edu.tw)
Abstract. The use of peer assessment (PA) as an alternative form of evaluation method is reported to be helpful in learning and is increasingly being adopted in higher education settings. Through collecting data from 280 university students in Taiwan, a 20-item instrument was developed to investigate university students’ attitudes toward and perceptions of PA and online PA. Four subscales, Positive Attitudes, Online Attitudes, Understanding-and-Action, and Negative Attitudes, were extracted and reliabilities were calculated. Results revealed that participating students held positive attitudes toward the use of PA activities, but they viewed online PA as a technical tool to facilitate assessment processes, rather than as a learning aid. Male students had more positive attitudes toward PA than females did, and students with previous PA experiences had less negative attitudes toward PA. A majority of these students sug-gested that the PA score should be counted as a small part of the total course grade, and there was an effect of the perceived importance of PA score on students’ attitudes toward these four subscales.
Keywords: university students, attitude, peer assessment, online peer assessment, Internet, instrument development.
Introduction
Recently, the use of peer assessment (PA) as an alternative form of evaluation method has profoundly changed the role of assessment itself. PA is found to increase student–student and student–teacher interac-tions, and can be used to enhance learner’s understanding about other students’ ideas during the learning experience (Butler and Hodge 2001; Falchikov 1995; LeMare and Rubin 1987; McGourty 2000; Sluijsmans et al. 1999). PA can increase learners’ understanding in the cognitive and metacognitive domains, and develop social and transferable skills (Topping 1998). Using the Internet in aid of PA can improve the free-dom of time and space for learners (Tsai et al. 2001a), increase the effectiveness of learning (Rubin 2002), and may also promote students’ attitudes toward PA by utilizing anonymous online marking and DOI 10.1007/s10734-004-6375-8
feedback. The present paper reports the development of an instrument to investigate university students’ attitudes and perceptions toward PA in general, and toward online PA activities, in particular.
Related literature
Peer assessment in general
Academic assessment serves several purposes. For example, Boud (1990) argues that assessment of students ‘intends to improve the quality of learning . . . [and] the accreditation of knowledge or perfor-mance’ (p. 102). In turn, these two purposes can be differentiated in terms of formative assessment, which serves students’ learning needs, and summative assessment, which serves the needs of the society to evaluate the end-result of schooling. Boud argued that the need for the formative assessment is usually neglected, and alternative assessments should be developed in order to improve student learning. Assessment methods are found to be associated with students’ learning approaches (Scouller 1998); therefore, teachers should carefully choose ordinary and alternative assessment tools to enhance student learning. Alterna-tive methods of assessment, including self, peer, and collaboraAlterna-tive assessments, are designed to develop active, autonomous, responsible, and reflective learners (Sambell and McDowell 1998), and these meth-ods have been reported to help students’ understanding of their own learning (Sluijsmans et al. 1999).
Peer assessment recently has been often used as an alternative assessment method, particularly in higher education. PA can be defined as the process whereby groups of individuals rate their peers (Falchikov 1995), and this process may involve various types of activities such as peer feedback and peer learning. Falchikov (2001) further distinguishes these related terms about PA.
In peer assessment, members of a class grade the work or performance of their peers using relevant criteria . . . In peer feedback, students engage in reflective criticism of the work or performance of other students using previously identified criteria and supply feedback to them . . . In peer learning, students learn with and from each other, normally within the same class or cohort . . . (pp. 2–3).
In the process of PA, students are able to observe their peers and of come to better understanding of how their peers learn. Sluijsmans
et al. (1999) have reviewed research articles regarding PA and have concluded that the process of PA engages learners in judgment mak-ing. Besides rating or marking, PA is also a part of learning experi-ences. Throughout the PA process, students learn to develop high levels of responsibility and to focus on learning itself. PA also provides the learners a context where they can observe the role of their teachers and understand the nature of assessment (Hanrahan and Issacs 2001). PA helps students to learn about learning and, therefore, enhances students’ metacognitive understanding about their own learning pro-cess.
Related studies show that students generally display a liking for PA activities because these activities provide an opportunity for comparison of student work, but they are much less appriciative of criticism from peers (Brindley and Scoffield 1998; Cheng and Warren 1997; Paquet and Des Marchais 1998; Smith et al. 2002; Williams 1992). Teachers also agree on the helpfulness of PA in learning and relevant evaluation techniques (Zevenbergen 2001). However, studies also show a lack of self-confidence by students when rating their peers (Sullivan et al. 1999), and the need for a pre-existing guideline or rule for the assessment activity (Orsmond and Merry 1996).
Clifford (1999) devised a learner-controlled learning environment and utilized both peer- and self-assessment techniques to help students develop autonomy. The researcher surveyed students’ attitudes toward PA and reported that students found PA activities educative, but they also felt frustrated without clear frameworks and guidance. Further-more, these students viewed grading as the teacher’s responsibility be-cause they wished to stay away from ‘the process of evaluating . . . peers’ performance where marks are concerned (p.122).’
Research studies also draw attention to the validity issue associated with the PA assessment process (Arnold et al. 1981; Sluijsmans et al. 1999). In a comprehensive review, Topping (1998) tried to collect re-search studies related to the issue of reliability and validity of PA. Topping’s qualitative review found conflicting results in that many studies proposed high validity, but still a few revealed low validity of PA. Consequently, the validity issue of PA is still a concern for evalu-ating student learning. Falchikov and Goldfinch (2000) conducted a similar review using quantitative meta-analysis to compare peer and teacher marks, and they also pointed out the issue of PA validity and the importance of a well-organized criterion or guideline when imple-menting PA. Hence, an exploration about students’ views about the validity and the need of providing relevant criteria of implementing PA
is quite important when probing students’ perceptions about PA activities.
Computer- or Internet-assisted peer assessment
Integrating instruction with the Internet is one of the current trends in education at all levels. Davies (2000) suggests that the problems of increased teacher workloads and class size, as well as delays in the grading procedure, could be solved by the introduction of computer-aided assessment. Davies investigated a group of undergraduate stu-dents after they participated in a computerized PA project, and found that non-anonymous PA was negatively perceived by these students, and this could be associated with the difficulty of criticizing or rating their peers. However, other research has suggested that anonymous assessment could provide more truthful and appropriate attitudes toward the assessment processes (Ballantyne et al. 2002; Lejk and Wyvill 2001). The implementation of computerized or online PA activities can not only speed up grading time and provide more meaningful feedback (McGourty 2000), but also makes anonymous PA possible. Using the Internet as a tool for implementing PA can provide learners with an anonymous environment to freely express their thoughts and ideas about other students’ work, and students can interact with the teacher and other students with less restriction of location and time (McConnell 2002; Rubin 2002; Topping 1998; Tsai et al. 2001a, 2002).
Another concern for the PA process is with gender differences in the grading procedure (Falchikov and Magin 1997). In a study of group PA (Johnson and Smith 1997), female university students received lower PA marks than male students, even though their marks from staff were higher than their male counterparts. In addition, females are usually perceived as less competent or confident in and less motivated toward the use of technology compared to males (Spotts et al. 1997; Tsai et al. 2001b) with few exceptions (Clegg et al. 2000). Few studies have focused on investigating students’ perceptions of online PA specifically, and there is a need to examine the gender difference in students’ attitudes toward online PA.
Based on the literature above, we developed an instrument that sought to examine university students’ perceptions of and attitudes to-ward online PA. Demographic information and students’ perceived importance of the PA score in relation to total course grade were also
gathered for further analysis. In addition, gender differences in per-ceptions and attitudes were explored.
The study
Sample
The participants in the study were 280 university students from two large national universities in Northern Taiwan. One of the universities is a teacher preparation institution and the sample was from the College of Science; the other university is more science/research-oriented, and the sample was from the Center for Teacher Education. The majority of the participants were studying for undergraduate degrees (85.1%), and only 14.9% were graduate school students. Male students constituted 58.1% of the total sample, and the remaining 41.9% were female students. Most of the participants (80.4%) majored in science, 4.6% majored in engineering, 5% majored in business, and 3.2% majored in art/social sciences. This uneven distribution is due to the sampling procedure, and caution is therefore necessary in generalising to non-science students.
Instrument and procedure
Although peer learning and assessment involves many different types of activities, as already noted, the current study defines PA as any peer-involved assessment activities. To understand what university students think about PA and online PA, we developed a 34-item, 5-point Likert-scale questionnaire based on previous studies by other researchers (e.g., Brindley and Scoffield 1998; Cheng and Warren 1997; Falchikov 1995; Paquet and Des Marchais 1998; Stanier 1997). The response was coded as 1¼ strongly disagree to 5 ¼ strongly agree. A further item (i.e., item 30) sought students views on the proprotion of the total grade that should be contributed by PA and the options were: PA scores should (A) not be counted, (B) counted as a small portion of the total course grade, (C) counted as a half of the total course grade, (D) counted as a large portion of the total course grade, and (E) counted as 100% of total course grade. Another item (i.e., item 1) asked about students’ past experiences of participation in PA activities. About 41.0% of partici-pants had no previous PA experiences, and 59% had PA experiences in the past.
An exploratory factor analysis with Varimax rotation was conducted to validate this instrument using SPSS v.11.0. Case-wise deletion was used for missing values. Subscales were extracted from the factor analysis, and subscale scores were obtained by adding the scores from the items of the same subscale and then dividing by the number of items in that subscale. The resulting subscale scores were used in t-tests as the dependent variables to analyze the individual effect of the following factors on students’ attitudes toward PA: (1) gender (male or female), (2) education level (undergraduate or graduate school), and (3) past experience of PA (yes or no). The effect of the perceived importance of PA score, as assessed by the aforementioned additional item (item 30), on the subscales was also examined via analysis of variance (ANOVA) method.
Findings
Instrument validation
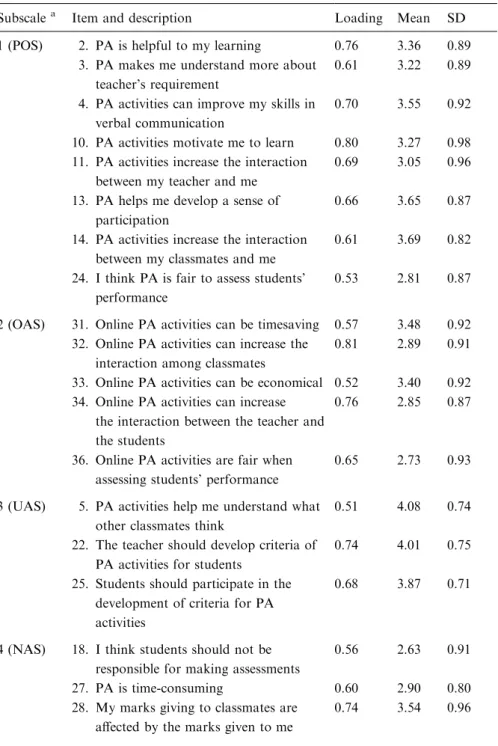
The exploratory factor analysis yielded 4 subscales and 20 items (Table 1) and the model can explain 54.58% of the total variances. Item 1 (demographical information of participants) and item 30 (perceived importance of PA score) were not included in the factor analysis. Based on characteristics they shared, the four subscales were consequently named as (1) Positive Attitude Subscale (POS), (2) Online Attitude Subscale (OAS), (3) Understanding-and-Action Subscale (UAS), and (4) Negative Attitude Subscale (NAS). POS contains eight items related to students’ positive attitudes toward PA in general. These items asked students’ perception of the helpfulness of PA in learning, in enhancing classroom interactions, and the fairness of PA. OAS is comprised of five online-related items, including the advantage of using online PA to save time and money, the increase in classroom interactions, and the fairness of online PA. UAS includes three items about student understanding of other’s ideas and of what to do in the activity, which are all related to students’ understanding of how to act accordingly. The last subscale, NAS, has four items describing PA in a negative sense. These items described students’ perception of who is responsible for assessment, the time-consuming aspect of PA, and the biased effect of peer mark on participants’ marks to peers.
The reliability of the POS subscale (alphaPOS) was 0.86, reliability of OAS (alphaUAS) was 0.74, reliability of UAS (alphaNAS) was 0.63,
Table 1. Subscales descriptions, factor loadings, and descriptive statistics by item Subscalea Item and description Loading Mean SD
1 (POS) 2. PA is helpful to my learning 0.76 3.36 0.89 3. PA makes me understand more about
teacher’s requirement
0.61 3.22 0.89 4. PA activities can improve my skills in
verbal communication
0.70 3.55 0.92 10. PA activities motivate me to learn 0.80 3.27 0.98 11. PA activities increase the interaction
between my teacher and me
0.69 3.05 0.96 13. PA helps me develop a sense of
participation
0.66 3.65 0.87 14. PA activities increase the interaction
between my classmates and me
0.61 3.69 0.82 24. I think PA is fair to assess students’
performance
0.53 2.81 0.87
2 (OAS) 31. Online PA activities can be timesaving 0.57 3.48 0.92 32. Online PA activities can increase the
interaction among classmates
0.81 2.89 0.91 33. Online PA activities can be economical 0.52 3.40 0.92 34. Online PA activities can increase
the interaction between the teacher and the students
0.76 2.85 0.87
36. Online PA activities are fair when assessing students’ performance
0.65 2.73 0.93
3 (UAS) 5. PA activities help me understand what other classmates think
0.51 4.08 0.74 22. The teacher should develop criteria of
PA activities for students
0.74 4.01 0.75 25. Students should participate in the
development of criteria for PA activities
0.68 3.87 0.71
4 (NAS) 18. I think students should not be responsible for making assessments
0.56 2.63 0.91 27. PA is time-consuming 0.60 2.90 0.80 28. My marks giving to classmates are
affected by the marks given to me
reliability of NAS (alphaNAS) was 0.64, and the composite reliability of this 20-item instrument (alphacomposite) was 0.80. These reliability values all reached satisfaction. Descriptive statisics for the 4 subscale scores are presented in Table 2. UAS subscale had the highest mean score among the four, followed by POS score, OAS score, and NAS had the lowest subscale score. Subsequent t-tests comparing the subscale scores with the value 3 indicated that students had significant positive attitudes toward POS and UAS, and neutral attitudes toward OAS and NAS.
The correlations among these 4 subscales (Table 3) showed that POS is positively correlated with OAS and UAS, and is negatively correlated with NAS. OAS and UAS also positively correlate with each other. The absolute values of these statistically significant correlations range from 0.19 to 0.46, indicating low to moderate relationships among the sub-scales.
Education level, gender, and past-experience effects
Results from t-tests (Table 4) showed that education level made no difference in students’ attitudes toward these 4 subscales. There was a Table 1. (continued)
Subscalea Item and description Loading Mean SD
29. If I receive marks worse than I expected, then I will give lower marks to classmates
0.79 2.90 1.01
a
Reliability alphaPAS= 0.86; alphaOAS= 0.74; alphaUAS= 0.63; alphaNAS= 0.64;
alphacomposite= 0.80, n = 257.
This analysis did not include Item 1 (demographical information) and item 30 (the perceived weight of PA).
Table 2. Descriptive statistics and one-sampled t-values of 4 subscale scores
Subscale Valid N Mean SD t-value
POS 264 3.33 0.64 8.42*
OAS 269 3.07 0.64 1.88
UAS 266 3.99 0.56 29.03*
NAS 267 2.99 0.64 )0.29
statistically significant gender effect on students’ attitudes toward POS, and a past-experience effect on attitudes towards NAS. As presented in Table 5, female students held less positive POS attitudes than male students. Students with past PA experiences had a lower NAS score than those who had no experiences before.
POS versus OAS
To investigate the possible differences between students’ attitudes to-ward PA in general and toto-ward online PA in particular, a paired-sample t-test was conducted to compare the scores of POS (mean¼ 3.33, SD¼ 0.64) and those of OAS (mean ¼ 3.07, SD ¼ 0.63). The results revealed that students held significantly more positive attitudes toward POS than OAS (t¼ 6.30, p < 0.01).
When comparing POS versus OAS subscale items, the following 2 pairs of items are related to each other: (1) item 11 of POS and item 34 of OAS were investigating students’ perceptions of whether PA activities increased teacher/student interactions, and (2) item 24 of POS and item 36 of OAS were about the fairness of PA. Two pair-sampled t-tests were administered for each pair of responses, and students’ response to item 11 was statistically significant higher than their response to item 34 Table 3. Correlations among the 4 subscales
OAS UAS NAS
POS 0.46* 0.44* )0.19*
OAS 0.19* )0.08
UAS 0.10
* p < 0.01.
Table 4. t-Values of effects of education level, major, gender, and past experience on 4 subscales
Subscale POS OAS UAS NAS
Education level 1.74 0.17 0.48 0.18
Gender 2.41* 0.32 0.88 0.79
Past experience 0.32 )1.16 )0.75 2.62**
(t¼ 2.715, p < 0.01). The statistical comparison between students’ response to item 24 and item 36 was not significant (t¼ 0.90, p ¼ 0.37).
Responses to OAS
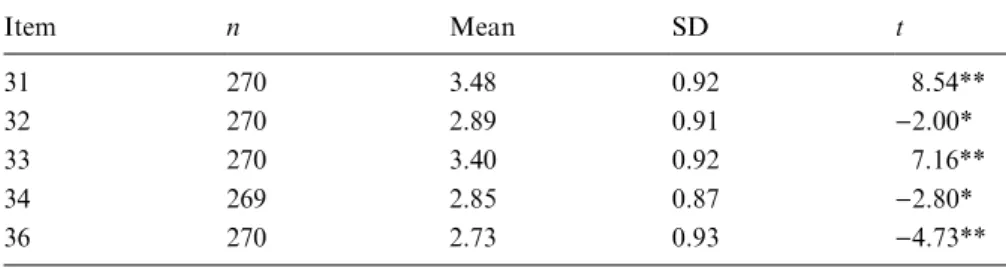
A detailed descriptive analysis of students’ responses in the OAS sub-scale is presented in Table 6. Item 31 asked the students if online PA could be timesaving; item 32 asked students if online PA can increase classmates’ interaction; item 33 inquired if online PA can be economi-cal; item 34 asked if online PA could increase student–teacher interac-tion; item 36 questioned students the fairness of online PA activities. One-sample t-tests were conducted to compare the mean of students’ responses to these items with the value 3 (3¼ neutral attitude), which confirmed that students were positive toward the online PA’s advan-tages to save time and money (items 31 and 33); however, they held a statistically negative position about the benefits online PA can bring to increase classroom interactions and the fairness of the activities (items 32, 34 and 36).
Table 5. Descriptive statistics of the t-tests
Subscale Independent variable Mean SD
POS Gender
Male 3.41 0.62
Female 3.22 0.64
NAS Past experience
Yes 2.90 0.63
No 3.11 0.64
Table 6. Descriptive statistics and one-sample t-tests of OAS item responses
Item n Mean SD t 31 270 3.48 0.92 8.54** 32 270 2.89 0.91 )2.00* 33 270 3.40 0.92 7.16** 34 269 2.85 0.87 )2.80* 36 270 2.73 0.93 )4.73** *p <0.05, **p < 0.01.
Perceived importance of PA score
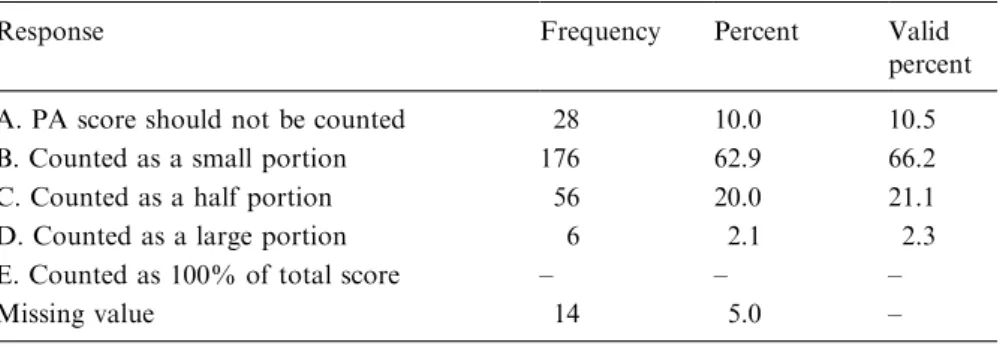
Item 30 of the questionnaire explored students’ perceived importance of PA scores as compared to the total course grade. A frequency report of participants’ responses to item 30 is presented in Table 7. Approxi-mately 10.5% of the participants thought PA score should not be counted in the total course grade (choice A), over half of the partici-pants (66.2%) supported the PA score being weighted as a small part of the total course grade (choice B), and 21.1% of the participants thought PA score should have a 50% weight (choice C). Only 2.3% of partici-pants chose that PA score should be counted as a large portion of the total course grade (choice D), and none of the participants support total reliance on PA score (choice E).
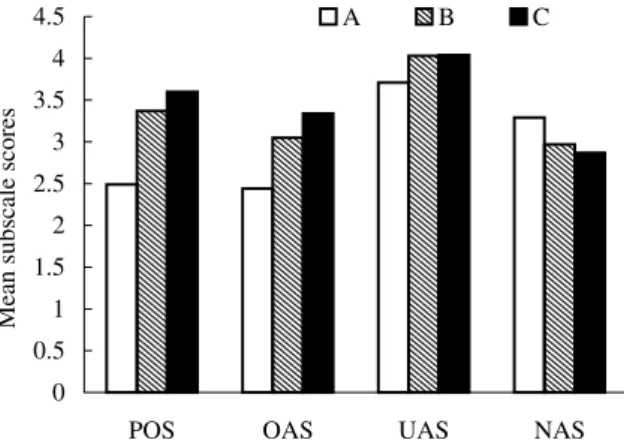
A consequent ANOVA was conducted to examine the effect of stu-dents’ responses to item 30 on the 4 subscales. Participants who chose A, B, and C in item 30 were selected for the study because the sample size in choice D and E was too small. Post hoc comparisons were fol-lowed using Scheffe’s tests for unequal group sizes. The result of the ANOVA is displayed in Table 8, and the post hoc analysis is shown in Table 9. For all 4 subscales, participants responding A, B, or C to item 30 had different subscale scores from each other. In the POS and OAS subscales, participants who chose C had significantly better attitudes high POS score than those who chose B, who in turn had high scores than those who chose A (Figure 1). In the UAS subscale, participants who chose B or C held more positive attitudes toward PA than those who chose A. In the NAS subscale, those who chose A had higher NAS score than those choosing C.
Table 7. Frequencies of students’ responses in item 30
Response Frequency Percent Valid
percent A. PA score should not be counted 28 10.0 10.5
B. Counted as a small portion 176 62.9 66.2
C. Counted as a half portion 56 20.0 21.1
D. Counted as a large portion 6 2.1 2.3
E. Counted as 100% of total score – – –
Discussion
After the exploratory factor analysis, the original 34-item questionnaire was reduced to a 20-item, 4-subscale instrument to assess students’ perceptions of and attitudes toward PA (see Table 1). Because indi-vidual differences and preferences may vary from one subscale to the next, and because the nature of these items does not require stable and concrete feedback from each participant, we felt content with the capacity of this new instrument to explain over 54% of the total vari-ance. Furthermore, the composite and individual subscale reliabilities all achieved satisfaction. For social science studies, some researchers
Table 8. ANOVA of effect of item30 response on 4 subscales
Subscale Effect SS df MS F POS Between 24.42 2 12.21 38.92** Within 80.00 255 0.31 Total 104.42 257 OAS Between 14.58 2 7.29 21.58** Within 58.15 252 0.34 Total 99.74 254 UAS Between 2.48 2 1.24 4.11* Within 76.85 255 0.30 Total 79.33 257 NAS Between 3.29 2 1.64 4.09* Within 103.35 257 0.40 Total 106.63 259 * p < 0.05, **p < 0.01.
Table 9. Scheffe’s post hoc analysis of item30 response and 4 subscales
A–B B–C A–C Group effect
POS )0.89** )0.23* )1.12** C > B > A
OAS )0.61** )0.30** )0.90** C > B > A
UAS )0.31* )0.01 )0.32* B > A, C > A
NAS 0.31 0.10 0.42* A > C
Note: A = PA scores should not be counted; B = counted as a small portion of the total score; C = counted as a half of the total score.
have claimed that an alpha reliability coefficient as 0.55 can be recog-nized and acceptable for further statistical analyses (Hatcher and Ste-panski 1994). This study is an initial attempt to investigate PA, so the reliability measures ranging from 0.63 to 0.86 were considered satis-factory. However, future revision of this instrument is necessary, and researchers can refine this instrument based on this study to accom-modate individual research needs. Results also showed low to moderate correlations among the four subscales, which implied that these sub-scales could identify different domains of students’ perceptions of and attitudes toward PA.
The average scores of each subscale and subsequent t-tests showed that participating students had a positive attitude toward general PA activities (POS, mean¼ 3.33, SD ¼ 0.64) and they perceived that PA guidelines were helpful for their understanding of the PA activity (UAS, mean¼ 3.99, SD ¼ 0.56). Comparing to the value 3, however, they had neutral attitudes toward online PA, indicating that they, on average, were neither positive nor negative toward the use of online PA activities (OAS, mean¼ 3.07, SD ¼ 0.64). Similarly, they had neutral perceptions of the negative aspects of PA (NAS, mean¼ 2.99, SD ¼ 0.64), dem-onstrating that these university students on average neither agreed nor disagreed with these negative aspects of PA. One may argue that POS items in this study probably measured students’ personal perceptions while OAS items investigated general attitudes, but the authors are of the belief that OAS is still a plausibly distinct domain, which helps to explain students’ ideas about using PA online.
0 0.5 1 1.5 2 2.5 3 3.5 4 4.5
POS OAS UAS NAS
Mean subscale scores
A B C
Using the data reduced from the factor analysis, we conducted sev-eral t-tests and found a gender difference on POS, but not on other subscales (OAS, UAS, or NAS). This interesting result showed that male students were more positive toward PA in general. Related research (Fitzpatrick 1999) reported that female students felt less self-competent to rate their peers than male students did during PA activi-ties. Therefore, male students feel more comfortable in rating their peers, while their female peers feel more awkward and hold less positive attitudes. Besides the gender difference in POS found above, however, female students held a similar attitude towards OAS as male students did, indicating female students were not afraid of using the Internet as a tool for implementing PA. This finding leads us to assert that online PA can be used more frequently because it will not be likely to cause female students to resist the use of technology in learning.
Past experience also plays a role in students’ NAS scores. Students who had used PA before had lower scores in NAS than those who had never tried, indicating that students with past experiences showed less negative attitudes toward PA than students with no experiences. This implies that the actual implementation of PA activities can improve students’ reluctance to participate in similar activities.
The paired-sample t-test of POS and OAS yielded statistically sig-nificant differences, indicating that students had more positive attitudes toward PA in general than towards online PA. In addition, the com-parison between item 11 and item 34 yielded a significant difference in students’ responses, and students held more positive attitudes toward general PA’s advantage of increased teacher/student interaction than toward that of online PA. These differences may be contributed to the lack of trust in the use of the Internet, or even to the lack of online PA experiences. Further research is required to explain this difference and to explore the effect of having online PA experiences on learners’ atti-tudes toward OAS.
An itemized analysis of the descriptive information from the OAS subscale showed that students agreed that online PA could save time and money. But they did not perceive that online PA activities were beneficial in increasing interactions in the classrooms, nor did they have confidense in the validity of online PA. It is possible that students treated the online PA method only as a technical tool to facilitate communications and to upload and download assignments and class-room information, rather than a process of learning and sharing expe-riences. If so, then online PA is perceived only as an environment for information delivery and communication. Therefore, when
implement-ing online PA, educators need to design appropriate strategies to help students focus more on the learning processes engaged in PA activities, not simply on the technical support of the Internet technology.
Finally, the results from item 30 showed how important these stu-dents saw the PA score in relation to the final course grade. Clearly, most students would prefer the PA score to constitute a minor portion of the final score, and none of the students favoured total reliance on the PA score itself. These results might lead us to conclude that, on the one hand, the university students involved in the study perceived a major part, if not all, of the responsibility of grading should belong to the teacher/instructor. On the other hand, they also respected peers’ judg-ments about their own performance. This finding concurs with many other studies (Brindley and Scoffield 1998; Clifford 1999), suggesting that more effort needs to be placed on giving students responsibilities for grading, to develop a sense of learner control and ownership of their own learning, especially in higher education. However, this study did not distinguish PA activities between PA with grades and PA without grades, and this difference should be addressed in future research.
Conclusions and future research
This study developed an instrument containing four subscales to mea-sure students’ perceptions of and attitudes toward PA in general and online PA in particular. This instrument was validated with desirable reliability. Subsequent analyses found that university students generally held positive attitudes toward general and online PA activities, but they generally seemed to considered online PA as a technical tool rather than a learning aid.
This instrument could be used in the future to examine students’ attitude change before and after a PA (or an online PA) activity. Obvi-ously, some further interviews with students, coupled with the use of this instrument, may provide a fuller understanding of how and why students view online PA methods in the context of learning. One may also argue that different online PA activities may have different effects upon stu-dents’ acceptance of PA; however, this point needs further research to clarify. More research integrating the use of interviews and quantitative instruments, such as the one developed in this study, may also reveal students’ views toward PA feedback using online interfaces and the relationship between feedback and learning processes/outcomes as mentioned by research studies (Lin et al. 2001; Tsai et al. 2002).
Future research could helpfully focus on how to assist students in providing useful feedback in the process of PA activities and how to enhance the validity of PA. Such studies might also emphasize the instructor’s role in PA and online PA and help teachers to carefully monitor and manage the PA processes, perhaps through the assistance of online databases.
Acknowledgement
Funding of this research work is supported by Ministry of Education (grant number E020-90B858) and National Science Council (grant number NSC 91-2511-S-009-006), Taiwan.
References
Arnold, L., Willoughby, L., Calkins, V., Gammon, L., and Eberhart, G. (1981). ‘Use of peer evaluation in the assessment of medical students’, Journal of Medical Education 56, 35–42.
Ballantyne, R., Hughes, K., and Mylonas, A. (2002). ‘Developing procedures for implementing peer assessment in large classes using an action research process’, Assessment & Evaluation in Higher Education27, 427–441.
Boud, D. (1990). ‘Assessment and the promotion of academic values’, Studies in Higher Education15, 110–113.
Brindley, C. and Scoffield, S. (1998). ‘Peer assessment in undergraduate programmes’, Teaching in Higher Education3, 79–89.
Butler, S.A. and Hodge, S.R. (2001). ‘Enhancing student trust through peer assessment in physical education’, Physical Educator 58, 30–41.
Cheng, W. and Warren, M. (1997). ‘Having second thoughts: Student perceptions before and after a peer assessment exercise’, Studies in Higher Education 22, 233–239. Clegg, S., Trayhurn, D., and Johnson, A. (2000). ‘Not just for men: A case study of the
teaching and learning of information technology in higher education’, Higher Education40, 123–145.
Clifford, V.A. (1999). ‘The development of autonomous learners in a university setting’, Higher Education Research & Development18, 115–128.
Davies, P. (2000). ‘Computerized peer assessment’, Innovations in Education and Teaching International37, 346–355.
Falchikov, N. (1995). ‘Peer feedback marking: Developing peer assessment’, Innovations in Education and Teaching International32, 175–187.
Falchikov, N. (2001). Learning Together: Peer Tutoring in Higher Education. London: Routledge Falmer.
Falchikov, N. and Goldfinch, J. (2000). ‘Student peer assessment in higher education: A meta-analysis comparing peer and teacher marks’, Review of Educational Research 70, 287–322.
Falchikov, N. and Magin, D. (1997). ‘Detecting gender bias in peer marking of students’ group process work’, Assessment & Evaluation in Higher Education 22, 385–396. Fitzpatrick, C. (1999). ‘Students as evaluators in practicum: Examining peer/self
assessment and self-efficacy’, Presented at the National Conference of the Association for Counselor Education and Supervision,New Orleans.
Hatcher, L. and Stepanski, E.J. (1994). A Step-by-Step Approach to Using the SAS System for Univariate and Multivariate Statistics. Cary, NC: SAS Institute. Hanrahan, S.J. and Issacs, G. (2001). ‘Assessing self- and peer-assessment: The students’
views’, Higher Education Research & Development 20, 53–70.
Johnson, C.B. and Smith F.I. (1997). ‘Assessment of a complex peer evaluation instru-ment for team learning and group processes’, Accounting Education (JAI) 2, 21–40. Lejk, M. and Wyvill, M. (2001). ‘The effect of the inclusion of self-assessment with peer assessment of contributions to a group project: A quantitative study of secret and agreed assessments’, Assessment & Evaluation in Higher Education 26, 551–561. LeMare, L.J. and Rubin, K.H. (1987). ‘Perspective taking and peer interaction:
Structural and developmental analysis’, Child Development 58, 306–315.
Lin, S.S.J., Liu, E.Z.F., and Yuan, S.M. (2001). ‘Web-based peer assessment: Feedback for students with various thinking-styles’, Journal of Computer Assisted Learning 17, 420–432.
McConnell, D. (2002). ‘The experience of collaborative assessment in E-learning’, Studies in Continuing Education24, 73–102.
McGourty, J. (2000). ‘Using multisource feedback in the classroom: A computer-based approach’, IEEE Transactions on Education 43, 120–124.
Orsmond, P. and Merry, S. (1996). ‘The importance of marking criteria in the use of peer assessment’, Assessment & Evaluation in Higher Education 21, 239–250. Paquet, M.R. and Des Marchais, J.E. (1998). ‘Students’ acceptance of peer assessment’,
Education for Health11, 25–35.
Rubin, L. (2002). ‘‘‘I just think maybe you could. . .’’ Peer critiquing through online conversations’, Teaching English in the Two-Year College 29, 382–392.
Sambell, K. and McDowell, L. (1998). ‘The values of self and peer assessment to the developing lifelong learner’, In Rust, C. (ed.), Improving Student Learning – Improving Students as Learners. Oxford, UK: Oxford Center for Staff and Learning Development, pp. 56–66.
Scouller, K. (1998). ‘The influence of assessment method on students’ learning approaches: Multiple choice question examination versus assignment essay’, Higher Education35, 453–472.
Sluijsmans, D., Dochy, F., and Moerkerke, G. (1999). ‘Creating a learning environment by using self-, peer- and co-assessment’, Learning Environment Research 1, 293–319. Smith, H., Cooper, A., and Lancaster, L. (2002). ‘Improving the quality of under-graduate peer assessment: A case for student and staff development’, Innovations in Education and Teaching International39, 71–81.
Spotts, T.H., Bowman, M.A., and Mertz, C. (1997). ‘Gender and use of instructional technologies: A study of university faculty’, Higher Education 34, 421–436. Stanier, L. (1997). ‘Peer assessment and group work as vehicles for student
empower-ment: A module evaluation’, Journal of Geography in Higher Education 21, 95–98. Sullivan, M.E, Hitchcock, M.A., and Dunnington, G.L. (1999). ‘Peer and self
assess-ment during problem-based tutorials’, The American Journal of Surgery 177, 266– 269.
Topping, K. (1998). ‘Peer assessment between students in colleges and universities’, Review of Educational Research68, 249–276.
Tsai, C.-C., Liu, E.Z.-F., Lin, S.S.J., and Yuan, S.-M. (2001a). ‘A networked peer assessment system based on a Vee heuristic’, Innovations in Education and Teaching International38, 220–230.
Tsai, C.-C., Lin, S.S.J., and Tsai, M.-J. (2001b). ‘Developing an Internet attitude scale for high school students’, Computers & Education 37, 41–51.
Tsai, C.-C., Lin, S.S.J., and Yuan, S.-M. (2002). ‘Developing science activities through a networked peer assessment system’, Computers & Education 38, 241–252.
Williams, E. (1992). ‘Student attitudes towards approaches to learning and assessment’, Assessment and Evaluation in Higher Education17, 45–58.
Zevenbergen, R. (2001). ‘Peer assessment of student constructed posters: Assessment alternatives in preservice mathematics education’, Journal of Mathematics Teacher Education4, 95–113.
Address for correspondence:Professor Chin-Chung Tsai, Center for Teacher Education, National Chiao Tung University, 1001 Ta Hsueh Rd., Hsinchu 300, Taiwan.
Phone: 886-3-5731671; Fax: 886-3-5738083 or 886-3-5720605 E-mail: cctsai@mail.nctu.edu.tw