行政院國家科學委員會專題研究計畫 成果報告
粉蝨科昆蟲形態及分子分類之研究
研究成果報告(精簡版)
計 畫 類 別 : 個別型 計 畫 編 號 : NSC 95-2621-B-002-012- 執 行 期 間 : 95 年 08 月 01 日至 96 年 07 月 31 日 執 行 單 位 : 國立臺灣大學昆蟲學系暨研究所 計 畫 主 持 人 : 柯俊成 計畫參與人員: 博士班研究生-兼任助理:謝佳宏、葉信廷 處 理 方 式 : 本計畫可公開查詢中 華 民 國 96 年 10 月 27 日
行政院國家科學委員會補助專題研究計畫
□ 成 果 報 告
□期中進度報告
粉蝨科昆蟲形態及分子分類之研究
計畫類別:□ 個別型計畫 □ 整合型計畫
計畫編號:NSC
95-2621-B-002-012-
執行期間:
2006 年 08 月 01 日至 2007 年 07 月 31 日
計畫主持人:柯俊成
共同主持人:
計畫參與人員: 謝佳宏 葉信廷 吳復生
成果報告類型(依經費核定清單規定繳交):□精簡報告 □完整報告
本成果報告包括以下應繳交之附件:
□赴國外出差或研習心得報告一份
□赴大陸地區出差或研習心得報告一份
□出席國際學術會議心得報告及發表之論文各一份
□國際合作研究計畫國外研究報告書一份
處理方式:除產學合作研究計畫、提升產業技術及人才培育研究計畫、
列管計畫及下列情形者外,得立即公開查詢
□涉及專利或其他智慧財產權,□一年□二年後可公開查詢
執行單位:國立台灣大學昆蟲學系暨研究所
中 華 民 國 96 年 10 月 29 日
摘要 煙草粉蝨的入侵事件在世界上許多地方一直是很有趣的議題。最有名的就是B 生物小 種在全球危害造成大量經濟損失。近期Q 生物小種也被報導為新入侵害蟲。這兩個害蟲在 西北太平洋地區已經偵測到一段時間了,但是其入侵事件與族群遺傳結構仍不清楚。本研 究利用粒線體COI 來進行系統發生樹之重建與鑑定 B 和 Q 生物小種,並研究探討其入侵事 件與觀賞作物之間的關係。粒線體COI 亦被用來探討族群間與族群內的遺傳關係。結合系 統發生樹與單倍型分析,結果支持Q 生物小種在此區域的入侵現象跟來自地中海區域的景 觀作物之世界貿易有關。階層性分子變方分析支持多次入侵假說。低程度的單倍型與核苷 酸多樣性指數,顯示支持目前在西北太平洋地區的B 和 Q 生物小種存在著多次入侵現象。 此外,高程度的序列相似度與低程度的遺傳距離顯示這些入侵現象是近期發生的。族群間 低程度的遺傳分化指數值也支持入侵事件是近期發生的。因此,這些分析結果皆支持在此 地區的B 和 Q 生物小種是經由多次入侵。未來農作物的檢疫將是必須的以防止未來的入侵 事件。 關鍵詞:粉蝨、分子標記、系統發生、族群遺傳、害蟲
Abstract
Invasive events by Bemisia tabaci (Gennadius) biotypes in various parts of the world are of continuing interest. The most famous is biotype B that has caused great economic losses globally. In addition, biotype Q has also recently been reported to be a new invasive pest. These two biotypes have been monitored for some time in the Western North Pacific region, but the invasive events and population genetic structures of these two biotypes are still not clear in this region. In this study, the mitochondrial cytochrome oxidase I (COI) gene was used to reconstruct a phylogenetic tree for identifying biotypes B and Q and to study the relationships between invasive events and ornamental plants. Population genetic analyses of mtCOI sequences were also used to study the genetic relationships within and between populations. A combination of a phylogenetic tree and haplotype analysis suggested the recent invasion of biotype Q in this region is related to the international ornamental trade from the Mediterranean region. Low levels of haplotype diversity and nucleotide diversity indicate that the presence of biotypes B and Q in the Western North Pacific region are due to multiple invasions. Hierarchical analysis of AMOVA supports the hypothesis of multiple invasions. In addition, high sequence identities and low genetic distances within and between populations of the two biotypes revealed that these invasive events occurred recently. The low levels of genetic differentiation revealed by pairwise FST values
between populations also suggests the invasions were recent. Therefore, results of this study suggested that biotypes B and Q entered this region via multiple recent invasions. A quarantine of agricultural crops may be necessary to prevent further invasions.
Introduction
The whitefly, Bemisia tabaci (Hemiptera: Aleyrodidae), was originally described as
Aleyrodes tabaci by Gennadius in 1889 on tobacco in Greece (Perring 2001). This species is an
important agricultural pest and causes great economic losses (Brown et al. 1995, De Barro 1995, Perring 2001). Bemisia tabaci is widely distributed throughout tropical and subtropical areas of the world (Brown et al. 1995). The concept of biotypes of B. tabaci, proposed in the 1950s, indicates that morphologically indistinguishable populations exhibit different biological traits (Brown et al. 1995). Variations in biotypes exist in terms of host range, dispersal behavior, fecundity, insecticide resistance, and transmission competency for begomoviruses (Berry et al. 2004).
More than 24 biotypes of B. tabaci have been identified by multiple techniques (Perring 2001), the most well-known being the biotype B superbug. It is polyphagous with a broad host range, and causes damage through feeding, excretion of honeydew, and virus transmission (De Barro 1995). Biotype B was described previously as B. argentifolii Bellows and Perring, with the proposed common name of silverleaf whitefly (Perring 2001). Biotype Q was originally though to be restricted to the Iberian Peninsula, but recently has been widely reported in the Mediterranean Basin (Horowitz et al. 2005, De la Rúa et al. 2006). Horowitz et al. (2005) indicated that biotype Q has a high level of resistance to insecticides and also causes economic damage. Furthermore, biotypes B and Q of B. tabaci have different inherent levels of resistance to insecticides, and insecticide applications affect the proportion of both biotypes (Horowitz et al. 2005). Molecular markers have been developed to identify biotypes B and Q, and to study their population dynamics (Khasdan et al. 2005).
Molecular markers are useful tools for distinguishing biotypes and include esterase, random amplified polymorphic DNA polymerase chain reaction (RAPD-PCR), amplified fragment length polymorphism (AFLP), mitochondrial, ribosomal, and microsatellite DNA markers (De Barro and Driver 1997, Frohlich et al. 1999, De Barro et al. 2000, De Barro 2005, Zhang et al. 2005). Based on the genetic diversity revealed by RAPD-PCR analysis, biotype B is likely an invader and biotype Q may be endemic to the Iberian Peninsula (Moya et al. 2001). In addition, many reports have used mitochondrial and ribosomal markers to reconstruct phylogenetic trees and distinguish biotypes based on tree topology (Frohlich et al. 1999, De Barro et al. 2000, Abdullahi et al. 2003, De la Rúa et al. 2006, Hsieh et al. 2006, Ueda and Brown 2006). Accordingly, biotype B presumably originated in the Middle East, and evidence supports its having spread worldwide due to human trade activities (Frohlich et al. 1999, De Barro et al. 2000).
The phylogenetic tree of the mitochondrial cytochrome oxidase I (mtCOI) gene indicated four biotypes of B. tabaci in East Asia: B, Q, Nauru, and An (Hsieh et al. 2006). The Nauru and An biotypes are indigenous to East Asia (Hsieh et al. 2006). Biotype B as an invader is the most widely distributed biotype in the Western North Pacific region, and it has already caused huge economic losses in the region (Zhang et al. 2005, Hsieh et al. 2006, Ueda and Brown 2006). Biotype Q was previously found only in China, but now has also been reported from Japan also (Zhang et al. 2005, Ueda and Brown 2006). Otherwise, biotype Q has been reported only in a
local region of China and Japan (Zhang et al. 2005, Ueda and Brown 2006). Some reports have hypothesized that ornamental plants such as the poinsettia may have been a possible vector of entry for biotypes B and Q into China and Japan (Zhang et al. 2005, Ueda and Brown 2006). However, the relationships between invasive events and ornamental plants are indefinite, and genetic relationships within and between populations also are not clear in the Western North Pacific region.
Mitochondrial DNA is haploid and particularly useful for population studies because it undergoes no recombination, is maternally inherited, and has a simple sequence organization (Harrison 1989). In addition, the mtCOI gene has been a popular marker for studying relationships among B. tabaci biotypes (Frohlich et al. 1999, De la Rúa et al. 2006, Hsieh et al. 2006, Ueda and Brown 2006). In this study, we applied the mtCOI gene to reconstruct a phylogenetic tree for identifying biotypes B and Q in the Western North Pacific region, and we discuss the relationships between invasive events and ornamental plants. Furthermore, we used genetic analyses of the mtCOI gene to determine the population genetic structure of biotypes B and Q in this region. We attempted to study the genetic diversity within and between populations and determine whether or not biotypes B and Q are invasive agents in this region. We also tried to determine the genetic relationships within and between populations separated by natural barriers. This study provides information for understanding genetic variation of the invasive biotypes of B.
tabaci in the Western North Pacific region.
Materials and Methods
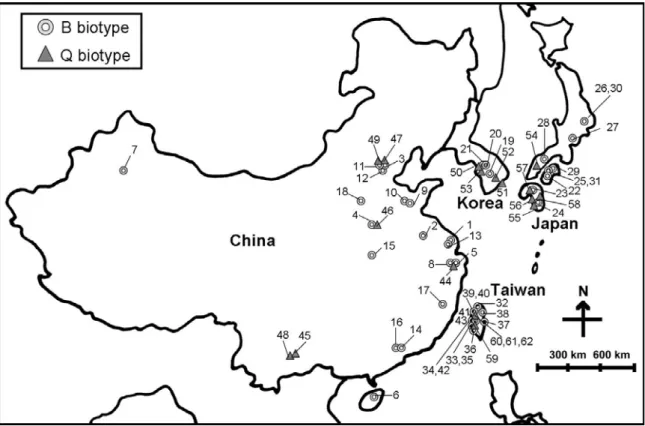
Whitefly samples. Whitefly samples of B. tabaci of the Western North Pacific region were
from China, Japan, Korea, and Taiwan (Table 1, Fig. 1). Specimens of B. tabaci were collected from weeds, vegetables, and ornamental plants (from the wild, farms, and greenhouses, respectively). We selected fourth instars and used classical taxonomic criteria to identify the whitefly species. Adult whiteflies were preserved in 95% ethanol and stored at -20 °C. Samples from Cyprus, Israel, the Netherlands, and Spain of the Mediterranean Basin also were analyzed.
Cytochrome oxidase I (COI) gene sequencing. Genomic DNA was extracted from
individual adult whiteflies according to the method suggested by De Barro and Driver (1997). The mitochondrial partial COI gene sequence (816 bp) was amplified by PCR with the primers
C1-J-2195 (5'-TTGATTTTTTGGTCATCCAGAAGT-3') and L2-N-3014 (5'-TCCAATGCACTAATCTGCCATATTA-3') (Frohlich et al. 1999). The PCR reaction program
was initialized at 94 °C for 2 min, followed by 35 cycles of 94 °C for 1 min, 52 °C for 1 min, and 72 °C for 1 min, with a final extension of 5 min at 72 °C. The PCR products were subsequently gel-purified using the Micro-Elute DNA Clean/Extraction Kit (GeneMark, Taipei, Taiwan) and sequenced in one direction on an ABI 3730 DNA Analyzer (Applied Biosystems, CA, USA) using an ABI PRISM BigDye Terminator Cycle Sequencing Ready Reaction Kit, V3.1 (Applied Biosystems). Sequences obtained in this study were submitted to GenBank, and some samples from the Western North Pacific region in GenBank also were analyzed (Table 1).
Phylogenetic analysis. Phylogenetic analysis included the B, Q, and other biotypes of B.
tabaci (Tables 1 and 2), with Lipaleyrodes emiliae Chen and Ko (DQ989555) as an outgroup. All
sequences were aligned using the Clustal X 1.18 program (Thompson et al. 1997). The resulting alignment was manually edited using the GeneDoc program (Nicholas et al. 1997), and the phylogenetic analysis was performed using Bayesian inference (Yang and Rannala 1997). The best-fitting model of DNA substitution was selected by the Akaike information criterion (AIC) using MrMODELTEST version 2.2 (Nylander 2004). The phylogenetic tree was constructed by employing the GTR + G model. The Bayesian analysis was performed using MrBayes version 3.1.2 (Huelsenbeck and Ronquist 2001). Metropolis-coupled Markov chain Monte Carlo analyses were run with four chains (one cold chain and three heated chains). Analyses were initiated with random starting trees, then run for 1 x 10⁶ generations and were sampled every 100 generations. For the burn-in period, we discarded 100,000 generations. Posterior clade probabilities were used to assess the levels of nodal support. Branch lengths were saved and are presented on the 50% majority-rule consensus trees.
Analysis of genetic variations and population genetics. After our test, we found that
samples from the same site revealed the same mtCOI sequences. Therefore, we only selected one individual to represent all specimens from the same site (Table 1, Fig. 1). The mtCOI sequence identities within and among populations were estimated using GeneDoc (Nicholas et al. 1997). In addition, the genetic distances within and among populations were estimated using Kimura’s two-parameter model in MEGA version 3.1 (Kumar et al. 2004). Values of haplotype diversity (h) and nucleotide diversity (π) were evaluated with DnaSP version 4.10.8 (Rozas et al. 2003). Analysis of molecular variance (AMOVA) was used to characterize patterns of genetic variation and estimate variance components at different hierarchical levels (among biotypes (Va), among populations within biotypes (Vb), and within populations (Vc)) using Arlequin version 3.01 (Excoffier et al. 2005). The fixation index of the Φ-statistics was estimated from the pairwise genetic distances among populations (Wright 1951). These distances were also used for the hierarchical analysis of population differentiation (among biotypes (ΦCT), among populations
within biotypes (ΦSC), and within populations (ΦST)) (Excoffier et al. 1992). In addition, the
statistical significance of the Φ-statistics at different hierarchical levels was tested by 1000 permutations. The value of FST was used to estimate the degree of genetic differentiation among
populations (Hudson et al. 1992) using DnaSP 4.10.8.
Results
Phylogenetic analysis of B. tabaci biotypes. Approximately 816 bp of the mtCOI gene was
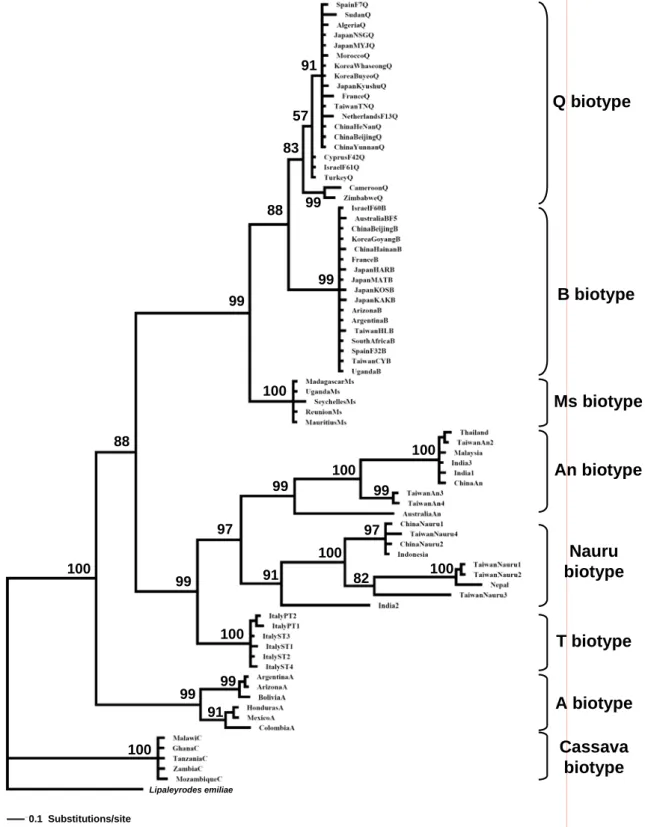
amplified from individual whiteflies using PCR. In addition, we also downloaded sequences from GenBank, and 78 samples were used to reconstruct a phylogenetic tree which included an outgroup (Table 2). After alignment, 441 bp of the mtCOI sequence was used to reconstruct the phylogenetic tree. There were 256 invariable sites, 40 singleton variable sites, and 145 parsimoniously informative sites. The phylogenetic tree based on the Bayesian inference divided
clade with high posterior probability (99%) support. The results revealed that these three biotypes are sister groups, and also indicated that they could are clearly clustered by the three biotypes. Within this group, there was high posterior probability (100%) support for biotype Ms as a monophyletic group. Furthermore, B and Q biotypes are monophyletic with there was also high posterior probability (88%). However, biotypes B and Q clearly belong to different monophyletic subgroups with high posterior probability (99% and 83%, respectively). Therefore, biotypes B and Q are sister groups.
We compared the distributions and host-plant records of biotypes B and Q in the Western North Pacific region (Table 1, Fig. 1)(China, Korea, Japan, and Taiwan) relative to the phylogenetic tree (Fig. 2). Biotype Q collected from different host plants of the Western North Pacific region were clustered in the same clade which also included samples from the Mediterranean Basin. Samples of biotype B from the Western North Pacific region clustered in the same clade as a polytomy, along with samples from the Mediterranean Basin and around the world. The branch lengths of samples of biotype B were similar, revealing that their relationships were close. Biotype Q branch lengths also were similar, indicating close relationships of samples from the Western North Pacific region.
Genetic variation and population genetics of biotypes B and Q in the Western North Pacific region. After sequence alignment, 473 bp of the mtCOI sequence was used to analyze
genetic variation and population genetics of biotypes B and Q in the Western North Pacific region. Comparison of 43 samples of biotype B from this region revealed 468 sequence-invariable sites, three singleton-variable sites, and two parsimoniously informative sites. Therefore, overall sequences of these samples revealed six haplotypes in this region (Table 3), and BH6 was the most common haplotype in all four populations. Furthermore, BH1 was found only in China, BH5 was found only in Taiwan, and BH2 and BH3 were found only in Japan. The highest haplotype (h = 0.53333) and nucleotide diversities (π = 0.00127) were found among individuals of the Japanese population. In addition, the lowest haplotype (h = 0.20915) and nucleotide diversities (π = 0.00044) were found among individuals of the Chinese population. Across all samples of this region haplotype diversity (h) was 0.30011 and nucleotide diversity (π) was 0.00068. However, we could not calculate the haplotype or nucleotide diversity for the Korean population because there was only one haplotype.
A comparison of 19 samples of biotype Q from the Western North Pacific region revealed 470 sequence-invariable sites, one singleton-variable site, and two parsimoniously informative sites. There were four haplotypes in this region (Table 3), with QH3 being the most common. The highest haplotype (h = 0.8) and nucleotide diversities (π = 0.00226) were found among individuals of the Chinese population. The lowest haplotype (h = 0.5) and nucleotide diversities (π = 0.00106) were found among individuals of the Korean population. Across all samples of this region haplotype diversity (h) was 0.57310 and nucleotide diversity (π) was 0.00138. We could not calculate the haplotype or nucleotide diversity for the Taiwanese population because there was only one haplotype.
biotypes B and Q (98%) (Table 4). The variation among populations within biotypes was only 0.05%. In addition, the variation within populations (1.94%) was higher than that among populations within biotypes. Population differentiation of the Φ-statistics accounted for three sources of variation (Table 4). A significant ΦST value was detected within populations (ΦST =
0.98056, p < 0.001). A significant ΦCT value was detected among biotypes (ΦCT = 0.98004, p <
0.05). The results indicated that genetic differences among biotypes were responsible for the differences within populations. No significant ΦSC value was observed among populations within
biotypes (ΦSC = 0.02565).
Sequence identity and genetic distance (of Kimura’s two-parameter model) were used to compare populations. Sequence identities between populations of biotype B in the Western North Pacific region were all 99-100%, and those within populations were also 99-100%. The average genetic distance between populations was 0.00024-0.00099. The maximum distance was 0.00099 between the Japanese and Taiwanese populations. The minimum distance was 0.00024 between the Chinese and Korean populations. The mean distance within populations was 0-0.00127. Sequences from different individuals within the Korean population of biotype B were identical. Sequence identities among populations of biotype Q in the Western North Pacific region were 99-100%, while those within populations were 99-100%. Mean genetic distances between populations were 0.00053-0.00198. Average distances within populations were 0-0.00226. Sequences from different individuals within the Taiwanese population of biotype Q were identical.
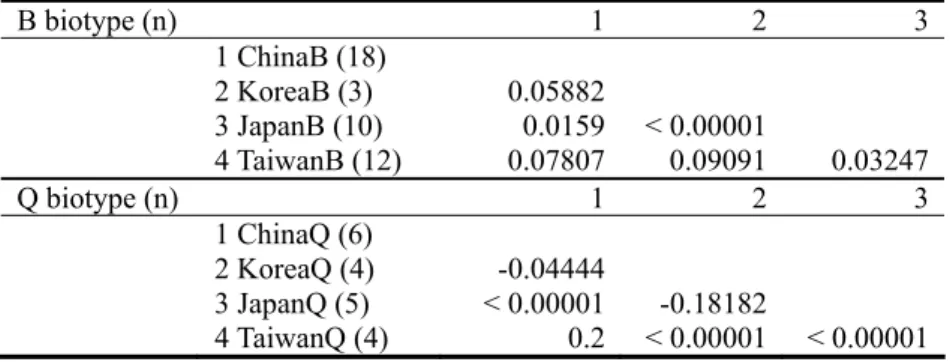
Genetic differentiation between populations was estimated by pairwise FST (Table 5).
Comparisons among populations of biotype B in the Western North Pacific region resulted in low
FST values, suggesting no genetic differentiation among populations of biotype B in this region.
Likewise, pairwise comparisons among populations of biotype Q in the Western North Pacific region also resulted in low FST values, indicating no genetic differentiation among populations of
biotype Q in this region.
Discussion
The phylogenetic tree based on Bayesian inferences revealed that biotypes B and Q of B.
tabaci are both present in China, Korea, Japan, and Taiwan of the Western North Pacific region.
Biotype B has already been reported from these four countries, but biotype Q was known only from China, and until a recent report from Japan (Zhang et al. 2005, Hsieh et al. 2006, Ueda and Brown 2006). Biotype Q was detected for the first time in Taiwan in this study. Biotype B is an invader worldwide and biotype Q is a recent invader of China, Japan, and the US (Perring 2001, Zhang et al. 2005, Ueda and Brown 2006). Therefore, we hypothesize that biotype Q is a new invader of Taiwan.
Results of the phylogenetic tree provide some information on the invasive events of biotypes B and Q in the Western North Pacific region. Biotype B of this region clustered with the worldwide samples, forming a clade that was a polytomy. This result supports previous studies which found that biotype B has been spread rapidly across the globe by human trade activities (Frohlich et al. 1999, De Barro et al. 2000, Perring 2001). Therefore, biotype B in this region
undoubtedly represents an invasive event, as suggested in previous reports (Zhang et al. 2005, Hsieh et al. 2006, Ueda and Brown 2006). The biotype Q clade was divided into three branches and appeared more genetically polymorphic. The tree topology revealed that biotype Q samples from this region clustered with Mediterranean countries. Although biotype Q was thought to be restricted originally to the Iberian Peninsula, but has recently been found in various countries around the Mediterranean basin (Brown et al. 2000, Horowitz et al. 2005). Consequently, we hypothesize that the invasion by biotype Q in the Western North Pacific region originated recently from one of several possible Mediterranean countries.
The routes of invasive biotypes of B. tabaci are believed to be related to the international trade in ornamentals (Brown et al. 1995, De Barro 1995). Imported poinsettias were probably the source of biotype B, which then dispersed from ornamental greenhouses into the field in US (Brown et al. 1995). Invasions of biotype Q were hypothesized to be associated with ornamental crops in China and Japan (Zhang et al. 2005, Ueda and Brown 2006). Fortuitously, we found direct evidence to support this hypothesis. There was no evidence of biotype Q in Taiwan before 2005 (Hsieh et al. 2006), in 2006 we recorded biotype Q only in one greenhouse containing poinsettias. The poinsettia plantlets had been obtained from Italy in 2006. Furthermore, we did not find any biotype Q whiteflies outside the greenhouse or in the field in Taiwan in 2006. Thus, we consider this to be powerful evidence supporting the hypothesis that routes of invasion by biotypes of B. tabaci are related to the international ornamentals trade.
Population genetic analyses were used to study genetic variation of invasive biotypes and to reconstruct the invasive events. According to haplotype analyses, BH6 was the only haplotype shared among countries, while the other five haplotypes were unique to a given country. In addition, haplotype and nucleotide diversities within each country were very low. Six haplotypes with low levels of genetic variability were observed, which suggests that multiple invasive events or rapid divergence have occurred. However, the molecular clock hypothesis based on Brower’s estimates for mitochondrial DNA indicated 2.3% pairwise sequence divergence per million years (Brower 1994). Therefore, we hypothesize that the invasive biotype B in this region exists due to multiple invasive events. On the other hand, QH3 was found to be the most common haplotype within each country. Haplotype QH4 also was shared among countries besides Taiwan, while the other two haplotypes were unique to individual countries. Haplotype and nucleotide diversities also revealed low genetic variability within each country. Based on our results, we hypothesize that the invasive event of biotype Q in Taiwan was a single event, because only the QH4 haplotype was found in one poinsettia greenhouse. Although the ocean provides a natural barrier between China and Japan and between Korea and Japan, they all share two haplotypes. This suggests that the invasion of biotype Q in this region may have occurred through multiple invasive events. A recently introduced population that has expanded in size from a low number of founders is expected to have a common haplotype which is shared by a majority of individuals and many rarer haplotypes with a few independent mutations (Avise 2000). Based on the genetic variability of the population genetics analyses, we hypothesize that the invasions of biotypes B and Q in the Western North Pacific region occurred through multiple invasive events.
and to estimate variance components. The results revealed that the great majority of variation was among biotypes B and Q, while there were also significant genetic differences among B and Q biotypes. This supports biotypes B and Q being genetically different, as previously reported (Moya et al. 2001). The fixation index of the Φ-statistics was used for the hierarchical analysis of population differentiation. We noted that there was relatively large differentiation among biotypes, which was responsible for differences within populations. The results revealed higher levels of genetic differences within populations than among populations as a whole, a result that is unreasonable given the ocean as a natural barrier. Thus, the combined results of AMOVA analyses supported the hypothesis of multiple invasive events of biotypes B and Q in the Western North Pacific region.
The population genetic structure was studied to determine the genetic relationships within populations and between populations of invasive biotypes of B. tabaci in this region. Similar results of low genetic distances and high sequence identities between and within populations of biotype B revealed no differences between populations. Low FST values between populations of
biotype B also revealed low levels of genetic differentiation. These results indicate that few differences exist among populations. However, it seems impossible that no differences would exist between long-resident natural populations with the ocean serving as a natural barrier. Instead, one would expect to observe isolation by distance, where genetic similarity among populations decreases as the geographic distance between them increases (Jensen et al. 2005). We found that biotypes B and Q in this region do not exhibit. Consequently, the population structure analyses support hypothesis of recent multiple invasions of biotypes B and Q in this region.
Actually, biotypes B and Q are known invaders of the Western North Pacific region. Biotype B has already become an important pest and has transmitted begomoviruses which have caused economic losses in this region (Zhang et al. 2005, Hsieh et al. 2006, Ueda and Brown 2006). Therefore, biotype B has already passed through the three stages of invasion-i.e., importation, introduction, and establishment (Williamson and Fitter 1996) to become a pest species. Furthermore, biotype Q in China, Korea, and Japan has also passed through the three stages to become a pest. However, we found biotype Q in Taiwan only in a poinsettia greenhouse, revealing that it is only in the importation stage, and has not yet been introduced (or released) to the environment.
Whether biotype B of B. tabaci is an invader has long been controversial. Molecular markers and viral disease are used to demonstrate incursions of biotype B and have indicated that it was transported on ornamental plants (Brown et al. 1995, Frohlich et al. 1999, De Barro et al. 2000). Furthermore, this study supports the invasion of biotype Q being a recent event related to ornamental plants, and it can be expected that it will soon spread worldwide as did biotype B through human trade activities. However, inherent levels of resistance to insecticides differ in biotypes B and Q (Khasdan et al. 2005). Insecticide applications have affected the dynamics and distribution of biotypes B and Q elsewhere (Khasdan et al. 2005). Therefore, ornamental crops should be quarantined to prevent the future invasion of these biotypes, and better ways to eliminate and control these two pests should be sought. Molecular markers will play an important role in monitoring and preventing their further invasion.
Acknowledgements
We are grateful to Dr. A. R. Horowitz (Department of Entomology, Agricultural Research Organization, Gilat Research Center, Israel) for supplying the Israel samples, Dr. I. Bedford (John Innes Centre, Norwich, UK) for supplying the Spain samples, Dr. M. Jansen (Plant Protection Service, Wageningen, the Netherlands) for supplying the Netherlands samples, Dr. S. J. Suh (National Plant Quarantine Service, Goyang, South Korea) for supplying the Korea samples, Dr. K. I. Honda and Dr. S. Ueda (National Institute of Vegetable and Tea Science, Japan) for supplying the Japan samples, and Dr. C. Luo and X. J. Guo (Institute of Plant and Environment Protection, Beijing Academy of Agriculture and Forestry Science, China), Dr. B. L. Qiu (Entomology Department, South China Agricultural University, Guangzhou, China), and Dr. S. S. Liu (Institute of Applied Entomology, Zhejiang University, China) for supplying the China samples. We thank Y. C. Hung, C. H. Chen, Y. F. Chen, F. S. Wu, Y. T. Shih, and H. T. Yeh (National Taiwan University (NTU), Taipei, Taiwan) for help with sample collection, and Dr. S. K. Green (The Asian Vegetable Research and Development Center, Tainan, Taiwan) for providing samples. We thank Dr. C. F. Hsieh and Dr. S. C. Wu (Department of Life Science, NTU) for identifying host plants of B. tabaci. We also thank X. Y. Tsai (NTU), H. F. Hung (NTU), Y. H. Chen, and Y. C. Lo for their assistance. Thanks are extended to Dan Chamberlin for editing the English of the draft. This paper was supported, in part, by grants from the National Science Council (NSC95-2621-B-002-0120) and Bureau of Animal and Plant Health Inspection and Quarantine (94 AS-13.3.1-BQ-B2), Taiwan.
References Cited
Abdullahi, I., S. Winter, G. I. Atiri, and G. Thottappilly. 2003. Molecular characterization of
whitefly, Bemisia tabaci (Hemiptera: Aleyrodidae) populations infesting cassava. Bull. Entomol. Res. 93: 97-106.
Avise, J. C. 2000. Phylogeography: the history and formation of species. Harvard University
Press, Cambridge, MA.
Berry, S. D., V. N. Fondong, C. Rey, D. Rogan, C. M. Fauquet, and J. K. Brown. 2004.
Molecular evidence for five distinct Bemisia tabaci (Homoptera: Aleyrodidae) geographic haplotypes associated with cassava plants in sub-Saharan Africa. Ann. Entomol. Soc. Am. 97: 852-859.
Brower, A. V. Z. 1994. Rapid morphological radiation and convergence among races of the
butterfly Heliconius erato inferred from patterns of mitochondrial DNA evolution. Proc. Natl. Acad. Sci. U.S.A. 91: 6491-6495.
Brown, J. K., D. R. Frohlich, and R. C. Rosell. 1995. The sweetpotato or silverleaf whiteflies:
biotypes of Bemisia tabaci or a species complex? Annu. Rev. Entomol. 40: 511-534.
Brown, J. K., T. M. Perring, A. D. Cooper, I. D. Bedford, and P. G. Markham. 2000. Genetic
analysis of Bemisia (Hemiptera: Aleyrodidae) populations by isoelectric focusing electrophoresis. Biochem. Genet. 38: 13-25
Control. CSIRO, Australia, Div. Entomol. Tech. Paper no. 33. 57 pp.
De Barro, P. J. 2005. Genetic structure of whitefly Bemisia tabaci in the Asia-Pacific region
revealed using microsatellite markers. Mol. Ecol. 14: 3695-3718.
De Barro, P. J. and F. Driver. 1997. Use of RAPD to distinguish the B biotype from other
biotypes of Bemisia tabaci (Hemiptera: Aleyrodidae). Aust. J. Entomol. 36: 149-152.
De Barro, P. J., F. Driver, J. W. H. Trueman, and J. Curran. 2000. Phylogenetic relationships
of world populations of Bemisia tabaci (Gennadius) using ribosomal ITS1. Mol. Phylogenet. Evol. 16: 29-36.
De la Rúa, P., B. Simón, D. Cifuentes, C. Martinez-Mora, and J. L. Cenis. 2006. New
insights into the mitochondrial phylogeny of the whitefly Bemisia tabaci (Hemiptera: Aleyrodidae) in the Mediterranean Basin. J. Zool. Syst. Evol. Res. 44: 25-33.
Excoffier, L., G. Laval, and S. Schneider. 2005. Arlequin ver. 3.0: an integrated software
package for population genetics data analysis. Evol. Bioinform. Online 1: 47-50.
Excoffier, L., P. E. Smouse, and J. M. Quattro. 1992. Analysis of molecular variance inferred
from metric distances among DNA haplotypes: application to human mitochondrial DNA restriction data. Genetics 131: 479-491.
Frohlich, D. R., I. Torres-Jerez, I. D. Bedford, P. G. Markham, and J. K. Brown. 1999. A
phylogeographical analysis of the Bemisia tabaci species complex based on mitochondrial DNA markers. Mol. Ecol. 8: 1683-1691.
Harrison, R. G. 1989. Animal mitochondrial DNA as a genetic marker in population and
evolutionary biology. Trends Ecol. Evol. 4: 6-11.
Horowitz, A. R., S. Kontsedalov, V. Khasdan, and I. Ishaaya. 2005. Biotypes B and Q of
Bemisia tabaci and their relevance to neonicotinoid and pyriproxyfen resistance. Arch.
Insect Biochem. Physiol. 58: 216-225.
Hsieh, C. H., C. H. Wang, and C. C. Ko. 2006. Analysis of Bemisia tabaci (Hemiptera:
Aleyrodidae) species complex and distribution in eastern Asia based on mitochondrial DNA markers. Ann. Entomol. Soc. Am. 99: 768-775.
Hudson, R. R., M. Slatkin, and W. P. Maddison. 1992. Estimation of levels of gene
flow from DNA sequence data. Genetics 132: 583-589.
Huelsenbeck, J. P., and F. Ronquist. 2001. MrBayes: Bayesian inference of phylogenetic trees.
Bioinformatics 17: 754-755.
Jensen, J. L., A. J. Bohonak, and S. T. Kelley. 2005.
Isolation by distance, web service.
BMC Genet.6: 13-18.
Khasdan, V., I. Levin, A. Rosner, S. Morin, S. Kontsedalov, L. Maslenin, and A. R. Horowitz. 2005. DNA markers for identifying biotypes B and Q of Bemisia tabaci (Hemiptera:
Aleyrodidae) and studying population dynamics. Bull. Entomol. Res. 95: 605-613.
Kumar, S., S. Tamura, and M. Nei. 2004. MEGA3: Integrated software for molecular
evolutionary genetics analysis and sequence alignment. Brief Bioinform. 5: 150-163.
Moya, A., P. Guirao, D. Cifuentes, F. Beitia, and J. L. Cenis. 2001. Genetic diversity of Iberian
populations of Bemisia tabaci (Hemiptera: Aleyrodidae) based on random amplified polymorphic DNA-polymerase chain reaction. Mol. Ecol. 10: 891-897.
Nicholas, K. B., H. B. Jr. Nicholas, and D. W. II. Deerfield. 1997. GeneDoc: analysis and
visualization of genetic variation. Embnew News. 4: 14.
Nylander, J. A. A. 2004. MrModeltest v2. Program distributed by the author. Evolution Biology
Centre, Uppsala University, Uppsala, Sweden.
Perring, T. M. 2001. The Bemisia tabaci species complex. Crop Protect. 20: 725-737.
Rozas, J., J. C. Sánchez-DelBarrio, X. Messeguer, and R. Rozas. 2003. DnaSP, DNA
polymorphism analyses by the coalescent and other methods. Bioinformatics 19: 2496-2497.
Thompson, J. D., T. J. Gibson, F. Plewniak, F. Jeanmougin, and D. G. Higgins. 1997. The
ClustalX windows interface: flexible strategies for multiple sequence alignment aided by quality analysis tools. Nucleic Acids Res. 24: 4876-4882.
Ueda, S., and J. K. Brown. 2006. First report of Q biotype of Bemisia tabaci in Japan by
mitochondrial cytochrome oxidase I sequence analysis. Phytoparasitica 34: 405-411.
Williamson, M. H., and A. Fitter. 1996. The characters of successful invaders. Biol. Conserv. 78:
163-170.
Wright, S. 1951. The genetical structure of populations. Ann. Eugenics 15: 323-354.
Yang, Z., and B. Rannala. 1997. Bayesian phylogenetic inference using DNA sequences: a
Markov chain Monte Carlo method. Mol. Biol. Evol. 14: 717-724.
Zhang, L. P., Y. J. Zhang, W. J. Zhang, Q. J. Wu, B. Y. Xu, and D. Chu. 2005. Analysis of
genetic diversity among different geographical populations and determination of biotypes of
Table 1. Samples of biotypes B and Q of Bemisia tabaci from the Western North Pacific region
No. Acronym Biotype Haplotype GenBank
accession no.
Host plant Year Location Environment
1 ChinaShanghaiB1 B BH6 AY550274 Euphorbia pulcherrima 2003 China, Shanghai Field
2 ChinaNanjingB2 B BH6 AY518185 Gossypium hirsutum 2003 China, Nanjing Field
3 ChinaBeijingB3 B BH6 AY582867 Brassica oleraceae 2003 China, Beijing Field
4 ChinaHeNanB4 B BH6 AY582873 Lycopersicon esculentum 2003 China, Henan Field
5 ChinaZhejiangB5 B BH6 AJ867555 Brassica oleraceae 2003 China, Zhejiang Field
6 ChinaHainanB6 B BH1 AY518187 Solanum melongena 2003 China, Hainan Field
7 ChinaXinJiangB7 B BH1 AY582868 Euphorbia pulcherrima 2003 China, Xinjiang Field
8 ChinaZhejiangB8 B BH6 DQ989520 Brassica oleraceae 2005 China, Zhejiang Field
9 ChinaShandongB9 B BH6 DQ989521 Gossypium hirsutum 2004 China, Shandong Field
10 ChinaShandongB10 B BH6 DQ989522 Brassica oleraceae 2004 China, Shandong Field
11 ChinaBeijingB11 B BH6 DQ989523 Brassica oleracea 2005 China, Beijing Field
12 ChinaBeijingB12 B BH6 DQ989524 Cucumis sativus 2005 China, Beijing Field
13 ChinaShanghaiB13 B BH6 DQ989525 Cucumis sativus 2005 China, Shanghai Field
14 ChinaGuangdongB14 B BH6 DQ989526 Luffa aegyptiaca 2005 China, Guangdong Field
15 ChinaHubeiB15 B BH6 DQ989527 Brassica oleraceae 2005 China, Hubei Field
16 ChinaGuangdongB16 B BH6 DQ989528 Cucurbita moschata 2005 China, Guangdong Field
17 ChinaFujianB17 B BH6 DQ989529 Brassica oleraceae 2005 China, Fujian Field
18 ChinaShanxiB18 B BH6 DQ989530 Lycopersicon esculeutum 2005 China, Shanxi Field
19 KoreaJincheonB1 B BH6 DQ462587 - 2006 Korea, Jincheon -
20 KoreaGoyangB2 B BH6 DQ989531 Rosa hybride 2003 Korea, Goyang Field
21 KoreaGoyangB3 B BH6 DQ174538 Rosa hybride 2003 Korea, Goyang Field
22 JapanAINB1 B BH6 AB204577 Lycopersicon esculeutum 2004 Japan, Ehime Field
23 JapanKOSB2 B BH4 AB204578 cucurbit plant 1991 Japan, Kumamoto Field
24 JapanKAKB3 B BH3 AB204580 Lycopersicon esculeutum 2004 Japan, Kagoshima Field
25 JapanHARB4 B BH2 AB204581 melon 2004 Japan, Kochi Field
26 JapanMATB5 B BH6 AB204582 Capsicum annuum 2004 Japan, Chiba Field
27 JapanASAB6 B BH6 AB204583 Solanum melongena 2004 Japan, Shizuoka Field
28 JapanKURB7 B BH6 AB204584 Lycopersicon esculeutum 2004 Japan, Okayama Field
29 JapanTOSB8 B BH6 AB204585 melon 2004 Japan, Kochi Field
30 JapanHonshuB9 B BH6 DQ989532 Euphorbia pulcherrima 2005 Japan, Chiba Field
31 JapanShikokuB10 B BH6 DQ989533 Capsicum annuum 2005 Japan, Kochi Field
32 TaiwanTPB1 B BH6 DQ989534 Euphorbia pulcherrima 2006 Taiwan, Taipei Field
33 TaiwanCYB2 B BH6 DQ989535 Lycopersicon esculeutum 2006 Taiwan, Chiayi Field
34 TaiwanYLB3 B BH6 DQ989536 Lycopersicon esculeutum 2006 Taiwan, Yunlin Field
35 TaiwanTNB4 B BH6 DQ989537 Euphorbia hirta 2006 Taiwan, Tainan Field
36 TaiwanKHB5 B BH6 DQ989538 Lycopersicon esculeutum 2006 Taiwan, Kaohsiung Field
37 TaiwanHLB6 B BH5 DQ989539 Brassica oleraceae 2006 Taiwan, Hualien Field
38 TaiwanYLB7 B BH5 DQ989540 Lycopersicon esculeutum 2006 Taiwan, Ilan Field
39 TaiwanTYB8 B BH6 DQ989541 Synedrella nodiflora 2006 Taiwan, Taoyuan Field
40 TaiwanMLB9 B BH6 DQ989542 Euphorbia pulcherrima 2006 Taiwan, Miaoli Greenhouse
41 TaiwanNTB10 B BH6 DQ989543 Synedrella nodiflora 2006 Taiwan, Nantou Field
42 TaiwanCHB11 B BH6 DQ989544 Erigeron bonariensis 2006 Taiwan, Changhua Field
43 TaiwanTHB12 B BH6 DQ989545 Erigeron bonariensis 2006 Taiwan, Taichung Field
44 ChinaZhejiangQ1 Q QH4 DQ473394 Cucumis sativus 2006 China, Zhejiang Field
45 ChinaYunNanQ2 Q QH3 AY587516 Euphorbia pulcherrima 2003 China, Yunnan Field
46 ChinaHeNanQ3 Q QH3 AY587514 Solanum melongena 2003 China, Henan Field
47 ChinaBeijingQ4 Q QH1 AY589499 Ipomoea nil 2003 China, Beijing Field
48 ChinaYunnanQ5 Q QH4 AY518189 Euphorbia pulcherrima 2003 China, Yunnan Field
49 ChinaBeijingQ6 Q QH1 AY582872 Ipomoea nil 2003 China, Beijing Field
50 KoreaWhaseongQ1 Q QH4 DQ462586 - 2006 Korea, Whaseong -
51 KoreaGeojeQ2 Q QH3 DQ462585 - 2006 Korea, Geoje -
52 KoreaJinjuQ3 Q QH3 DQ462584 - 2006 Korea, Jinju -
53 KoreaBuyeoQ4 Q QH3 DQ462583 - 2006 Korea, Buyeo -
54 JapanMIHQ1 Q QH3 AB204588 Lycopersicon esculeutum 2004 Japan, Hiroshima Field
55 JapanOKCQ2 Q QH3 AB204587 Lycopersicon esculeutum 2004 Japan, Kagoshima Field
56 JapanMYJQ3 Q QH3 AB204586 melon 2004 Japan, Kagoshima Field
57 JapanNSGQ4 Q QH4 AB204579 Cucurbita maxima 2004 Japan, Kumamoto Field
58 JapanKyushuQ5 Q QH2 DQ989546 Capsicum annuum 2005 Japan, Miyazaki Field
59 TaiwanTNQ1 Q QH3 DQ989547 Euphorbia pulcherrima 2006 Taiwan, Tainan, Potting
60 TaiwanMLQ2 Q QH3 DQ989548 Euphorbia pulcherrima 2006 Taiwan, Miaoli Greenhouse
61 TaiwanMLQ3 Q QH3 DQ989549 Euphorbia pulcherrima 2006 Taiwan, Miaoli Greenhouse
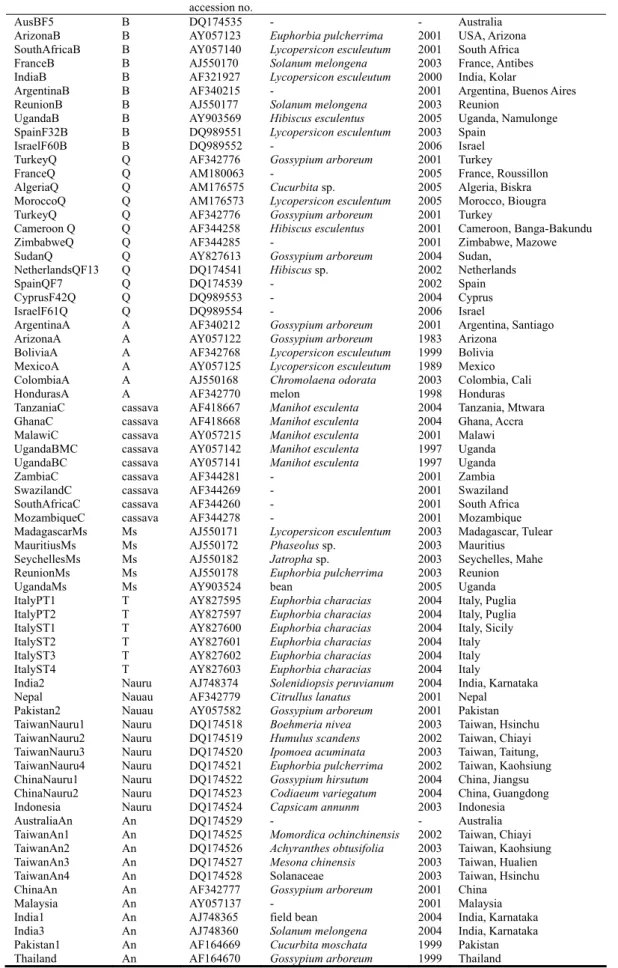
Table 2. Samples of Bemisia tabaci whose mtCOI sequences were used to construct the phylogenetic tree in Fig. 2.
Acronym Biotype GenBank
accession no.
Host plant Year Location
AusBF5 B DQ174535 - - Australia
ArizonaB B AY057123 Euphorbia pulcherrima 2001 USA, Arizona
SouthAfricaB B AY057140 Lycopersicon esculeutum 2001 South Africa
FranceB B AJ550170 Solanum melongena 2003 France, Antibes
IndiaB B AF321927 Lycopersicon esculeutum 2000 India, Kolar
ArgentinaB B AF340215 - 2001 Argentina, Buenos Aires
ReunionB B AJ550177 Solanum melongena 2003 Reunion
UgandaB B AY903569 Hibiscus esculentus 2005 Uganda, Namulonge
SpainF32B B DQ989551 Lycopersicon esculentum 2003 Spain
IsraelF60B B DQ989552 - 2006 Israel
TurkeyQ Q AF342776 Gossypium arboreum 2001 Turkey
FranceQ Q AM180063 - 2005 France, Roussillon
AlgeriaQ Q AM176575 Cucurbita sp. 2005 Algeria, Biskra
MoroccoQ Q AM176573 Lycopersicon esculentum 2005 Morocco, Biougra
TurkeyQ Q AF342776 Gossypium arboreum 2001 Turkey
Cameroon Q Q AF344258 Hibiscus esculentus 2001 Cameroon, Banga-Bakundu
ZimbabweQ Q AF344285 - 2001 Zimbabwe, Mazowe
SudanQ Q AY827613 Gossypium arboreum 2004 Sudan,
NetherlandsQF13 Q DQ174541 Hibiscus sp. 2002 Netherlands
SpainQF7 Q DQ174539 - 2002 Spain
CyprusF42Q Q DQ989553 - 2004 Cyprus
IsraelF61Q Q DQ989554 - 2006 Israel
ArgentinaA A AF340212 Gossypium arboreum 2001 Argentina, Santiago
ArizonaA A AY057122 Gossypium arboreum 1983 Arizona
BoliviaA A AF342768 Lycopersicon esculeutum 1999 Bolivia
MexicoA A AY057125 Lycopersicon esculeutum 1989 Mexico
ColombiaA A AJ550168 Chromolaena odorata 2003 Colombia, Cali
HondurasA A AF342770 melon 1998 Honduras
TanzaniaC cassava AF418667 Manihot esculenta 2004 Tanzania, Mtwara
GhanaC cassava AF418668 Manihot esculenta 2004 Ghana, Accra
MalawiC cassava AY057215 Manihot esculenta 2001 Malawi
UgandaBMC cassava AY057142 Manihot esculenta 1997 Uganda
UgandaBC cassava AY057141 Manihot esculenta 1997 Uganda
ZambiaC cassava AF344281 - 2001 Zambia
SwazilandC cassava AF344269 - 2001 Swaziland
SouthAfricaC cassava AF344260 - 2001 South Africa
MozambiqueC cassava AF344278 - 2001 Mozambique
MadagascarMs Ms AJ550171 Lycopersicon esculentum 2003 Madagascar, Tulear
MauritiusMs Ms AJ550172 Phaseolus sp. 2003 Mauritius
SeychellesMs Ms AJ550182 Jatropha sp. 2003 Seychelles, Mahe
ReunionMs Ms AJ550178 Euphorbia pulcherrima 2003 Reunion
UgandaMs Ms AY903524 bean 2005 Uganda
ItalyPT1 T AY827595 Euphorbia characias 2004 Italy, Puglia
ItalyPT2 T AY827597 Euphorbia characias 2004 Italy, Puglia
ItalyST1 T AY827600 Euphorbia characias 2004 Italy, Sicily
ItalyST2 T AY827601 Euphorbia characias 2004 Italy
ItalyST3 T AY827602 Euphorbia characias 2004 Italy
ItalyST4 T AY827603 Euphorbia characias 2004 Italy
India2 Nauru AJ748374 Solenidiopsis peruvianum 2004 India, Karnataka
Nepal Nauau AF342779 Citrullus lanatus 2001 Nepal
Pakistan2 Nauau AY057582 Gossypium arboreum 2001 Pakistan
TaiwanNauru1 Nauru DQ174518 Boehmeria nivea 2003 Taiwan, Hsinchu
TaiwanNauru2 Nauru DQ174519 Humulus scandens 2002 Taiwan, Chiayi
TaiwanNauru3 Nauru DQ174520 Ipomoea acuminata 2003 Taiwan, Taitung,
TaiwanNauru4 Nauru DQ174521 Euphorbia pulcherrima 2002 Taiwan, Kaohsiung
ChinaNauru1 Nauru DQ174522 Gossypium hirsutum 2004 China, Jiangsu
ChinaNauru2 Nauru DQ174523 Codiaeum variegatum 2004 China, Guangdong
Indonesia Nauru DQ174524 Capsicam annunm 2003 Indonesia
AustraliaAn An DQ174529 - - Australia
TaiwanAn1 An DQ174525 Momordica ochinchinensis 2002 Taiwan, Chiayi
TaiwanAn2 An DQ174526 Achyranthes obtusifolia 2003 Taiwan, Kaohsiung
TaiwanAn3 An DQ174527 Mesona chinensis 2003 Taiwan, Hualien
TaiwanAn4 An DQ174528 Solanaceae 2003 Taiwan, Hsinchu
ChinaAn An AF342777 Gossypium arboreum 2001 China
Malaysia An AY057137 - 2001 Malaysia
India1 An AJ748365 field bean 2004 India, Karnataka
India3 An AJ748360 Solanum melongena 2004 India, Karnataka
Pakistan1 An AF164669 Cucurbita moschata 1999 Pakistan
Table 3. Distribution of haplotypes, haplotype diversity (h), and nucleotide diversity (π) based on mtCOI sequences within populations of B. tabaci B and Q biotypes from Western North Pacific region
Biotype Population (n) Haplotype Haplotype
diversity (h) diversity (π)Nucleotide B BH1 BH2 BH3 BH4 BH5 BH6 ChinaB (18) 2 16 0.20915 0.00044 KoreaB (3) 3 - -JapanB (10) 1 1 1 7 0.53333 0.00127 TaiwanB (12) 2 10 0.30303 0.00064 Total 2 1 1 1 2 36 0.30011 0.00068 Q QH1 QH2 QH3 QH4 ChinaQ (6) 2 2 2 0.8 0.00226 KoreaQ (4) 3 1 0.5 0.00106 JapanQ (5) 1 3 1 0.7 0.00169 TaiwanQ (4) 4 - Total 2 1 12 4 0.57310 0.00138
Table 4. Hierarchical analysis of molecular variance and Φ-statistics of genetic differences for
Bemisia tabaci biotypes B and Q from the Western North Pacific region. Significant
population structure is tested among biotypes, among populations within biotypes, and within populations
Source of variation d.f. Sum of
squares components Variance Percent of variation Φ-statistics Among biotypes 1 274.797 10.41741 Va 98 ΦCT: 0.98004* Among populations within biotypes 6 1.478 0.00544 Vb 0.05 ΦSC: 0.02565 Within populations 54 11.161 0.20669 Vc 1.94 ΦST: 0.98056** Total 61 287.435 10.62953 * p < 0.05; ** p < 0.001.
Table 5. Pairwise estimates of FST among populations of Bemisia tabaci biotypes B and Q from
the Western North Pacific region
B biotype (n) 1 2 3 1 ChinaB (18) 2 KoreaB (3) 0.05882 3 JapanB (10) 0.0159 < 0.00001 4 TaiwanB (12) 0.07807 0.09091 0.03247 Q biotype (n) 1 2 3 1 ChinaQ (6) 2 KoreaQ (4) -0.04444 3 JapanQ (5) < 0.00001 -0.18182 4 TaiwanQ (4) 0.2 < 0.00001 < 0.00001
Fig. 1. Locations of samples of Bemisia tabaci biotypes B and Q in the Western North Pacific region. Numbers refer to specimens in Table 1.
91 57 83 99 99 88 99 100 88 100 100 99 99 100 97 99 100 100 99 91 100 82 97 100 99 91 Lipaleyrodes emiliae 0.1 Substitutions/site Q biotype B biotype Ms biotype An biotype Nauru biotype T biotype A biotype Cassava biotype 91 57 83 99 99 88 99 100 88 100 100 99 99 100 97 99 100 100 99 91 100 82 97 100 99 91 Lipaleyrodes emiliae 0.1 Substitutions/site Q biotype B biotype Ms biotype An biotype Nauru biotype T biotype A biotype Cassava biotype
Fig. 2. Phylogenetic tree of mitochondrial cytochrome oxidase I (mtCOI) sequences for Bemisia
tabaci based on Bayesian inferences. Numbers at the nodes are the posterior probabilities
計畫成果自評
本計畫執行今年度以分子分類為主,主要研究西北太平洋地區煙草粉蝨B 和 Q 生物小
種之分部狀態,探討此兩害蟲在此地區之存在是自然擴散或是人為入侵事件。此研究內容 符合原計畫方向,達成粉蝨分子分類之預期目標,適合發表在學術期刊,並已經在今年度
發表於國際期刊之環境昆蟲學 (Hsieh, C. H., C. H. Wang, and C. C. Ko. 2007. Evidence
from molecular markers and population genetic analyses suggest recent invasions of the Western North Pacific region by biotypes B and Q of Bemisia tabaci (Gennadius). Environmental Entomology. 36(4): 952-961)。研究內容證明煙草粉蝨 B 和 Q 生物小種在西北太平洋地區存 在多次的近期入侵事件,藉著景觀作物聖誕紅之世界貿易而入侵擴散。