Received October 17, 2005 Address for correspondence: MU-HSUAN HUANG
Department of Library and Information Science, National Taiwan University, Taipei, Taiwan E-mail: mhhuang@ntu.edu.tw
Research evaluation of research-oriented universities
in Taiwan from 1993 to 2003
MU-HSUAN HUANG,a HAN-WENCHANG,a DAR-ZEN CHENb
aDepartment of Library and Information Science, National Taiwan University, Taipei (Taiwan) bDepartment of Mechanical Engineering, National Taiwan University, Taipei (Taiwan)
Publications have been regarded as the most significant output indicating the research performance of universities. This paper uses ISI Essential Science Indicators (ESI) database to investigate the academic performance of research-oriented universities in Taiwan, adopting the bibliometric method from both quantitative and qualitative perspectives. The data cover the time span for 11 years from 1993 to 2003. The performance indicators applied in this study includes the number of papers, the number of citations, the average citations per paper, the number of highly cited papers, the number of hot papers, and the number of top papers. The research performance and the strength of those universities are revealed in this study, and it is found that National Taiwan University leads among these universities though each university still shows strengths in various specific fields.
Introduction
The competition among universities in R&D activities is growing fiercer. Not only a university manager pays much attention to the research performance of the universities, but also the authorities take notice of the country’s academic status in the world. After the Shanghai Jiao Tong University published the academic ranking of world universities (SHANGHAI JIAO TONG UNIVERSITY, 2003, 2004), the result causes quite a stir in Taiwan. Both of the research managers in universities and the policy makers of governments refer the outcomes of any research evaluation to help them supervise the R&D activities. For universities, the evaluation reveals the research status of a university’s strength and weakness, so it could assist the colleges in planning for their academic cooperation projects. On the other hand, for governments, the research evaluation of universities is often regarded as the references of budget allocation, so its related studies would be heavily referred by education policy makers. Therefore, there are many independent surveys and official reports of research evaluation devoting to the assessment of research performance of universities conducting with various purposes.
In Taiwan, the government and universities also have become increasingly interested in conducting research evaluation. Especially after implementing the policy of education reform, there is an extreme change in our higher education. The number of universities has doubled in the past few years, rapidly rising from 39 in the school year 1998–1999 to 75 in the school year 2004–2005. (MINISTRY OF EDUCATION, 2005) Universities are forced to face the competition of scarce resources and the authorities have to allocate the annual education budgets among universities deliberately. To examine the research capacity of Taiwanese universities, the Ministry of Education in Taiwan also made a survey to evaluate the research achievements of all Taiwanese universities and selected seven schools to be research-oriented universities in 2002. (NATION SCIENCE COUNCIL, 2003) According to the bibliometric methods, the final seven selected universities are National Taiwan University (NTU), National Tsing Hua University (NTHU), National Chiao Tung University (NCTU), National Central University (NCU), National Yang Ming University (NTMU), National Sun Yat-Sen University (NSYSU) and National Cheng Kung University (NCKU). The authority regards these universities as the key ones and plans to appropriate special funds for facilitating them to be internationally excellent. Besides, the government also plans to integrate these universities into two or three university systems with consideration for their specialties, research capacities, and some other reasons like locations and sizes. However, although the assessment has adopted the number of papers and the number of citations as the two most important indicators, the quality publications having been highly cited are not highlighted within it. Also, the analysis of a university’s research capacity only by overall fields may have a bias, and the strength of each university would be presented unfairly. Thus, this paper is aimed to use quality publications to reveal the research performances and strengths of these research-oriented universities of Taiwan.
Peer review and bibliometrics are the two most common major methods in the research evaluation. Although both of them have been criticized, each has its liability and efficiency. The peer review system has been mainly criticized for its subjectivity, dependency, and cost, but it remains an important element in the research evaluation if properly designed and practiced. Oppositely, the bibliometrics is significant of its objective indicators and easy manipulation. Although there are various arguments about bibliometric analysis, and the results have been doubted due to the conceptual, technical and methodological problems, bibliometric method is still used widely in research evaluation and regarded as a powerful support tool for the peer review system. (e.g., KING, 1987; VAN RAAN, 2005) The contributions of bibliometric methods are notable not only of its presenting simple calculations of academic publications, which have been recognized generally as the most important output of scholarly communication for a long time, but also of the direct and simple data provided by its quantitative outcomes for policy makers and administrators.
For the above reasons, bibliometric methods have been widely used in precious research evaluation to reveal the research capacity and competitiveness of universities or departments. (e.g., MOED et al., 1985; NEDERHOF et al., 1993; NEDERHOF & NOYONS, 1992; VAN RAAN, 1999) Most of the research evaluations projects were targeted on the universities in a country or in a specific field, such as the natural and life sciences, social sciences or humanities (e.g., COLMANet al., 1995; ERKUT, 2001; KIM & KIM, 2000; NEDERHOF & NOYONS, 1992; POMFRET & WANG, 2003; SCHLOEGL et al., 2003; ZACHOS, 1991), while some other studies focused on worldwide research evaluations. (e.g., BUSQUIN, 2001; SHANGHAI JIAO TONG UNIVERSITY, 2003, 2004) However, no matter what the scope of evaluation is, the number of papers and the number of citations are the two most popular indicators in these studies. For example, ZACHOS (1991) adopted publication counting and citations as the output indicators of research performance. Also, according to Centre for Science and Technology Studies’ (CWTS’s) project of research performance evaluation for all departments in Wageningen Agricultural University in Netherlands, the researchers mainly used two kinds of indicators – the output indicators based on the number of publications and the impact indicators based on the number of citations. (NEDERHOF et al., 1993)
In addition to these basic indicators such as the number of papers and the number of citations, some further indicators can also illustrate the research output quality of a school. For instance, the average citations per paper (or average citation rates or citation frequency) and the highly cited papers are both notable indicators in previous research evaluation studies. The average citations per paper are a relative indicator that reveals clearly and rapidly the effects of the number of papers and citations in combination. However, it is highly determined by only a few highly cited papers. Researchers do not exactly learn how these quality papers would be effective, unless the number of highly cited papers is also presented. In that situation, the highly cited papers is a supportive indicator with the concept of high quality papers, and the indicator has been regarded as a reliable predictor of the performance of a research group. (AKSNES, 2003; AKSNES & SIVERTSEN, 2004; PLOMP, 1990, 1994) Thus, this study uses this indicator to examine the great impact of the schools’ research outputs additionally. Furthermore, some other indicators focusing on quality papers are also added in, such as highly cited papers, hot papers and top papers. With that concept in mind, this study focuses on the quality of the published articles by calculating the number of academic papers published, the number of citations and average citations per paper, that is, the quantitative analysis, and the number of high quality publications (including the number of highly cited papers, hot papers, and top papers), which comprise the qualitative consideration. The high quality publications in this research are highly cited papers, hot papers and top papers from the Essential Science Indicators (ESI) database. Among them, highly cited papers are the ones ranking within the top 1% over the past ten years. Hot papers are
documents ranking within 0.01% in one particular field within the past two years. Top papers are the ones ranking in the top 1% in different years and fields.
In brief, emphasizing both of the quantitative and qualitative aspects of research performance over the universities’ publications during the past eleven years from 1993 to 2003, this study examines these research-oriented universities’ academic output by various indicators. First, the overview of the academic publication performance of these research-oriented universities is illustrated by using the number of papers, the number of citations, the average citations per paper, the highly cited papers, and the number of hot papers. Then, the research goes one step further and reviews the number of publications in the fields that shows higher rankings in ESI to reveal the merits of each university’s academic publications. In addition, this study also checks the fields, in which these universities make rankings in ESI, and assesses the quality of publications by the number of top papers.
Methodology
The source data for this study are gathered from the ISI Essential Science Indicators (ESI). This database contains a 10-year rolling file providing paper numbers and its impacts in specific fields of research. ESI provides access to high quality research papers, and reveals the ranks of research performance by scientists, institutions, countries and journals. The selected types of articles in the database include scientific papers, commentaries, meeting papers, and research records, excluding letters to the editor, notices, and abstracts.
This study uses ESI database to collect research data for 11 years from 1993 to 2003. To access the overall research performances and the advantaged research fields of Taiwanese research-oriented universities: NTU, NTHU, NCTU, NCU, NTMU, NSYSU and NCKU, this study applies six qualitative indicators to access these schools’ performances, including the number of papers, the number of citations, the average citations per paper, the number of highly cited papers, the number of hot papers, and the number of top papers. Among these indicators, the numbers of highly cited papers, hot papers and top papers need further definitions. According to ESI’s definitions, “highly cited papers” are frequently cited papers ranking within the top 1% each year of the database and each field of research. Due to the effect of age on the number of citations, the database ranks each paper only against other papers in its discipline that were published in the same year; therefore, the time effect of citation will be minimized. “Hot papers” are the papers published in the latest two years and meet the 0.01% citation threshold against other papers in the same field of research within the most recent two-month time period. Hot papers are cited extremely frequently and immediately by others in the same field. “Top papers” are the institution’s papers ranking in the top 1% in a specific field. (INSTITUTE FOR SCIENTIFIC INFORMATION, 2002)
This study also accesses the research performance of these universities by fields. However, it is important to note that ESI only provides the data for the universities that make the ranking in a specific discipline within the time period covered. A university would not be listed in the field of ESI if its number of citations does not meet the threshold of that field. Within the 21 specific fields in ESI database (except for multidisciplinary), this paper illustrates 13 fields in which Taiwanese universities are listed. The 13 fields include Agricultural Sciences, Biology & Biochemistry, Chemistry, Clinical Medicine, Computer Science, Engineering, Environment/Ecology, Geosciences, Materials Science, Social Sciences, General, Physics, Plant & Animal Science, and Pharmacology & Toxicology, with the exceptions of Economics & Business, Immunology, Mathematics, Microbiology, Molecular Biology & Genetics, Neuroscience & Behavior, Psychology/Psychiatry, and Space Sciences. Furthermore, the study groups the 13 fields into six major categories: Engineering, Life Science, Social Science, Natural Science, Agricultural Sciences, and Medical Science. In this paper, research performances of the seven universities in these specific categories and fields are analysed by four indicators, including the number of papers, the number of citations, the average citations per paper, and the number of top papers.
Overall performance of research-oriented universities
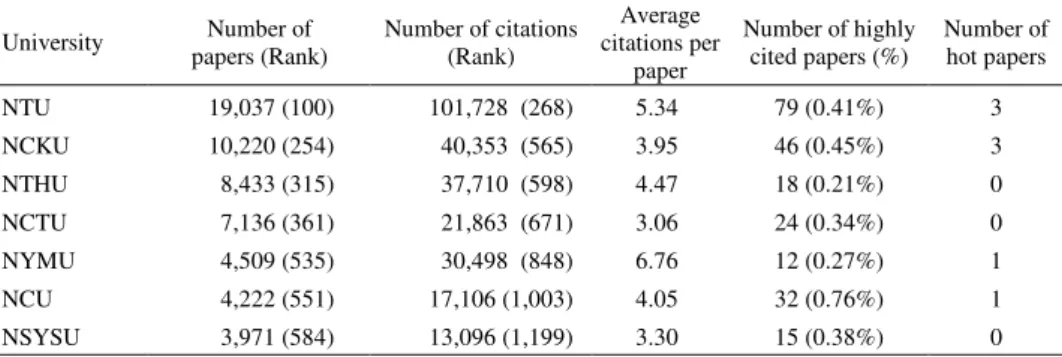
First, this study evaluates the overall academic performance of research-oriented universities in Taiwan from 1993 to 2003, with the bibliometric indicators: the number of papers, the number of citations, the average citations per paper, the number of highly cited papers, and the number of hot papers. Table 1 summarizes an overview of these universities’ academic performances. Concerning the total publication output, Table 1 shows NTU as the leader of the group and ranks the 100th in the globe. As for the rest of these universities, NCKU, NTHU and NCTU rank around top 400, with NCKU as the 254th, NTHU as the 315th, and NCTU being the 361st, and NYMU, NCU and NSYSU fall behind the top 600. This is an indication which shows that the quantity of published works has a lot of room for improvement.
When it comes to the number of citations of publications by these research-oriented universities over the past eleven years, Table 1 shows that NTU is at the top and exceeds others by a lot in this indicator. The relative rankings among these universities in this indicator are almost as the same as the rankings of the number of papers, except that NYMU and NCTU are exchanged. In another word, this study finds that the ranking orders of these universities are similar in the indicators of papers and citations, but the range is quite different. Despite the static relative rankings among these universities, there is an extreme decline in the number of citations in global ranking. These universities rank from 100 to 584 by the number of papers but from 268 to 1,199 by the number of citations. None of these schools reached top 200, and NCU and
NSYSU do not even enter the ranking of top 1,000. It reveals that the universities’ performances on the number of citations are not as good as those on papers. The impact of the universities’ scientific publications is limited during the past eleven years in the world.
Table 1. Overall performance of research-oriented universities in Taiwan from 1993 to 2003 University Number of papers (Rank) Number of citations (Rank) Average citations per paper Number of highly cited papers (%) Number of hot papers NTU 19,037 (100) 101,728 (268) 5.34 79 (0.41%) 3 NCKU 10,220 (254) 40,353 (565) 3.95 46 (0.45%) 3 NTHU 8,433 (315) 37,710 (598) 4.47 18 (0.21%) 0 NCTU 7,136 (361) 21,863 (671) 3.06 24 (0.34%) 0 NYMU 4,509 (535) 30,498 (848) 6.76 12 (0.27%) 1 NCU 4,222 (551) 17,106 (1,003) 4.05 32 (0.76%) 1 NSYSU 3,971 (584) 13,096 (1,199) 3.30 15 (0.38%) 0
Note: 1. Rank is the institute’s global ranking. 2. The percentage of highly cited papers is equal to the number of highly cited papers divided by the number of papers.
As for the average citations per paper, these numbers show a change in ranking among these universities as compared to the previous indicators. In this indicator, there are some variations in the ranking. NTU no longer ranks the top 1 among these universities. Among these universities, instead, NYMU ranks as the highest one with a ratio of 6.76, while NCTU ranks as the lowest with a ratio of 3.06. Similarly, NCKU is listed higher in the ranking of the number of papers and citations, but lags to the 5th in the ranking of average citation rate, while NCU rises in the ranking of the average citation rate – it ranks the 6th in the ranking of the number of papers and citations among these universities but up to the 4rd in the average citation rate.
As for the number of highly cited papers, NTU is still the top 1 among these universities. With 79 highly cited papers, it leads much higher than others in this period. In contrary, NYMU is the last one with 12 highly cited papers merely. However, there is a different picture of the percentage of highly cited papers; that is, NCU ranks as the highest one with 0.76%, while NTHU is the lowest one with 0.21%.
As for the hot papers, these universities do not perform very well in this indicator. There are only 13 hot papers generated by four of these schools: NTU, NCKU, NCU and NYMU. In detail, NCKU has three hot papers as well as NTU does, while NCU and NYMU have one hot paper respectively and the rest three universities have no hot papers. It reveals that the papers of these universities are not cited immediately and widely after they were published.
To summarize, NTU performs best among these universities in the overall rankings of research evaluation by the bibliometric indicators mentioned above. It is obvious that
NTU is at the top among these universities in almost every indicator, except for its ranking the 2nd in the average citation rate, and it also surpasses other universities in the global rankings. NCKU follows. Although it does not perform as strikingly as NTU, this school has good performances in most of the indicators. NTHU, NCTU, NYMU, and NCU are at the middle level among these universities but with different patterns in the bibliometric indicators. NTHU ranks higher in the number of papers, the number of citations, and the average citation rate (4.47%), but holds the lowest percentage in the highly cited papers (0.21%). Likewise, NYMU is similar with NTHU because of its high average citation rate (6.76%) and the low percent of highly cited papers (0.27%). Comparing with other schools, most of NCU’s citations are created due to its highly cited papers. As for NCTU, its performance is mean in both of the indicators of papers and citations. Moreover, NSYSU falls behind in most of the indicators among these universities. It needs to improve its research performances both on the quantitative and qualitative perspectives.
The research performance by fields
This study also surveys the research performances of these universities by fields defined in the ESI database, and analyzes the number of papers, the number of citations, average citations per paper and the number of top papers for each field to compare each university’s strength and weakness. As mentioned before, not every university is analyzed within each field in this study. Only when the universities meet the thresholds, the researchers can get the data from ESI. These thresholds depend on the number of citations that the institutions (or universities) received, so each field has different threshold.
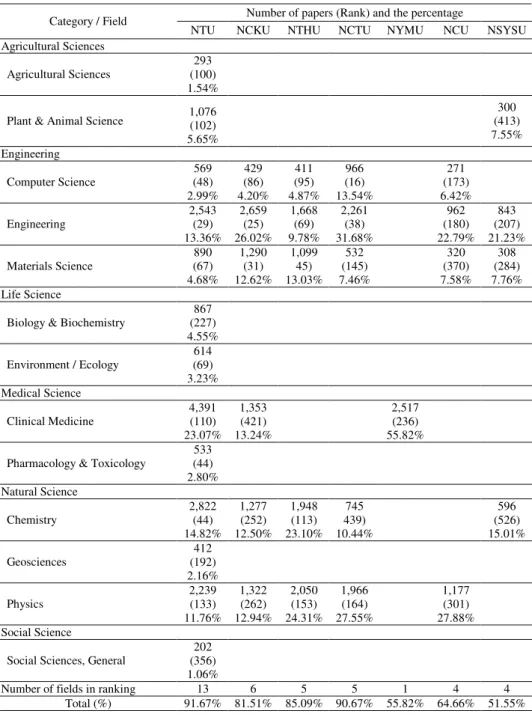
Table 2 shows the number of papers in ESI fields by these universities. Of all the universities in these 13 fields, NTU is the best one that takes possession of 91.67% in the accumulative percentage, while the last one, NSYSU, also exceeds 50% in total. Comparing the number of fields listed in the ESI ranking within these universities, NTU’s publications are ranked in 13 fields, spreading out in all six major categories, including Life Science and Social Science, in which no other schools rank. With contrast, NYMU is the only school that makes ranking in the ESI field of Clinical Medicine. The remaining five universities make the ranking in four to six categories. Although Table 2 lists the fields listed in ESI ranking by the number of papers, it cannot objectively explain why some of the fields do not make the ranking. Further consideration of the university’s structure and research emphasis will bring a more accurate evaluation. In this study, for example, NTU and NYMU differentiate mainly because of their history of development and the research orientation. NTU has been long-standing in its diverse research since 1945 (including six colleges of Liberal Arts, Law, Science, Medicine, Engineering, and Agriculture), whereas NYMU was just reorganized and renamed from National Yang-Ming Medical College in 1994.
However, in spite of the short history, NYMU could increase its influence by promoting the achievements to other universities in medical science, or enhance its capacity by having the cooperation with other universities in non-medical science in the future.
In the category of Agriculture Sciences, only two schools, NTU and NSYSU, enter the ESI ranking. In the field of Agricultural Sciences, NTU published 293 papers to rank as the 100th. In Plants & Life Science, NTU ranks favorably as the 102nd, with 1,076 papers comparing to NSYSU. These two universities rank in Agricultural Sciences because of their related colleges – NTU has a long history on its College of Bio-Resources and Agriculture established in 1928 (during the Japanese colonization) and restored in 1945 (after World War II), and NSYSU develops the College of Marine Sciences because of its geographical features.
Under the category of Engineering, in the fields of Computer Science, Engineering, and Materials Science, with the exception of NYMU that does not make any ranking, and NSYSU does not make ranking in Computer Science, all other schools fare well. NTU, NCKU, and NTHU all rank within global top 100. Among these rankings, NCTU published 966 papers in Computer Science, ranking the 16th in the world. NCKU and NTU perform well in Engineering with more than 2,500 papers and rank within top 30 – NCKU published 2,659 papers, bringing itself to top 25, and NTU’s 2,543 articles bring itself to the 29th. In Materials Science, NCKU’s 1,290 publications make it rank as the 31st in the global ranking.
In the category of Medical Science, only Clinical Medicine and Pharmacology & Toxicology are listed in ESI ranking. Being predominant universities with hospital facilities, the schools listed in this category are NTU, NCKU, and NYMU. In the field of Clinical Medicine, NTU leads the pack with 4,391 papers, ranking as the 110th. In Pharmacology & Toxicology, only NTU makes the ranking, with 533 papers to rank as the 44th. Among these schools, NTU is the leader not only because of its better performance in Clinical Medicine, but also because of its only ranking in Pharmacology & Toxicology of the category.
Natural Science is another category these universities excelled in, with rankings in Chemistry, Geosciences, and Physics. Among the schools, NTU tops with 2,822 papers, ranking the 44th. NTU is also the only university that makes rank in Geosciences, ranking the 192nd with 412 papers. In Physics, NTU leads again with 2,239 papers, ranking the as 133rd. As a whole, these schools’ output quantity in this category is not as productive as it is in the Engineering category. Only NTU makes rank in all three fields: Chemistry, Geosciences, and Physics.
Additionally, NTU is the only school ranking in Life Science and Social Science. In the category of Life Science, only NTU makes the ranking in both two fields of Biology & Biochemistry with 867 papers that ranks the 227th and Ecology/Environment with 614 papers that ranks the 69thin the world. In Social Science, again, NTU’s publication output makes it the only one in the ranking, with 202 papers that ranks the 356th globally.
Comparing the number of papers in each field listed in ESI ranking within the universities, the advantaged fields of each school are also revealed. For example, in spite of the diverse developments, NTU is especially remarkable in Engineering, Chemistry, Pharmacology and Toxicology, and Computer Science with the excellent worldwide rankings. Also, NCTU and NCU are outstanding in the field of Computer Science as NCKU and NSYSU perform excellently in the field of Engineering. For NTHU, Materials Science is the most notable field, and Clinical Medicine is NYMU’s specialty. However, all of these analyses are resulted from the perspective of quantity. It would be getting more completed after considering the impact of publications.
The number of citations and average citations per paper in these universities’ research in the ESI fields is shown in Table 3. With these indicators, Engineering is the best category in which these universities performed. There are six schools making themselves rank in this category (expect for NYMU), and four of them – NTU, NCKU, NTHU, and NCTU even rank within top 100 in this category. From the number of citations in the three fields of Engineering, NCTU is at the top in Computer Science with 1,554 citations and the only school within top 100 in the world. In Engineering, there are three schools ranking within top 100, including NTU, NCKU and NCTU. In Materials Science, the best school is NCKU with 4,307 citations and ranks as the 75th. These universities do not perform significantly in the rest of the categories and fields as well as in Engineering. From the average citations per paper, most of these schools also perform excellently in the category of Engineering, especially in Engineering and Materials Science. As Table 3 shows, NCU and NSYSU perform better than the threshold of Engineering requires. In Materials Science, NTU slightly exceeds the worldwide level while NCKU, NTHU and NCTU are close to it.
Within other categories, NTU is the most outstanding school with its performances in the number of citations and the average citations per paper. In the category of Agricultural Sciences, NTU leads with 1,280 and 5,048 citations respectively in the two fields, making it rank as the 130thand the 180th. It is also strong over all in the number of citations per paper, with 4.37 in Agricultural Sciences and 4.69 in Plants & Animal Science. In Life Science, only the number of citations of NTU only makes ranking in Biology & Biochemistry and Ecology/Environment, with the number of citations of 6,260 (ranking No. 430) and 2,569 (ranking No. 204), respectively.
Table 2. Number of papers in fields by research-oriented universities in Taiwan from 1993 to 2003 Number of papers (Rank) and the percentage Category / Field
NTU NCKU NTHU NCTU NYMU NCU NSYSU
Agricultural Sciences Agricultural Sciences
293 (100) 1.54% Plant & Animal Science 1,076(102) 5.65% 300 (413) 7.55% Engineering Computer Science 569 (48) 2.99% 429 (86) 4.20% 411 (95) 4.87% 966 (16) 13.54% 271 (173) 6.42% Engineering 2,543 (29) 13.36% 2,659 (25) 26.02% 1,668 (69) 9.78% 2,261 (38) 31.68% 962 (180) 22.79% 843 (207) 21.23% Materials Science 890 (67) 4.68% 1,290 (31) 12.62% 1,099 45) 13.03% 532 (145) 7.46% 320 (370) 7.58% 308 (284) 7.76% Life Science
Biology & Biochemistry
867 (227) 4.55% Environment / Ecology 614 (69) 3.23% Medical Science Clinical Medicine 4,391 (110) 23.07% 1,353 (421) 13.24% 2,517 (236) 55.82% Pharmacology & Toxicology
533 (44) 2.80% Natural Science Chemistry 2,822 (44) 14.82% 1,277 (252) 12.50% 1,948 (113) 23.10% 745 439) 10.44% 596 (526) 15.01% Geosciences 412 (192) 2.16% Physics 2,239 (133) 11.76% 1,322 (262) 12.94% 2,050 (153) 24.31% 1,966 (164) 27.55% 1,177 (301) 27.88% Social Science
Social Sciences, General
202 (356) 1.06%
Number of fields in ranking 13 6 5 5 1 4 4
Total (%) 91.67% 81.51% 85.09% 90.67% 55.82% 64.66% 51.55%
Note: 1. Rank is the institute’s global ranking. 2. The percentage is the university’s number of papers ranking in ESI divided by its total number of papers in each field. 3. The total percentage is the accumulative percentage of each field.
Table 3. Number of citations and average citations per paper in fields by research-oriented universities in Taiwan from 1993 to 2003
Number of citations (Rank) and Average citation per paper Category / Field
NTU NCKU NTHU NCTU NYMU NCU NSYSU
Agricultural Sciences Agricultural Sciences (Threshold: 525 citations; 4.39 in average) 1,280 (130) 4.37 Plant & Animal Science
(Threshold: 989 citations; 5.82 in average) 5,048 (180) 4.69 1,195 (602) 3.98 Engineering Computer Science (Threshold: 477 citations; 2.31 in average) 1,092 (109) 1.92 701 (176) 1.63 778 (159) 1.89 1,554 (68) 1.61 521 (244) 1.92 Engineering (Threshold: 521 citations; 2.88 in average) 6,881 (68) 2.71 6,661 (71) 2.51 5,091 (119) 3.05 6,385 (76) 2.82 3,033 (219) 3.15 2,538 (256) 3.01 Materials Science (Threshold: 736 citations; 3.85 in average) 3,437 (102) 3.86 4,307 (75) 3.34 3,700 (95) 3.37 2,000 (196) 3.76 1,030 (394) 3.22 874 (436) 2.84 Life Science
Biology & Biochemistry (Threshold: 4,273 citations; 15.1 in average) 6,260 (430) 7.22 Environment / Ecology (Threshold: 1,140 citations; 7.1 in average) 2,569 (204) 4.18 Medical Science Clinical Medicine (Threshold: 1,172citations; 9.98 in average) 28,453 (272) 6.48 8,355 (656) 6.18 15,709 (414) 6.24 Pharmacology & Toxicology
(Threshold: 1,885 citations; 8.94 in average) 3,815 (120) 7.16 Natural Science Chemistry (Threshold: 2,639 citations; 7.57 in average) 16,742 (151) 5.93 5,435 (457) 4.26 11,160 (252) 5.73 3,887 (581) 5.22 2,884 (708) 4.84 Geosciences (Threshold: 1,836 citations; 7.44 in average) 2,168 (294) 5.26 Physics (Threshold: 3,688 citations; 6.89 in average) 9,591 (319) 4.28 4,765 (510) 3.6 10,098 (309) 4.93 6,576 (423) 3.34 6,246 (441) 5.31 Social Science
Social Sciences, General (Threshold: 337 citations; 3.2 in average)
554 (417) 2.74 Number of categories in ranking
(totally 6 categories) 6 3 2 2 1 2 3
Number of fields in ranking (totally
22 fields) 13 6 5 5 1 4 4
Note: 1. Rank is the institute’s global ranking. 2. The average citation rate is the university’s number of citations divided by its number of papers ranking in ESI in each field.
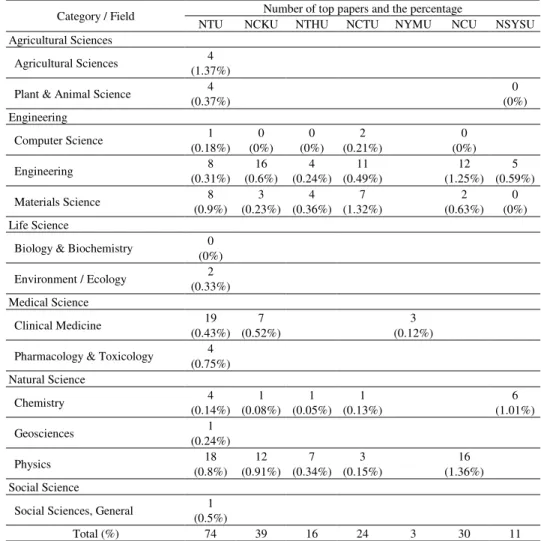
Table 4. Number of top papers in fields by research-oriented universities in Taiwan from 1993 to 2003 Number of top papers and the percentage
Category / Field
NTU NCKU NTHU NCTU NYMU NCU NSYSU
Agricultural Sciences
Agricultural Sciences 4
(1.37%) Plant & Animal Science 4
(0.37%) 0 (0%) Engineering Computer Science 1 (0.18%) 0 (0%) 0 (0%) 2 (0.21%) 0 (0%) Engineering 8 (0.31%) 16 (0.6%) 4 (0.24%) 11 (0.49%) 12 (1.25%) 5 (0.59%) Materials Science 8 (0.9%) 3 (0.23%) 4 (0.36%) 7 (1.32%) 2 (0.63%) 0 (0%) Life Science
Biology & Biochemistry 0 (0%) Environment / Ecology 2 (0.33%) Medical Science Clinical Medicine 19 (0.43%) 7 (0.52%) 3 (0.12%) Pharmacology & Toxicology 4
(0.75%) Natural Science Chemistry 4 (0.14%) 1 (0.08%) 1 (0.05%) 1 (0.13%) 6 (1.01%) Geosciences 1 (0.24%) Physics 18 (0.8%) 12 (0.91%) 7 (0.34%) 3 (0.15%) 16 (1.36%) Social Science
Social Sciences, General 1 (0.5%)
Total (%) 74 39 16 24 3 30 11
Note: 1.The percentage is the university’s number of top papers ranking in ESI divided by its total number of papers in each field. 2.The zero number of top papers means that the universities has met the threshold of highly cited papers making them list in the ranking, but had no papers met the citation threshold of top papers listing.
As for Medical Science, again NTU leads in the fields of Clinical Medicine and Pharmacology & Toxicology, with 28,453 citations ranking the 272nd in the former field, and 3,815 times of citation to rank the 120th in the latter. As for the average citations, NTU leads with respective average numbers of 6.48 and 7.16 in these two fields. Besides, NTU is also the only institution listed in the ranking of Social Science, with citation frequency of 554, ranking the 417th.
In Natural Science, the university that performs best is NTU in Chemistry, with the number of citations of 16,742 to rank as the 151st. It also has higher average citations per paper in Chemistry and Geosciences, with the rates of 5.93 and 5.26. However, in Physics, NTHU leads among these with the number of citations of 10,098 to rank the 309th and NCU has higher average citations of 5.31 in this field. Moreover, when it comes to the average citations per paper within individual fields, NCU performs well in particular, especially higher than its peers in Computer Science, Engineering, and Physics (juxtaposes ranks No. 1 in Computer Science with NTU).
Basically, for the fields that are listed in the ranking by these research-oriented universities in Taiwan, that the number of citations would be influenced by the number of papers is also proved. There is approximately a direct ratio between these two indicators. Most of universities having a large number of papers in some field also receive a large number of citations in the same field. However, there are two exceptions in Engineering and Physics. Although NCKU publishes more papers than NTU, it has fewer citations in Engineering. Also, in the field of Physics, NTU has a large amount of papers, but NTHU has a higher frequency of being cited. In addition, the previous analysis and the statistics in Table 2 also show the average citations per paper to be lower than the global average as a whole, with exceptions of NTHU, NCU, and NSYSU in the field of Engineering, and NTU in the field of Materials Science merely. Also, the rankings in the number of citations are generally not very high. The gap between quantity and quality may be explained by language barrier, citation habits and other reasons. To bring more recognition for Taiwan’s research efforts and to increase the number of citations are important and urgent for improvement of the universities’ research quality.
From the perspective of high quality publications, this study uses a special indicator – the number of top papers. The so-called top papers are papers in the ESI database ranking in the top 1% from different publication years and fields of study. These publications are similar to the highly cited papers, with the difference that the number of top papers is calculated only if an institute meets the citation threshold of a specific field (not accumulating for several fields). The outcomes of top papers generated from seven universities are presented in Table 4. The statistics here still shows NTU is at the lead with 74 such papers, far more than the remaining six schools with less than 40 papers. At the last of the rank is NYMU, which has only 3 top papers.
Comparing the number of top papers with the number of highly cited papers, except for NYMU, the remaining universities remain in the same rankings. Within the fields of Engineering, NCU has the higher percentage with 1.25% in Engineering, although NCKU has more top papers in number. Similarly, NCTU perform better in percentage with 1.32% in Materials Science, while NTU has a higher number of papers. There are also the same situations in other categories – the fields of Physics and Clinical Medicine. Apart from NCU in Engineering and NCTU in Materials Science, the schools
whose percentages are over 1% are included: NTU with 1.37% in Agricultural Sciences, NCU with 1.36% in Physics, and NSYSU with 1.01% in Chemistry.
For individual universities, the indicator of top papers does provide an alternative way to reveal their research advantages. For example, NTU has a higher percentage in Agricultural Sciences among all fields, although that is not so remarkable in the former indicators. Also, both NCKU and NSYSU have the potential to develop their influence in Physics and Chemistry, respectively; however, that is not revealed clearly in the number of papers and citations.
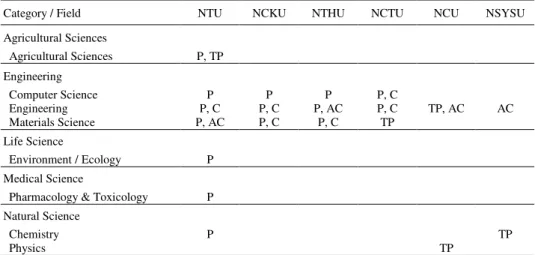
All of these seven universities in Taiwan perform well in the category of Engineering, with Natural Science the next. To elaborate on the universities’ research performances in the 13 fields, Engineering is still the best one on the perspectives of quantities and qualities. Table 5 concludes four indicator papers which evaluate research performances by fields, including the number of papers, the number of citations, the average citations per paper and the number of top papers.
Table 5. Publication performances in fields by research-oriented universities in Taiwan from 1993 to 2003
Category / Field NTU NCKU NTHU NCTU NCU NSYSU
Agricultural Sciences Agricultural Sciences P, TP Engineering Computer Science P P P P, C Engineering P, C P, C P, AC P, C TP, AC AC Materials Science P, AC P, C P, C TP Life Science Environment / Ecology P Medical Science
Pharmacology & Toxicology P Natural Science
Chemistry P TP
Physics TP
Note: 1.The university (NYMU) and fields which are not selected by the rules below are excluded. 2. “P” stands for “papers”. The column marked “P” means that the university ranks globally within top 100 in that field by the number of papers. 3. “C” stands for “citations”. The column marked “C” means that the university ranks globally within top 100 in that field by the number of citations. 4. “AC” stands for “average citation”. The column marked “AC” means that the university exceeds the threshold of that field by the average citations per paper. 5. “TP” stands for “top papers”. The column marked “TP” means that the university’s percentage of top papers exceeds 1% in that field.
With consideration of these four indicators simultaneously and comparing them to the worldwide level (or threshold), the advantages or strength of each school would be revealed. For NTU, it ranks in all 13 fields, being especially outstanding in Agricultural Sciences, Environment/Ecology, Pharmacology & Toxicology, Chemistry and all the three fields of Engineering. For NCKU, NTHU and NCTU, they are all good in
Engineering, but the former two schools have more influence in Materials Science relative to the third school with more quality papers in the same field. NCTU has more influence than NCKU and NTHU in Computer Science. For NCU and NSYSU, they are not noticed if only evaluated by the number of papers without considering their average citations per paper. With diverse indicators, NCU could discover its good performance in Engineering and Physics, and so could NSYSU, which would be aware of its potential in Engineering and Chemistry. As for NYMU, which is concentrated on the field of Clinical Medicine, it is not significant when comparing with the global level. This result reveals that NYMU needs to make progress lastingly on its specialty.
On the other hand, from the development of field, there is no school competed with the worldwide level in the fields of Plant & Animal Science, Biology & Biochemistry, Clinical Medicine, Geosciences and Social Sciences. Most of these fields have only one school ranking in it. Regardless of NTU, it still needs more other research universities devoted into these fields. The authorities should not only emphasize on the overall performances of individual university but also balance the development between universities or fields.
Conclusion
Since there is no regular or periodical report of research evaluation in Taiwan yet, the study does provide an alternative viewpoint of it. Through the various indicators and the analyses, not only the academic performances of the universities in Taiwan have been shown, but also the universities’ research advantages or strengths are revealed. Generally speaking, NTU leads by much more number of papers and citations, but it ranks behind NTMU in the average citations per papers. When considering other indicators of publications, such as the number of highly cited papers and the number of hot papers, NTU still leads in all three indicators. Oppositely, NSYSU performs laggardly in all indicators, even in the number of top papers, and would be regarded as the last one among these schools. On the other hand, when it comes to the high quality papers only measured by the number of highly cited papers, hot papers and top papers, NTU still performs excellently, while NYMU, NSYSU and NTHU are generally low.
In terms of the analyses by fields, the strengths of each university are examined. NTU shows its advantages in most of the fields, especially in Agricultural Sciences, Computer Science, Engineering, Materials Science, Environment/Ecology, Pharmacology & Toxicology and Chemistry. Others show theirs in various specialties. For example, NCKU performs well in Computer Science, Engineering, and Materials Science; moreover, it performs superiorly in Engineering and Materials Science with greater influence. NTHU and NCTU, similar with NCKU, are also noticed in the three fields of the Engineering category. NCU performs outstandingly in Engineering and Physics with more influence in Engineering. NSYSU has high quality outputs in
Chemistry, but is also remarkable in Engineering. Among all the universities, NYMU is focused on one field – Clinical Medicine; however, it performs not very significantly with middle ranking in the world. To enhance its competition, this school’s managers need to make efforts to increase its research outputs both in quantities and qualities.
Moreover, the study also reveals the research performance of these universities in individual fields. Except for Agricultural Sciences, Biology & Biochemistry, Environment/Ecology, Pharmacology & Toxicology, Geosciences, Social Sciences, General, in which only NTU exceeds the thresholds and ranks, there are some best-performed or most-influenced universities in other individual fields. In Computer Science, NCTU leads both in the quantity and quality aspects of the highest papers and citations, and has the highest quality publications in terms of top papers in this field. In Engineering, the category that the Taiwanese universities perform best in, NTU, NCKU, NTHU, NCTU, NCU and NSYSU all have excellent performances. Among them, all the six schools are noticed with their great impacts of the publication outputs, while NTU, NCKU, NTHU and NCTU are especially outstanding in the number of papers. Besides, NCU also performs well in top papers. In Materials Science, NCKU is the highest both in the number of papers and citations, while NTU is good at average citations per paper and the number of top papers. In Chemistry and Physics, NTU has most papers in both fields and great influence in Chemistry. Besides, NSYSU performs well in the indicator of high quality publications in Chemistry and NTU is good at the field of Physics. Furthermore, in Plants & Animal Sciences and Clinical Medicine, in which only two or three universities rank, NTU is the best among these universities. However, there are few universities better than the threshold of each field in the qualitative indicators.
This paper finds that each of these research-oriented universities has its strengths in various specific fields. However, it also reveals that the quantitative performance of these universities’ papers is better than their qualitative performance. The result shows that these universities need to endeavor to bridge the discrepancy between quantity and quality of their academic research publications. For these universities, it would be a good point to further their advantaged fields and promote related cooperation with other research institutions.
*
The authors greatly appreciate Thomson ISI for their generous help to provide the trial account of the ESI database in March 2004.
References
AKSNES, D. W. (2003), Characteristics of highly cited papers. Research Evaluation, 12 (3) : 159–170. AKSNES, D. W., SIVERTSEN, G. (2004), The effect of highly cited papers on national citation indicators.
Scientometrics, 59 (2) : 213–224.
BUSQUIN, P. (2001), Key figures 2001: towards a European research area. Retrieved September 8, 2004, from http://europa.eu.int/comm/research/era/pdf/benchmarking2001.pdf
COLMAN, A. M., DHILLON, D., COULTHARD, B. (1995), A bibliometric evaluation of the research performance of British university politics departments – Publications in leading journals. Scientometrics, 32 (1) : 49–66.
ERKUT, E. (2001), Comparing research output and impact of Canadian business schools in OR Journal. Retrieved September 8, 2004, from http://www.cors.ca/bulletin/v35n4_1e.pdf
INSTITUTE FOR SCIENTIFIC INFORMATION, (2002), Essential Science Indicators SM v1.0. Retrieved January 5, 2005, from http://www.isinet.com/media/presentrep/tspdf/sem-esi-1-0-0702.pdf
KIM, M. J., KIM, B. J. (2000), A bibliometric analysis of publications by the Chemistry Department, Seoul National University, Korea, 1992–1998. Journal of Information Science, 26 (2) : 111–119.
KING, J. (1987), A review of bibliometric and other science indicators and their role in research evaluation. Journal of Information Science, 13 (5) : 261–276.
MINISTRY OF EDUCATION, R. O. C. (2005), Summary of universities, colleges and junior colleges. Retrieved April 3, 2005, from http://www.edu.tw/EDU_WEB/EDU_MGT/STATISTICS/EDU7220001/data/serial/u.xls MOED, H. F., BURGER, W. J. M., FRANKFORT, J. G., VAN RAAN, A. F. J. (1985), The use of bibliometric data
for the measurement of university-research performance. Research Policy, 14 (3) : 131–149.
NATIONAL SCIENCE COUNCIL (2003), Evaluation of research achievement for universities and colleges in Taiwan: a middle term report. Taipei, Taiwan: Nation Science Council.
NEDERHOF, A. J., MEIJER, R. F., MOED, H. F., VAN RAAN, A. F. J. (1993), Research performance indicators for university departments: A study of an agricultural university. Scientometrics, 27 (2) : 157–178. NEDERHOF, A. J., NOYONS, E. C. M. (1992), Assessment of the international standing of university
departments research: A comparison of bibliometric methods. Scientometrics, 24 (3) : 393–404. NEDERHOF, A. J., NOYONS, E. C. M. (1992), International comparison of departments research performance
in the humanities. Journal of the American Society for Information Science, 43 (3) : 249–256.
PLOMP, R. (1990), The significance of the number of highly cited papers as an indicator of scientific prolificacy. Scientometrics, 19 (3–4) : 185–197.
PLOMP, R. (1994), The highly cited papers of professors as an indicator of a research groups scientific performance. Scientometrics, 29 (3) : 377–393.
POMFRET, R., WANG, L. C. (2003), Evaluating the research output of Australian universities’ economics departments, Australian Economic Papers, 42 (4) : 418–441.
SCHLOEGL, C., GORRAIZ, J., BART, C., BARGMANN, M. (2003), Evaluating two Austrian university departments: Lessons learned. Scientometrics, 56 (3) : 287–299.
SHANGHAI JIAO TONG UNIVERSITY (2003), Academic ranking of world universities 2003. Retrieved January 3, 2005, from http://ed.sjtu.edu.cn/rank/2004/2004main.htm
SHANGHAI JIAO TONG UNIVERSITY (2004), Academic ranking of world universities 2004. Retrieved January 3, 2005, from http://ed.sjtu.edu.cn/rank/2004/2004main.htm
VAN RAAN, A. (1999), Advanced bibliometric methods for the evaluation of universities. Scientometrics, 45 (3) : 417–423.
VAN RAAN, A. F. J. (2005), Fatal attraction: Conceptual and methodological problems in the ranking of universities by bibliometric methods. Scientometrics, 62 (1) : 133–143.
ZACHOS, G. (1991), Research output evaluation of two university departments in Greece with the use of bibliometric indicators. Scientometrics, 21 (2) : 195–221.