Journal of Contaminant Hydrology, 15 (1994) 345-366 345 Elsevier Science B.V., Amsterdam
Modeling of selenium transport at the Kesterson
reservoir, California, U.S.A.
Chen Wuing Liu a and T.N. Narasimhan b
aDepartment of Agricultural Engineering, National Taiwan University, Taipei, Taiwan, ROC bDepartment of Materials Science and Mineral Engineering, University of California at Berkeley,
Berkeley, CA 94720, USA
(Received July 2, 1992; revised and accepted December 2, 1993)
ABSTRACT
Field observations indicated that the vertical movement of a selenium plume from the pond into the selenium-free groundwater at the Kesterson reservoir lags significantly behind the hydrodynamic front. The movement of selenium was simulated using D Y N A M I X , a redox- controlled, multiple species chemical transport model. The actual nature of the retardation mechanism, whether it is inorganically controlled or biologically controlled, is not yet clearly understood. In the present work, the observed retardation is treated equivalently by treating the organic layer of pond-bottom sediments as a medium of oxygen consumption. In addition, the dissolution of magnetite in the contaminated aquifer was treated as a kinetic process. The agreement between the observed and computed results suggests that the inorganic process could at least be a contributing factor in the retardation of the selenium front. Further research is needed to investigate the microbial effect on the movement of selenium.
1. I N T R O D U C T I O N
The San Joaquin o f California supports > 0.25.106 a c r e s intensely irrigated farmland. In order to maintain the high productivity of the land by inhibiting the salt accumulation, an elaborate subsurface drainage system has been constructed. The San Luis Drain, shown in Fig. 1, was built to carry away waste water flushed from the irrigated farmlands of the West San Joaquin Valley. Originally, the San Luis Drain was intended to empty into the S a c r a m e n t o - S a n Joaquin River estuary. Later during construction, environ- mental and financial concerns led to a change in the design o f the drain. The Kesterson Wildlife Refuge, located at the northern terminus of the San Luis Drain, was created as a combination of a waste water evaporation facility and water-bird habitat. The Kesteron reservoir has received drainage water since 1981. As oxygen-rich water flushed through the subsurface drainage system,
0169-7722/94/$07.00 © 1994 Elsevier Science B.V. All rights reserved. SSDI 0 169-7722(93)E0072-B
346
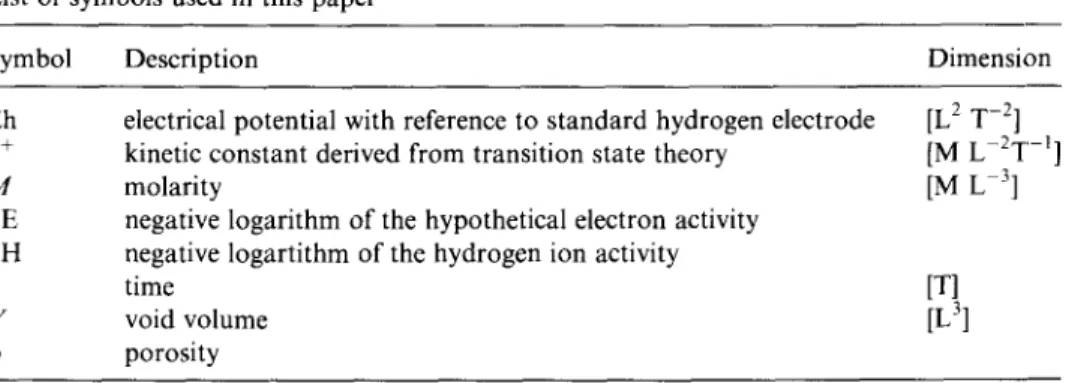
NOTATION
List of symbols used in this paper
C.W. L1U A N D T.N. N A R A S I M H A N
Symbol Description Dimension
Eh k + M pE pH t V
electrical potential with reference to standard hydrogen electrode kinetic constant derived from transition state theory
molarity
negative logarithm of the hypothetical electron activity negative logartithm of the hydrogen ion activity time void volume porosity [L 2 T -2] [M L-2T -1] [M L 3]
[T]
[L 3]
Suisun ~ ~ Legend Marsh e~~V/~
,~,©~. . . . . P r o p o s e d Extension to Delta c..,~ / . . o - " ~ Exsiting Drain San FranciSC~s~F.~ 0 P a c f i c~ ~
\.
Delta Ocean)
(
KestersonFig. 1. Location of Kesterson reservoir and San Luis Drain.
Stockton o 40 80 i i I / e g ~ Los Banos 4 N Mendota Fresno Five PoOh)
MODELING OF Se TRANSPORT AT THE KESTERSON RESERVOIR, CALIFORNIA 347 the immobile reduced selenium and other heavy metals of the Cretaceous sediments were oxidized, released to the drain water and discharged into the reservoir. By 1983, the Kesterson reservoir became a focus of public attention, when highly concentrated selenium-bearing reservoir water revealed its toxicity by causing harm to a significant percentage of aquatic birds and fish in the area. The goal of these investigations is to understand the hydro- logic, geochemical and ecological processes that are active at the Kesterson reservoir and to develop a rational method of long-term selenium abatement. Drawing upon field data collected by the Lawrence Berkeley Laboratory, the present work focuses on the modeling of selenium migration from the con- taminated pond water into the shallow groundwater aquifer.
The purpose of the simulation is to investigate the hypothesis that the movement of selenium may be controlled by inorganic redox reactions. A multiple-species, multi-dimensional reactive chemical transport model, DYNAMIX, is used to model this problem (Liu, 1988). The model includes advection, diffusion/dispersion, transport of oxygen, oxidation/reduction and, as a consequence, acid/base reactions, aqueous complexation, precipita- tion/dissolution and kinetic mineral dissolution.
2. DESCRIPTION OF KESTERSON RESERVOIR
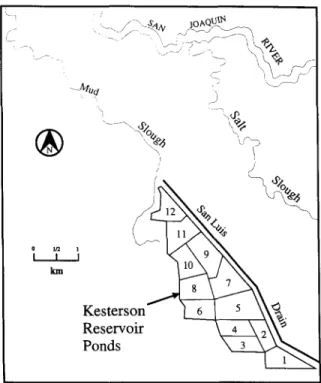
The reservoir at Kesterson (Fig. 2) consists of 12 ponds which cover an area of > 480 ha. The ponds are separated from one another by earth berms. The reservoir is bordered on the west by the Mud Slough, a freshwater channel that drains marshland and empties into the San Joaquin River. Salt Slough, which lies H1 km east of the reservoir, also empties into the San Joaquin River.
The northern ponds (9 to
12)
were historically dry through most of the year.The southern ponds (1 to 8) were dry in the summer and wet in the winter. Approximately 960 ha-m of drainage water were annually by discharged into the reservoir since 1981. Approximately half of the applied water percolates through the reservoir bottom sediments, and the other half evaporates and transpires to the atmosphere (USBR, 1986). As illustrated in Fig. 3 (LBL, 1987b), surface ponding created a groundwater mound that closely followed the contours of the flooded areas within the reservoir. Drainage water that seeped into the upper aquifer moved both laterally and vertically into the upper aquifer. Based on water-level data, the local groundwater is generally known to move in a northwesterly direction away from the San Luis Drain toward the Mud Slough. By 1983, the reservoir water contained on average 200-300 ppb of dissolved selenium which far exceeds the U.S. Environmental Protection Agency's (EPA) drinking water standard of 35 ppb for that element.
348 C . W L I U A N D T . N . N A R A S I M H A N .... ~, ~-~ "~vZ ' " ?'z I ---~luff . . . . , % , ) ) , / j Kesterson- "L 6 I 5 \ \ ~ Reservoir ~-~ ' 4 ~ , ~ onds
Fig. 2. Environs of Kesterson reservoir.
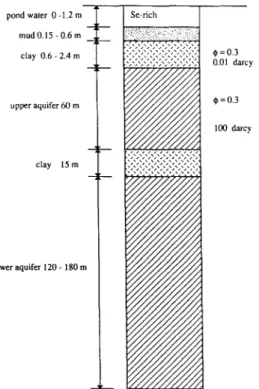
Fig. 4 illustrates schematically the shallow sedimentary succession at Kesteron. An organic-rich mud layer of 0.15-0.6-m thickness covers most of the pond bottoms. Beneath the mud layer is a 0.6-2.4-m-thick clayey layer. The shallow layer of clay has ~30% porosity and a permeability of
0.01 darcy (10 -14 m2). It extends laterally well beyond the reservoir. A 60-m-
thick upper aquifer underlies the layer which has the same porosity and a much higher permeability of nearly 100 darcy (LBL, 1986a). The 15-m-thick, nearly impermeable Corcoran clay layer separates the upper aquifer and the lower aquifer. The 120-180-m-thick lower aquifer is mainly used for human consumption whereas the upper aquifer serves local needs for irrigation and livestock. Water samples taken from the upper aquifer contain generally <5 ppb Se and are not contaminated by the selenium-rich pond water. How- ever, a careful examination of the chemical composition of groundwater samples from the upper aquifer shows that the major ions are similar to those of the pond water except for selenium (LBL, 1986a). This suggests that the reservoir water has indeed percolated down through the pond- bottom sediments into the upper groundwater aquifer but that the movement of selenium has been inhibited. Thus, field chemical data suggest that dissolved selenium in the percolated water is retained in the organic-rich pond-bottom layer, probably due to redox control. It was confirmed (LBL,
M O D E L I N G O F Se T R A N S P O R T AT T H E K E S T E R S O N R E S E R V O I R , C A L I F O R N I A pond water 0 -1.2 m mud0.15 - 0.6 m clay 0.6 - 2.4 m upper aquifer 60 m clay 15 m lower aquifer 120 - 180 m ¢,= 0.3 0.01 darcy 0 = 0 . 3 100 darcy
Fig. 3. Schematic illustration of sediment layering in the vicinity of Kesterson reservoir.
349
1986b) by later chemical analysis of core samples that most of the selenium was trapped and fixed in the organic-rich thin layer. The retardation mech- anism of selenium in the organic-rich layer is not yet clearly understood because the role of microbial mediation and the chemical processes con- trolling the redox potential remain uncertain.
3. S E L E N I U M C H E M I S T R Y
Selenium (in optimal quantities) is an essential element for the well-being of livestock. Deficiency of selenium results in selenium-responsive diseases in various animal species and in humans (Robberecht and Van Grieken, 1982). However, if the concentration of selenium exceeds the safe limits (EPA's drinking water limit is 35 ppb), it becomes toxic and can lead to infertility, cancer, birth defect or even fatality.
The chemical behavior of selenium is generally considered to be similar to that of sulfur because both belong to the same group in the periodic table. Selenium, like sulfur, is redox-sensitive and exists in several oxidation states, namely, - 2 , 0, +2 (not yet found in natural environment), +4 and +6. The chemical diversity of selenium's multiple oxidation states is a major factor affecting its behavior in the natural environment. In nature, selenium is
350 C.W. LIU AND T.N. NARAS1MHAN
• 63.8
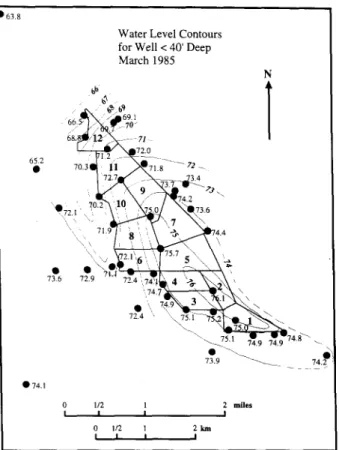
Water Level Contours for Well < 40' Deep March 1985 N b b l 68. " 7 1 , 72.~_ 6~2 ~ 7 1 . 8 - - - 7 2 _ - - _ _ 3.4 . ^ "N ; / ~]~174.Z 70.2"~'10 N/_._/ N . ~ 73Q6 "\ \ 71.9 4.4\\ "~ 'La • , 7 , 4 . 9 ~ - , ~ 7 4 . 1 0 1/2 1 2 mil~ l I I I 0 1/2 1 2 km l I I I
Fig. 4. Water-table elevation (measure in feet above the mean sea-level; 1 ft = 0.3048 m) around Kesterson reservoir during late winter 1985.
usually found with sulfide minerals in which selenium atoms replace sulfur atoms. A small fraction o f selenium substituting for sulfur in pyrite is a c o m m o n occurrence.
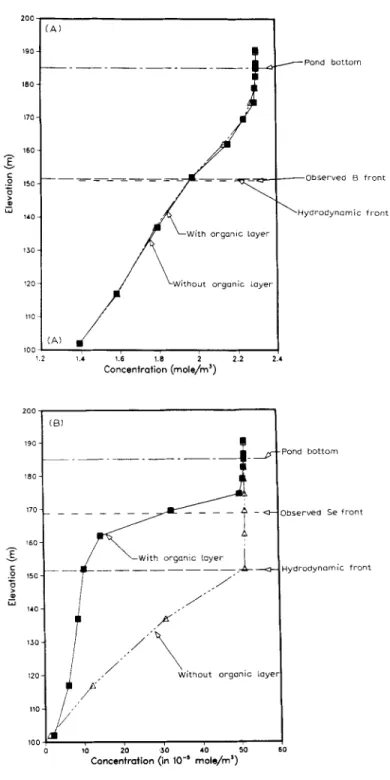
The most c o m m o n forms of selenium in the aqueous environment are the tetravalent selenite ion SeO 2-, the hexavalent selenate ion SeO 2-, insoluble elemental selenium Se °, and selenide Se 2 , which generally forms as hydrogen selenide which is a fairly strong acid and its fumes are very toxic. However, this c o m p o u n d is not stable in the natural environment and will decompose in air into elemental selenium and water. Because selenium is a redox species, it is best to illustrate its chemical behavior in terms o f the E h - p H predominance diagram (Garrels and Christ, 1965). For a system containing 10 -5 M Se, the E h - p H diagram of selenium, based on the reaction and oxidation potential- p H reaction as listed in Table 1, can be constructed and illustrated in Fig. 5. The boundary between the dissolved species represents an equilibrium between the species at equal concentration. The biselenite (HSeO 4-) and selenious acid (H2SeO3) are the dominate species under extreme oxidizing
MODELING OF S¢ TRANSPORT AT THE KESTERSON RESERVOIR, CALIFORNIA 351 T A B L E 1 O x i d a t i o n / r e d u c t i o n r e a c t i o n s o f s e l e n i u m a n d t h e i r E h - p H r e l a t i o n s u s e d in t h e c o n s t r u c t i o n o f t h e E h - p H d i a g r a m o f Fig. 5 C h e m i c a l r e a c t i o n E h - p H r e l a t i o n H 2 S e O 3 ~ H + + H S e O 3 H S e O 3 ~ - H + + S e O ~ - H S e O 4 ~ H + + S e O 2- H 2 S e O 3 + H 2 0 ~ - H S e O 4 + 3 H + + 2 e - H z S e O 3 + H 2 0 ~ S e O 2 - + 4 H + + 2 e - H S e O f + H 2 0 ~ - S e O 2- + 3 H + + 2 e - S e O 2 - + H 2 0 ~ S e O 2- + 2 H + + 2 e - Se ° + 3 H 2 0 , ~ H2SeO3 + 4 H + + 4 e - Se ° + 3 H 2 0 ~ H S e O 3 + 5 H + + 4 e - Se ° + 6 O H - ~ S e O ~ - + 3 H 2 0 + 4 e - p H -- 2.57 p H -- 6.60 p H --- 2.05 E h -- 1.091 - 0 . 0 9 p H E h = 1.151 - 0 . 1 2 p H E h -- 1.075 - 0 . 0 9 p H E h = 0.880 - 0 . 0 6 p H E h = 0.665 - 0 . 0 6 p H E h = 0.703 - 0 . 0 7 5 p H E h = 0.800 - 0 . 0 9 p H
t ...
.2seo3\ ...
0.8 " ' " ' - . . ~ . . 0.6 ,, HSeO~" ,,$ 0.4 0 . 2 s,o~- , S e ° o.o 2 " - . . . . O~ ° -0.2 "'" -0.4 ""-. : -0.61 I I I I I "',1 0 2 4 6 8 10 p H352 c . w LIU A N D T N . N A R A S I M H A N
and acidic conditions. The selenate species is stable at high oxidizing con- ditions. Under moderately oxidizing conditions, HSeO 2- is stable in acid water and SeO32- is stable in alkaline water. The stability region of elemental selenium covers the entire p H range under reducing conditions.
The reduction o f selenate (+6) to selenite (+4) or to elemental selenium (+0) is a much slower process than the reduction of selenite (+4) to elemental selenium. N o information on the reduction kinetics in the aqueous solution could be found in the literature for any o f these two reactions. However, there are indications that these are mediated by microbial activity (Cutter, 1982; Doran, 1982).
Most selenite salts are less soluble than the corresponding selenates (Se 6+) which minimize their hazard to the environment. Selenite complexes with many c o m m o n soil components such as ferric- and aluminium sesquioxides (Sarquis and Mickey, 1980) which may adsorb on the solid surfaces, whereas selenate does not form such complexes and is easily leached from the soil into groundwater.
4. THE SIMULATION PROBLEM
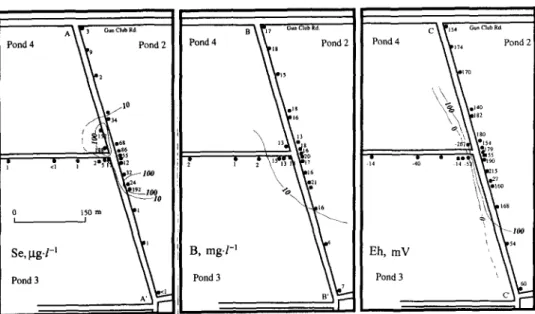
Field data used in this simulation are drawn from various progress reports o f the Kesterson Project of the Lawrence Berkeley Laboratory. To date, selenium concentrations in the groundwater in excess of 5 ppb have been found only beneath p o n d 2 at Kesterson. Historically, most of the drainage water entering the reservoir was first introduced into p o n d 2 and then dis- tributed to the other ponds through a series of connecting weirs. In p o n d 2, the organic and clay layer underling the p o n d water is relatively thinner than those of the other ponds. The average concentration o f boron in pore water is 20 ppm. The background concentration o f boron in groundwater is 2 ppm. The contaminated plumes of selenium, boron and the oxidation potential in the groundwater beneath p o n d 2 have been well defined through water samples from a nested series monitoring wells. The spatial distribution of wells between 4 and 13 m deep and the vertical distribution of wells less than 30 m deep along the levee road separating ponds 2, 3 and 4 are shown respectively in Figs. 6 and 7 (LBL, 1986a, b).
This distribution of wells permits a very detailed picture of the lateral and vertical chemical distribution in the area. Distributions of Se, B and Eh, the redox potential relative to the calomel electrode, are also illustrated in Figs. 6 and 7. The selenium plume arbitrarily defined as groundwater containing > 10 #g L -1 total Se is limited to a 180-m-wide zone at the west and south by large lateral decreases in selenium. Concentrations to the north are below the 10- #g-L i cut-off but are still elevated relative to the background. The selenium plume is undefined to the east, due to a lack o f existing wells. Sharp chemical
M O D E L I N G O F Se T R A N S P O R T A T T H E KESTERSON RESERVOIR, C A L I F O R N I A 353 A ~ i r ~ Gun Club R d Pond 4 ~ , Pond 2 l0 / / 34 \ 32 I ~ a2~. 19z 100 10
o
_ #o..
,,
,
Se, ~.g.l -I Pond 3 B 1 ~ 1 7 Gun Club Rd Pond 4 ~ s Pond 2'2
DII8 6 13 • ° ~}o B, mg.1-1 ~ ~ ~ Pond 3 C 15 4 Gun Club Rd ~ 7 4 Pond 2 tTo \ ~ m140 z0 2~ e154 Pond 4 Eh, mV Pond 3Fig. 6. Lateral distribution of selenium, boron and Eh in wells 6-12 m deep near the intersection of ponds 2, 3 and 4 in the southeastern portion of the Kesterson reservoir. Contours and approximate contours are presented by solidand dashedlines, respectively. Locations o f d - A ' , B B' and C-C' correspond to cross- sections shown in Fig. 7.
fronts, consisting o f decreases in B and Eh, also occur to the south and east (Fig. 7) corresponding to a decrease in Se concentrations. No discernible decrease in B and Eh occurs to the north between ponds 2 and 4.
The vertical distributions of Se, B and Eh shown in Fig. 7 correspond to a section along the N W - S E levee road. The major portion of the Se plume has migrated downward to a depth of ~16 m with a Se stringer of 18 #g L -1 at ~ 2 4 m. The vertical profile also indicates that the Se plume is tightly con- strained by much lower concentrations to the south. This conforms with significantly lower B and Eh in the region.
Boron concentrations in excess of 10 mg L -l, which are indicative of infiltrated p o n d water have penetrated to depths greater than 30 m. Clearly the vertical penetration o f selenium therefore does not correlate with the m a x i m u m depth to which p o n d water has moved. The depth of Se pene- tration does, however, correspond (except for the 18 #g L -1 sample) with the Eh front at which the overlying oxidizing water becomes reducing. The selenium distribution with depth indicates that the transport is controlled by a chemical retardation mechanism rather than by simple hydrologic transport as exhibited for B.
The vertical penetration depth of the selenium front compares closely with the front of oxidation potential. The consistent correlation between selenium and oxidation potential suggests that the transport of selenium may be con- trolled by the oxidation/reduction reactions. As p o n d water infiltrates to the
.... I Depth, m Depth, m Depth, m ~ ~ ^ I I 1. I I 1 I I I I
MODELING OF Se TRANSPORT AT THE KESTERSON RESERVOIR, CALIFORNIA 355
shallow groundwater aquifer, the dissolved selenium is gradually removed from the aqueous phase by some unknown chemical reactions of microbial reduction processes which cause the selenium front to lag significantly behind the hydrodynamic front.
Two potential chemical processes can be invoked for the removal of selenium in the bottom sediments: microbial uptake or inorganic chemical reduction. Laboratory data show (LBL, 1986a) that the rate of reduction of selenate to elemental selenium by H2S is much slower than the reduction of selenite to elemental selenium. In the field, selenium concentration is observed to rapidly reduce from several hundred ppb in the pond water to < 1 ppb in the mud layer. Therefore, the inference is that the reduction of selenate must be catalyzed by some bacterial process, which has greater preference to selenium than sulfur. Nevertheless, this type of bacteria has not yet been identified.
From the redox sequence point of view, the redox potential in pond water is controlled by oxygen and possibly, nitrate. As the water moves downward into groundwater, the redox potential gradually decreases until Fe 2÷ and Mn 2+ become the major redox species. By comparing with calculated Eh, based on the measured concentrations of the ferric/ferrous couple, and based on calculated Eh of the selenate/selenite couple, the ferric/ferrous couple is found to show a better agreement with the measured Eh than the selenate/selenite couple, indicating that the ferric/ferrous couple is under the equilibrium condition and the selenate/selenite couple is not. The speciation
calculation from
EQ3NR
(LBL, 1987a) o n aqueous selenium shows that thegroundwater is undersaturated for all the selenium minerals. The above observations complicate the interpretation of oxidation/reduction processes of selenium and render it difficult to exactly model the chemical interactions between the infiltrating pond water and groundwater. Although a Kd approach may give a good simulated result, it does not include the inter- actions between selenium and redox potential. As a first approximation, we therefore consider below the possible immobilization of selenium by redox reactions driven solely by inorganic processes and ignoring microbial effects. Accordingly, two cases of selenium transport at Kesterson have been modeled. These are:
Case 1: Interaction between pond water and groundwater without a reducing organic-rich layer.
Case 2: Interaction between pond water and groundwater with a reducing organic-rich layer.
Case 1 is designed to provide the estimated positions for the vertical infiltration of boron and selenium from the pond water directly to the ground- water subject to inorganic redox reaction within the aquifer over a period of
356 200 - C . W . L I U A N D T . N . N A R A S I M H A N 180- 160 - 140- 120- i- . 0 100- "6 [ ] 8 0 . 6 0 - 2 0 - 0
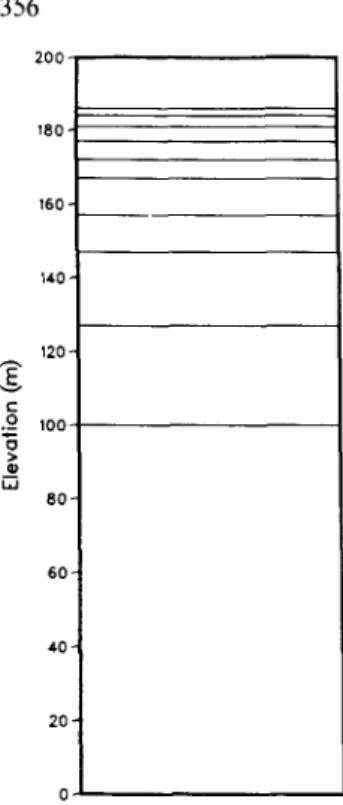
Fig. 8. Numerical mesh for the simulation of selenium migration in pond 2.
four years. The four-year period is based on that the selenium contamination at Kesterson was found four years after the reservoir started to receive drainage water. A 200-m-tall one-dimensional vertical column is considered. The column is divided into 10 elements, as shown in Fig. 8. The top element represents the contaminated pond water. The other nine elements represent the shallow groundwater aquifer. The vertical Darcy flux is assumed to be 2.5 m yr -1 from field tests. A porosity of 30% is assigned to the aquifer based on laboratory measurements (LBL, 1986a). The longitudinal dispersivity is assumed to be 0.1 m and the diffusion coefficient is assumed to be 1.6.10 -9 m 2 s -1 for all aqueous species. The concentration is converted from to SI unit. Using the relationship p E - - 0 . 0 1 6 9 E h (mV), the redox potential is also converted from Eh to pE unit. The initial concentrations of the pond water and the groundwater are shown in Table 2. The aqueous complexes derived from the aqueous components and their equilibrium constants are listed in Table 3. The mineral phases of interest and their solubility products in the simulation are given in Table 4. The simulation was run for four years and results were compared with data from the field measurements.
In case 2, the same conditions as in case 1 are considered, except that an additional assumption is made that an organic-rich layer, which acts as an oxygen sink, is present between the pond water and the aquifer. This layer can reduce and remove selenium from aqueous phase to solid phase through some
MODELING OF Se TRANSPORT AT THE KESTERSON RESERVOIR, CALIFORNIA 357 TABLE 2
Initial chemical concentrations of pond water and groundwater in simulation of selenium movement
Chemical species
Concentration ( m o l m -3)
pond water groundwater
Ca 14.98 9.98 Mg 14.40 14.40 Na 1740. 108.7 K 0.256 0.179 Fe 1-10 7 1,10-7 A1 0.0001 0.0 Mn 0.009 0.109 Sr 0.091 0.045 Si 0.033 0.233 C1 98.7 58.29 C 5.65 6.818 S 72.87 46.85 B 2.314 1.39 Se 0.000514 0.0000002 pH 8.5 6.8 pE 12.0 - 4 . 6
complex organic reactions. Since the reaction processes cannot be quantified, we simply assume that this layer acts as an equivalent oxygen sink. The biochemical oxygen demand (BOD) concept is used as an artifice to account for 46.5% by weight of oxygen removal from the aqueous phase within this layer in the simulation.
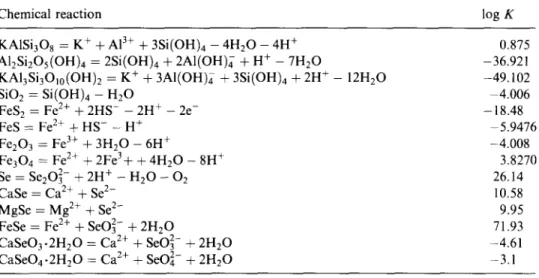
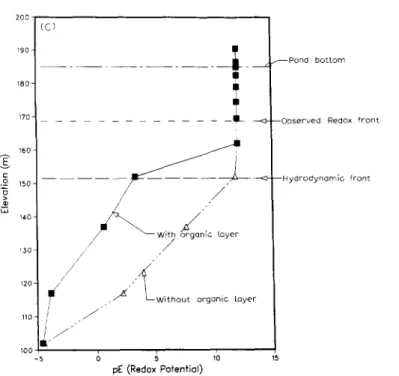
The results of simulation for boron, selenium and pE fronts after four years in cases 1 and 2 are shown in Fig. 9A, B and C, respectively. The non-reactive boron front behaves conservatively for both cases 1 and 2 as shown in Fig. 9A. The observed boron and hydrodynamic fronts were close which were 33 m below the reservoir pond bottom. This behavior of boron is consistent with both the hydrodynamic front and field measurements. In case 1, the fronts for selenium and redox are not retarded and they migrate 33 m deeper than those observed in the field (see Fig. 9B and C). The observed selenium and redox fronts were only 16 m below the pond bottom. In case 2, due to the BOD in the organic layer, selenium is reduced from aqueous selenite to elemental selenium (Se(s)) which significantly retards both selenium and the redox fronts. The simulated selenium and redox fronts in this case are close to field measure- ments. Although no information about the detailed reaction mechanism is given, the computational exercise suggests that the removal of oxygen from
358 c . w . L I U A N D T . N . N A R A S I M H A N T A B L E 3 I n t r a - a q u e o u s r e a c t i o n s a n d t h e i r e q u i l i b r i u m c o n s t a n t s ( K ) at 2 5 ° C in the s i m u l a t i o n o f s e l e n i u m t r a n s p o r t C h e m i c a l r e a c t i o n log K H 2 0 - H + = O H H + + CO~ = H C O 3 2 H + + C O ~ - = H 2 C O 3 H + + SO42- = H S O 4 SOn 2 + 8 H + + 8 e - - 4 H 2 0 = S ~ - S O l - + 9 H ÷ + 8 e - - 4 H 2 0 = H S SO42 + 1 0 H + ÷ d - - 4 H 2 0 = H 2 S C a 2+ + H 2 0 - H + = C a O H + C a 2+ ÷ C O ~ - = C a C O 3 C a 2+ + C O ~ - + H + = C a l i C O S - C a 2+ ÷ S O 2- = C a S O 4 M g 2+ + H 2 0 - H + = M g O H - M g 2+ + C O ~ - = M g C O 3 M g 2+ + C O ~ - + H + = M g H C O ~ - M g 2+ ÷ SO24 - = M g S O 4 N a + + CO32- = NaCO~- N a + + C O 3 + H + = N a H C O 3 N a + + SO42- = N a S O 4 K + + S O l - = K S O 4 F e 2+ + H 2 0 - H + = F e O H + F e 2+ + 2 H 2 0 - 2 H + = F e ( O H ) 2 F e 2+ + 3 H 2 0 - 3 H + = F e ( O H ) 3 F e 2+ + S O ] - = F e S O 4 F e 2+ + 2SO42- + 18H + + 16e- - 8 H 2 0 = F e ( H S ) 2 F e 2+ + 3 S O 2- + 2 7 H + + 2 4 e - - 1 2 H 2 0 = F e ( H S ) 3 F e 2+ - e - = Fe 3+ F e 2+ + H 2 0 - H + - e - = F e ( O H ) 2+ F e 2+ + 2 H 2 0 - 2 H + - e - = F e ( O H ) ~ F J + + 3 H 2 0 - 3 H + - e - = F e ( O H ) 3 F e 2+ + 4 H 2 0 - 4 H + - e - = F e ( O H ) 4 2 F e 2+ + 2 H 2 0 - 2 H + - 2 e - = F e 2 ( O H ) 4+ 3 F e 2+ + 4 H 2 0 - 4 H + - 3 e - = Fe3(OH)45+ F e 2+ + C1- - e - = FeCI~- Fe 2+ + 2C1- - e - = F e C I ~ F e ~+ + 3C1- - e - = FeC13 F e 2+ + S O ] - - e - = F e S O 2 F e z+ + 2 S O ] - - e - = F e ( S O 4 ) ; M n 2+ + H 2 0 - H + = M n O H + M n 2 + + C 1 = M n C 1 + M n 2+ + 2C1- = M n C I z M n 2+ + 3C1- = MnC13 M n 2+ + C O 2- + H + = M n H C O + 13.99 10.34 1 6 . 7 0 1.987 20.735 33.652 40.644 - 1 2 . 5 9 8 3.153 11.345 2.309 - 11.794 2.98 11.396 2.25 1.268 10.08 0.700 0.85 - 9 . 5 0 - 2 0 . 5 7 - 3 1 . 0 0 2.25 76.25 111.937 - 13.032 - 1 5 . 2 2 - 1 8 . 7 0 - 2 6 . 6 3 - 3 4 . 6 3 - 2 9 . 0 1 - 4 5 . 4 - 1 1 . 5 5 - 1 0 . 9 0 - 1 1 . 9 0 - 9 . 1 1 - 7 . 6 1 - 1 0 . 5 9 0.607 0.041 - 0 . 3 0 5 1 1 . 6 0
MODELING OF Se TRANSPORT AT THE KESTERSON RESERVOIR, CALIFORNIA T A B L E 3 C o n t i n u e d 359 C h e m i c a l r e a c t i o n l o g K M n 2+ + S O ] - = M n S O 4 M n 2 + - e - = M n ~ M n 2+ + 4 H 2 0 - 8 H + - 4 e - = MnO42- M n 2+ + 4 H 2 0 - 8 H + - 5 e - = M n O ] - A13+ + H z O - H + = A I ( O H ) 2+ AI 3+ + 2 H 2 0 - 2 H + = A I ( O H ) 2+ A13+ + 3 H 2 0 - 3 H + = A I ( O H ) 3 AI 3+ + 4 H 2 0 - 4 H + = A I ( O H ) 4 AI 3+ + SO42- = A I ( S O 4 ) + AI 3+ + 2SO42- = A1(SO4)2 Si(OH)4 - H + = H 3 S i O 4 Si(OH)4 - 2 H + = H 2 S i O ] - S r 2+ ÷ H 2 0 - H + = S r O H + S e O ~ - + H 2 0 - 2 H + + 2 e - = SeO42- SeO 2- + H 2 0 - H + + 2 e - = H S e O 4 SeO32 + H + = H S e O j S e O ~ - + 2 H + = H 2 S e O 3 SeO~- - 3 H 2 0 + 6 H + + 6e = Se 2- SeO32- - 3 H 2 0 + 7 H + + 6 e - = H S e - S e O ] - - 3 H 2 0 + 8 H + + 6 e - = H 2 S e SeO32- + H 2 0 - 2 H + - 2 e - + C a 2+ = C a S e O 4 SeO32- + C a 2+ = C a S e O 3 S e O ~ - + H 2 0 - 2 H + - 2 e - + M g 2+ = M g S e O 4 S e O ] - + M g 2+ = M g S e O 3 2.26 - 2 5 . 0 5 0 7 - 1 1 8 . 4 4 - 127.824 - 4 . 9 9 - 1 0 . 1 - 1 6 . 0 - 2 3 . 0 3.02 4.92 - 9 . 9 2 9 - 2 1 . 6 1 7 - 1 3 . 1 7 8 - 2 9 . 0 7 - 2 7 . 1 6 7.31 9.87 37.35 52.33 56.14 - 2 6 . 4 3.17 - 2 6 . 7 2 2.87
the organic-rich layer contributes one of the possible retardation mechanisms of selenium removal from the aqueous phase. The oxygen consumption model is reasonable if we choose to assume that bacterial mediation catalyzes the redox process by hastening the removal of oxygen.
5. R O L E O F K I N E T I C D I S S O L U T I O N O F M A G N E T I T E
In addition to the plume observations already discussed, three field redox tracer experiments, involving the injection of selenium into the groundwater aquifer, were conducted (LBL, 1987a) to evaluate the mobility of selenate and selenite in the shallow groundwater aquifer. These tests were conducted in the aquifer underneath pond 2 for both oxidized and reduced environments. It was reasonable to assume that the groundwater aquifer is free of the microbial activity and that the chemical interactions are inorganically controlled. Each test consisted of injecting 2 m 3 of a mixture of water with 1 ppm selenate, 1
360 c.w. LIU AND T.N, NARASIMHAN T A B L E 4
Mineral solubility reactions and their equilibrium constants (K) at 25°C in the simulation of selenium transport
Chemical reaction log K
K A 1 S i 3 0 8 = K + + A I 3+ + 3 S i ( O H ) 4 - 4 H 2 0 - 4 H + A 1 2 S i 2 O s ( O H ) 4 = 2 S i ( O H ) 4 + 2 A l ( O H ) 4 + H + - 7 H 2 0 K A 1 3 S i 3 O l o ( O H ) 2 = K + + 3 A I ( O H ) ~ + 3 S i ( O H ) 4 + 2 H ÷ - 1 2 H 2 0 SiO2 = S i ( O H ) 4 -- H 2 0 FeS2 = F e 2+ + 2 H S - - 2 H + - 2 e - F e S = F e 2+ + H S - - H + F e 2 0 3 = F e 3+ + 3 H 2 0 - 6 H + F e 3 0 4 = F e 2+ + 2 F e 3 + + 4 H 2 0 - 8 H + Se = S e 2 0 2 - + 2 H + - H 2 0 - 0 2 CaSe = C a 2+ + Se 2- M g S e = M g 2+ + Se 2- F e S e = F e 2+ + S e O 2- + 2 H 2 0 C a S e O 3 . 2 H 2 0 = C a 2+ + S e O 2- + 2 H z O C a S e O 4 . 2 H 2 0 = C a 2+ + S e O 2- + 2 H ~ O 0.875 - 3 6 . 9 2 1 -49.102 4 . 0 0 6 - 1 8 . 4 8 5.9476 - 4 . 0 0 8 3.8270 26.14 10.58 9.95 71.93 - 4 . 6 1 - 3 . 1
ppm selenite and 1 ppm fluorescein. The fluorescein served as an indicator of the degree of dilution of the injected solution in the aquifer. Approximately 1/8 of the tracer solution was withdrawn weekly from each well. Of the three tests, we discuss below results of two of the tests, tests 1 and 3.
Fig. 10 shows selenite and selenate concentrations as functions of time after the injection began. In redox test 1 which was conducted in an oxidizing environment, much of the selenite is oxidized to selenate in the first ten days. After 10 days, most of selenate is reduced back to selenite. The data suggest that selenite and selenate are very sensitive to the change of the redox potential and that inorganic oxidation/reduction of selenium can indeed occur. In redox test 3 which was conducted in a reducing environment, selenite is not stable and has been lost prior to inject into the well. Ten days after the injection, selenite concentration is reduced to 10 ppb. Selenate is stable in the initial injected fluid and gradually decreases in groundwater at a linear rate. Selenate concentration is found to have dropped below 10 ppb after 25 days' injection. Based on these data, it is suggested that selenium may be inorganically reduced in the groundwater environment at Kesterson without being catalyzed by the microbial activity.
From field observations and chemical speciation calculations, it appears that the redox potential in the groundwater may be controlled by the Fe2+/ Fe 3+ redox couple (LBL, 1987a). The dissolution of magnetite (Fe304) in the groundwater, which consumes oxygen and hence lowers the redox potential, is a possible reaction in this regard since the groundwater aquifer is known to
MODELING OF Se TRANSPORT AT THE KESTERSON RESERVOIR, CALIFORNIA 361 200 - (A) 190 - 180 - 170 - 160 - Ifio - 140 1.%0 - 120 110 ( A ) • t.2 o r g a n i c l o y e r o r g o n i c / o y e r 1.4 1.6 1.B 2 2.2 2.4 C o n c e n t r a t i o n ( m o l e / m 3) b o t t o m b s e r v e d B f r o n t ~ r o d v n o m l c f r o n t ( B ) - P o n d b o t t o m ~_ -- - - I - . ~ - W l t h o r g a n i c l a y e r L
f
/.,/'~
W i t h o u t o r g a n i c b s e r v e d Se f r o n t l y d r o d y n a m ic front 0 10 20 -30 40 50 C o n c e n t r a t i o n ( i n I0 -s r n o l e / m 3)362 C.W. LIU A N D T.N. N A R A S I M H A N ,'n 20C - (c) 190 180 - 170 " 160 ~50 - 1 4 0 - ! 3 0 - t20 - I ~ 110 - / ~Od - 5 I u / /
/
/
/
/
/ / •,/f
/"A~
, - ~ W i t h o u t o r g a n i c l a y e r J 6 ~ ,0 pE (Redox Potential) ~ P o n d b o t t o m - - O b s e r v e d Redox f r o n t - - H y d r o d y n a m i c f r o n tFig. 9. A. Simulated boron profile for case 1 (without an organic layer) and case 2 (with an organic layer) in the groundwater system at pond 2 after four years.
B. Simulated selenium profile for case 1 (without an organic layer) and case 2 (with an organic layer) in the groundwater system at pond 2 after four years.
C. Simulated pE profile for case 1 (without an organic layer) and case 2 (with an organic layer) in the groundwater system at pond 2 after four years.
consist o f 0.5 wt% magnetite (LBL, 1987a). The dissolution reaction of magnetite which consumes oxygen can be described as follows:
1
2Fe304(s) + ~O2(aq ) -~ 3Fe203(s) (1)
Therefore, in the conversion of 2 mol of magnetite to 3 mol of hematite (Fe203) , 0.5 mol of oxygen is consumed.
The kinetic rate dissolution of magnetite in the aqueous solution measured by A.F. White (pers. commun., 1987) suggested that it can be expressed in terms o f zero-order rate reaction as:
d (maSSmagnetite) + Amagnetite 1 0 - 1 1 Amagnetite
dt = kmagnetite V - - 2.54. V (2)
where Amagnetite is the surface area o f magnetite and V is the volume of the
aqueous solution in contact with magnetite. The unit of the rate constant, k +, is mol m -2 s 1, Eq. 2 was incorporated into DVNAMIX to examine h o w magnetite may affect the movement of selenium in the shallow groundwater aquifer at Kesterson. The same physical/chemical parameters and the
M O D E L I N G O F Se T R A N S P O R T A T T H E K E S T E R S O N RESERVOIR, C A L I F O R N I A 363 ~500
1000
~ o x
Test
500 "s.*" " " " 0 I 1 I ' I '1500
tO00 5 0 0 R e d o x T e s t 3 I 5 10 15 20 25 30 T i m e o f t e r i n j e c t i o n ( d o y ) Legend • se(+6)Fig. 10. Selenate and selenite concentrations function time in the redox tracer tests 1 and 3.
numerical grids as described previously were used. The kinetic dissolution of magnetite was applied only to the region from the p o n d b o t t o m to the hydro- dynamic front. N o kinetic dissolution of magnetite was allowed in the region beyond the hydrodynamic front. An average spherical grain radius ] 0 - 4 m was assumed for magnetite.
The simulations were carried out in the inorganic mode, with the incorpora- tion of an organic-rich p o n d - b o t t o m layer. By trial and error, after several simulations it was found that the rate equation derived from laboratory experiments was generally too fast to agree with the field data. In order to compensate for this, an assumption was made that only 2% surface area o f the magnetite was reacting with aqueous phase. Results of the simulation based on this assumption are illustrated in Fig. 11A and B. The boron front is not shown here, since it is a non-reactive species which exhibits the same distribu- tion as shown in Fig. 9A. Fig. 11A and B shows that due to the incorporation of the kinetic dissolution of magnetite, the computed selenium front and redox potential are more close to the field measurements than those show in Fig. 9B and C. These results suggest that the kinetic dissolution of magnetite may be an alternate mechanism in controlling the movement of selenium within the shallow groundwater aquifer at Kesterson.
364 200 - ~ 9 0 - 180 - 170 - 160 150 i7~ 140 - 130 - 120 - I)0 - (A) ~ W l t h magnetic dissolution 10 2'0 5'0 4'0 50 C o n c e n t r a t i o n (in 10 -s r n o l e / m 3) Pon0 b o t t o m O b s e r v e d S e f r o n t H y d r o d y n a m i c f r o n t C.W. L I U A N D T . N . N A R A S I M H A N 200 - t90 - 180 - 170 ~ 160 150 - 140 - 130 - 120- llO 100 - 5 (B)
Y
- - - 4 - ~]
~ - W i t h m a g n e t i t e dlssolutlon pE (Redox Potential) P o n d b o t t o m - - O b s e r v e d R e d o x f r o n t <]- - H y d r o d y n a m i c f r o n tFig. 11. A. Simulated selenium profile with magnetite dissolution in the groundwater system at pond 2 after four years.
MODELING OF Se TRANSPORT AT THE KESTERSON RESERVOIR, CALIFORNIA 365 6. SUMMARY
The m o v e m e n t o f selenium c o n t a m i n a t e d p o n d water into selenium-free g r o u n d w a t e r at Kesterson was modeled by OVNAMIX. Three cases were con- sidered on the retardation o f selenium. Case 1 assumed there is no oxygen- consuming organic layer in between p o n d water and g r o u n d w a t e r whereas case 2 assumed there is. Case 3 assumed, in addition to the oxygen-consuming organic layer, a kinetic dissolution reaction o f magnetite in the aquifer. F o r case 1, the c o m p u t e d selenium and redox fronts migrated 30 m deeper than the field m e a s u r e m e n t in the absence o f any retarding material. With the oxygen- consuming layer added in case 2, the c o m p u t e d selenium and redox fronts in case 2 are significantly retarded and agree with the field measurement. The added mechanism o f the magnetite dissolution in case 3 led to an even closer agreement between the field observations and c o m p u t e d results for the selenium front and the redox front. The results o f this initial modeling analysis suggest that the removal o f oxygen from oxygenated p o n d water by the organic-rich layer and the kinetic dissolution o f magnetite in the aquifer m a y constitute two possible factors which contribute to the retardation o f selenium at Kesterson. F u r t h e r research is needed to investi- gate the microbial effect on the m o v e m e n t o f selenium.
ACKNOWLEDGEMENTS
We are grateful to A.F. White for the use o f the Kesterson project data and the magnetite dissolution data, and for m a n y useful discussions during the course o f this research. We would also like to t h a n k S.M. Benson and S. Flexser for the analysis o f hydrological properties and soil composition at Kesterson. The Cray Research Institute provided valuable computing time on the C R A Y
XMP/14
machine at the U C Berkeley Computing Center. This support is gratefully acknowledged.REFERENCES
Cutter, G.A., 1982. Selenium in reducing water. Science, 217: 829-831.
Doran, J.W., 1982. Micro-organisms and biological cycling of selenium. In: K.D. Marshel (Editor), Advances in Microbial Ecology. Plenum, New York, N.Y., pp. 121 145. Garrels, R.M. and Christ, C.L., 1965. Solutions, Minerals, and Equilibria. Freeman & Cooper,
San Francisco, CA, 450 pp.
LBL (Lawrence Berkeley Laboratory), 1986a. Progress Report 2, Kesterson Project, December 1985 through June 1986. Earth Sci. Div., Lawrence Berkeley Lab., Berkeley, CA, LBL-1188,
166 pp.
LBL (Lawrence Berkeley Laboratory), 1986b. Progress Report 4, Kesterson Project, October 1986 through December 1986. Earth Sci. Div., Lawrence Berkeley Lab., Berkeley, CA, LBL-1250, 145 pp.
366 C W L I U A N D T . N . N A R A S I M H A N
LBL (Lawrence Berkeley Laboratory), 1987a. Progress Report 5, Kesterson Project, January 1987 through March 1987. Earth Sci. Div., Lawrence Berkeley Lab., Berkeley, CA, LBL-1291, 124 pp.
LBL (Lawrence Berkeley Laboratory), 1987b. Annual Report of Kesterson Project, October 1986 through September 1987. Earth Sci. Div., Lawrence Berkeley Lab., Berkeley, CA, LBL-24250, 174 pp.
Liu, C.W., 1988. Multiple-species chemical transport involving oxidation/reduction reaction in geological media. Ph.D Dissertation, University of California, Berkeley, CA, 257 pp. Robberecht, H. and Van Grieken, R., 1982. Selenium in environmental waters: Determination
speciation and concentration levels. Talanta, 29: 823-844.
Sarquis, M. and Mickey, C.D., 1980. Selenium, Part I: Its chemistry and occurence. J. Chem. Educ., 57:886 889.
USBR (U.S. Bureau of Reclamation), 1986. Preliminary final closure and post-closure main- tenance plan, Kesterson Program. U.S. Bur. Reclam., Mid-Pac. Reg., 85 pp.
![Fig. 5. Eh p H diagram of p r e d o m i n a n t selenium species in the aqueous environment for [Se] = 10 -5 M](https://thumb-ap.123doks.com/thumbv2/9libinfo/8851704.242504/7.714.98.625.173.385/fig-eh-diagram-selenium-species-aqueous-environment-se.webp)