Testing Method for the Mechanical Properties of
Foam Heat Insulation Construction Material
S. H. Tung 1, M. H. Shih 2, W. P. Sung3, J. G. Shyu4
1
Department of Civil and Environmental Engineering, National University of Kaohsiung, Taiwan
2
Department of Civil Engineering, National Chi Nan University, Puli, Nantou 545, Taiwan.
3
Integrated Research Center for Green Living Technologies, National Chin-Yi University of Technology, Taichung, Taiwan
4
Opima Corporation Ltd., Taiwan
(E-mail: [email protected]; Phone: 886-7-5919223 ; Fax : 886-7-5919376)
ABSTRACT
The DIC method is applied to measure the mechanical properties of the Phenolic resin foam material. Porosity foam material is a good heat insulation material. The Phenolic resin foam material has low flammability, low smoke and low toxicity. It has been extensively applied in many public safety related industries and products. But, the mechanical behavior of Phenolic resin foam material is brittleness, tensile strength is low and adhesion force is not good. Therefore, this material is used as bare filler or boarded as sandwich material for outer wall or roof of building. The mechanical properties of these kind materials should be known about under consideration for installing safety and economic effects. The bare material of Phenolic resin foam material is used to test the compressive strength and bending strength. The developed digital image correlation method is used to measure the strain field. The results show that the mechanical properties of Phenolic resin foam material can be successfully measured with the help of this method.
Key words: Phenolic resin foam material, digital image correlation, mechanical property.
1. INTRODUCTION
Porosity foam material is a good heat insulation material. It can be used as heat insulation material at outer wall and roof of building. Nevertheless, the components of this kind material cause the plastic to ignite easily thus increasing the flammability of other relevant products. Additionally, during the burning process, halogens are released to form dioxin and a large quantity of smoke. The Phenolic resin foam material has low flammability, low smoke and low toxicity. It has been extensively applied in many public safety related industries and products. Especially, application of the heat insulation, safety and environmental protection properties of Phenolic resin
foam material made as Green construction material. But, the mechanical behavior of Phenolic resin foam material is brittleness, tensile strength is low and adhesion force is not good. Therefore, this material is used as bare filler or boarded as sandwich material for outer wall or roof of building. The mechanical properties of these kind materials should be known about under consideration for installing safety and economic effects. The bare material of Phenolic resin foam material is used to test the compressive strength and bending strength. The traditional measurement techniques such as LVDT and strain gauge are not suitable for such material. The DIC method is a measurement technique without contact to the specimen and it can obtain the whole displacement and strain field. It has already been applied in many different problems. [1-4] Therefore the developed digital image correlation method is used to measure the strain filed to ensure the difference between this material and traditional construction materials.
2. DIGITAL IMAGE CORRELATION METHOD
Digital-image-correlation method is widely applied to the field of image identification technique. By comparing local correlation of two images, the relationship between undeformed and deformed images could be identified. Assuming undeformed sub-image is A and deformed sub-image is B, the correlation coefficient (equation 1) [5] is used to define the relationship between sub-image A and B.
2 2 ij ij ij ij g g COF g g (1)
Where, g and ij g~ij is grey scale of sub-image A on coordinate ( i , j ) and sub-image
B on coordinate (i , j ), respectively. And, coordinate (i , j ) of sub-image B corresponds to coordinate ( i , j ) of sub-image A. The maximum correlation coefficient is equal to 1. It means that the sub-image B is exactly the image of sub-image A after deformation. Therefore we are looking for the position which yields the maximum value of the correlation coefficient during the analysis.
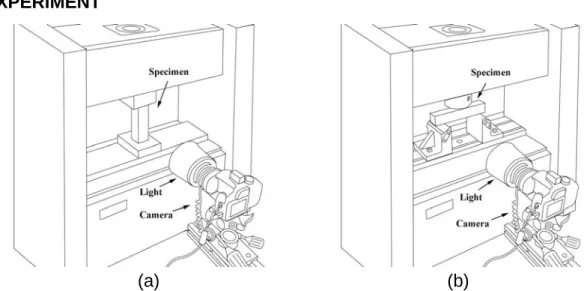
3. EXPERIMENT
(a) (b)
Two kinds of tests (compression and three point flexural tests) are carried out in this research to determine the mechanical properties of the Phenolic resin foam material. The density of this material is 55.34 kg/m3. The size of the specimen for compression test is 80.9533.433.6 mm3, for the three point flexural test is 203.033.233.7
mm3. The settings of these two tests are show in the figure 1. The support span in the three point flexural test is 127 mm. Instead of the traditional LVDT and strain gauge, the digital image correlation method is used to measure the deformation of the specimens Therefore the structural speckle [6] is established on the surface of the specimen with spray paint before the test. A universal test machine of Shimadzu with a load cell capacity of 500 N is used to apply the loading. The load rates for both of the test are 0.5 mm/min. The images of the specimen during the test are captured with the camera (Canon EOS 400D with Canon EF-S 60mm f2.8 Macro USM lens). These images can be analyzed with the help of developed DIC software. Then the deformation of the specimen can be determined.
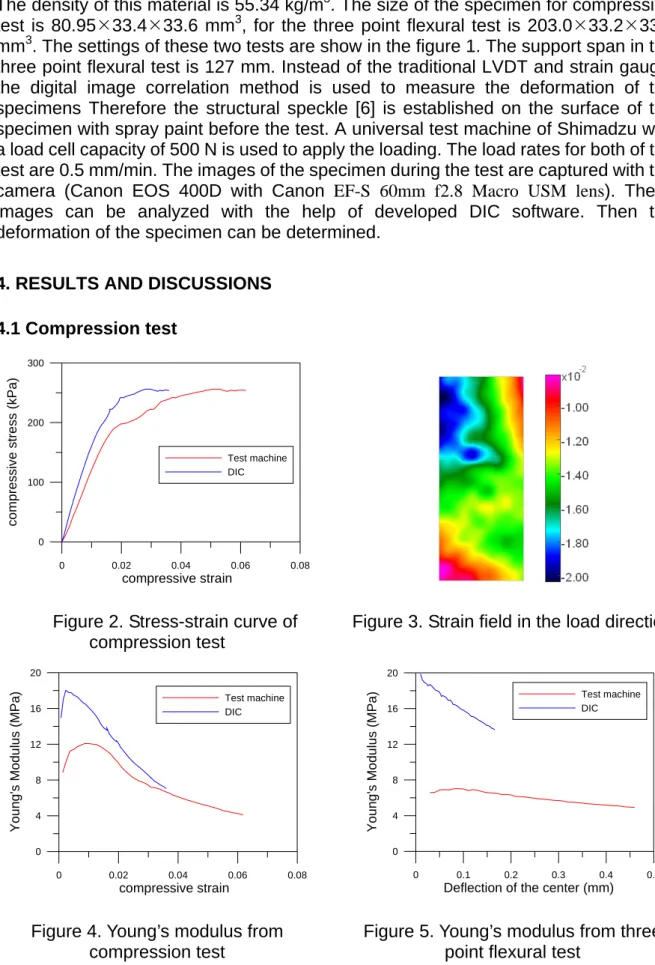
4. RESULTS AND DISCUSSIONS 4.1 Compression test 0 0.02 0.04 0.06 0.08 compressive strain 0 100 200 300 comp res si ve s tr es s ( k P a ) Test machine DIC Figure 2. Stress-strain curve of
compression test
Figure 3. Strain field in the load direction
0 0.02 0.04 0.06 0.08 compressive strain 0 4 8 12 16 20 Young's Mod u lu s (MPa) Test machine DIC
Figure 4. Young’s modulus from compression test
0 0.1 0.2 0.3 0.4 0.5
Deflection of the center (mm) 0 4 8 12 16 20 Young's Mod u lus (MPa) Test machine DIC
Figure 5. Young’s modulus from three point flexural test
The stress-strain curve measured from the test machine is shown as the red line in the figure 2. The compressive strength is about 256 kPa. Observing the strain field at the displacement 0.2 cm (as shown in figure 3), we can find that the strain distribution is very inhomogeneous. The average value of the strain field is different from that measured by the test machine. If we draw the curve of the strain measured by DIC versus the stress, then we obtain the blue line of figure 2. It shows that the slope of the blue line differs from the slope of the red line. This means that they have different Young’s moduli. The corresponding Young’s modulus is shown in figure 4. It shows that the Young’s moduli measured by test machine seems to be underestimated. 4.2 Three point flexural test
The bending strength of the specimen is ca. 283.2 kPa. Using the deflection measured by the test machine to evaluate the Young’s modulus of the specimen, we obtain the red line in figure 5. But we find that the all the three supporters penetrate slightly into the specimen during the test. This means that as the midpoint displaces, the whole specimen has also a displacement in the load direction. Therefore the deflection of the center of the specimen can not be correctly measured by the test machine. The DIC method can simultaneously measure the displacements of many points. Therefore we can measure the displacements of all three support points. Then the deflection of the center of the specimen can be calculated. The relationship between the Young’s modulus and the deflection of the center can be represented as the blue line in figure 5. We can find that the Young’s modulus evaluated with the deflection measured by test machine is significantly underestimated.
Comparing the Young’s modulus measured in the compression test and in the three point flexural test, we can find that the Young’s moduli measured by DIC in both tests are almost the same. It shows that the DIC method is suitable for the deformation measurement of the Phenolic resin foam material.
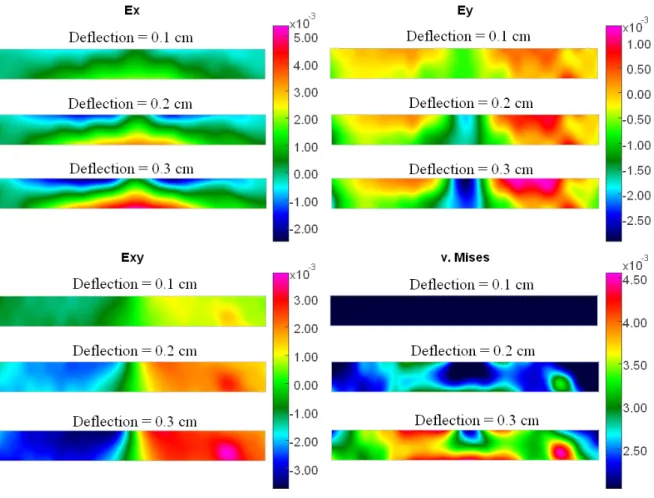
Figure 6 shows the strain fields of normal strain, shear strain and von Mises strain. We can find that the strain varies continuously as the deflection increases. But the strain distribution is not fully symmetric. It also shows that the material is not homogeneous.
5. CONCLUSIONS
The DIC method is applied to measure the deformation of the Phenolic resin foam material in this research. In comparison with the traditional measurement techniques, the DIC method is much more suitable for the deformation measurement of such material. It will not disturb the specimen. The inhomogeneous deformation can be successfully detected and the actual deflection of the center of the specimen can be determined.
ACKNOWLEDGEMENT
The National Science Council of Taiwan supported this research through grant No. NSC 97-3114-E-167-001 and NSC 97-2625-M-390-001. These supports are gratefully acknowledged.
Figure 6. Strain fields of the specimen at various deflections.. REFERENCES
[1] Raffard, D., Ienny, P. and Henry, J.-P. (2001) Displacement and Strain Fields at a Stone/Mortar Interface by Digital Image Processing. In Journal of Testing
and Evaluation, Vol. 29 (2), pp. 115-122.
[2] Tung, S.H., Shih, M.H. and Sung, W.P. (2008) Development of Digital Image Correlation Method to Analyze Crack Variations of Masonry Wall. In Sadhana -
Academy Proceedings in Engineering Science, Vol. 33, Part 6, pp. 767-779.
[3] Kuo, J.C., Zaefferer, S., Zhao, Z., Winning, M. and Raabe, D. (2003) Deformation Behavior of Aluminum Bicrystals. In Advanced Engineering
Materials, Vol. 5, pp. 563-566.
[4] Kuo, J.C., Chen, D., Tung, S.H. and Shih, M.H. (2007) Misorientation behavior of an aluminum bicrystal with 15.7o symmetric tilt boundary using simple shear. In Journal of Materials Science, Vol. 42, pp. 7673-7677.
[5] Chu, T.C., Ranson, W.F., Sutton, M.A. and Peters, W.H. (1985) Application of Digital-Image-Correlation Techniques to Experimental Mechanics. In
Experimental Mechanics, Vol. 25(3), pp. 232-244.
[6] Tung, S.H., Kuo, J.C. and Shih, M.H. (2005) Strain Distribution Analysis Using Digital-Image- Correlation Techniques. 18th KKCNN Symposium on Civil Engineering, pp. 213-218, Kaohsiung, Taiwan