Clinical evaluation of the eBsensor hand-held
blood glucose monitoring system
Chien-Chih Chen
a,b, Der-Yan Tai
a, Ping Ho
a, Yiu-Kay Lai
b, Jui-Jane Lin
a, Simon J.T. Mao
c,
Chia-Chi Lin
d, Yu-Chen Hsieh
d, Hsiang-Cheng Chiang
d, Ken-Shwo Dai
c,d,⁎
aWei-Gong Memorial Hospital, Miaoli, Taiwan
bThe Institude of Biotechnology, College of Life Science, National Tsing Hua University, Hsinchu, Taiwan cDepartment of Biological Science and Technology, National Chiao Tung University, Hsinchu, Taiwan
dVisgeneer Inc., Hsinchu, Taiwan
Received 11 September 2006; received in revised form 20 September 2006; accepted 21 September 2006 Available online 3 October 2006
Abstract
Background: Home glucose monitoring system is increasingly recognized as an important tool for glycemic control. We evaluated the clinical
performance of the eBsensor glucose monitoring system.
Methods: Fingertip capillary blood glucose concentrations from 282 subjects were measured using eBsensor glucose monitoring system and
compared against predicate devices and the Yellow Springs Instruments (YSI) 2300 blood glucose analyzer. Accuracy and precision of the
eBsensor glucose monitoring system were assessed using several methods. The comparative study between the eBsensor and 2 currently marketed
monitoring systems was performed.
Results: The 282 eBsensor readings covered a wide range from 2.6 to 24.4 mmol/l. Deming regression and Pearson correlation analyses showed a
linear relationship between the eBsensor readings and the YSI reference method (eBsensor = 0.9496 YSI + 0.4127 mmol/l; r = 0.98). Error Grid
analysis demonstrated that 100% of the eBsensor readings in clinically acceptable zones A and B. The CVs for the 6 lots of strips were within the
satisfactory interval (b6%). The comparative study showed that the eBsensor readings correlated well with the OneTouch Ultra values (r=0.97)
and the Glucocard II values (r = 0.97).
Conclusions: eBsensor is a reliable glucose monitoring system which provides high accurate and precise glucose readings over a wide range of
glucose concentrations.
© 2006 Elsevier B.V. All rights reserved.
Keywords: Diabetes; Glucose monitoring system; Clarke Error Grid analysis; Glucose meter; Strip; Self-monitoring; Accuracy; Precision; Electrochemical
1. Introduction
Diabetes is a chronic disease associated with serious health
complications including visual disability, kidney failure,
neurop-athy, and heart disease. The global number of people with diabetes
was estimated to be 171 million in 2000 and 366 million in 2030
[1]
. The total number of diabetes-associated deaths was estimated
to be 2.9 million worldwide in 2000
[2]
. Diabetes was ranked as
the 6th leading cause of death in the U.S. in 2003
[3]
. Previous
studies have shown that maintaining a normal or near-normal
glucose level significantly prevents or delays some health
complications for people with diabetes
[4–7]
. The development
of blood glucose monitoring system permitted diabetic patients to
monitor their glucose levels at home. This system was
consequently recommended as an important component of
routine care for diabetic patients to control their blood glucose
levels
[8
–10]
.
There are many types of blood glucose monitoring systems
currently available on the market. The clinical performance of
many of these glucose monitoring systems has been reported
[11–16]
. Recently, eBsensor, a new 10-second hand-held blood
glucose monitoring system (Visgeneer Inc., Hsinchu, Taiwan),
Clinica Chimica Acta 377 (2007) 170–173
www.elsevier.com/locate/clinchim
⁎ Corresponding author. Visgeneer Inc., 3F.-2, No.83, Sec. 1, Gongdao 5th Rd., Hsinchu City 300, Taiwan. Tel.: +886 3 516 0111x1000; fax: +886 3 516 0161.
E-mail address:president@visgeneer.com.tw(K.-S. Dai).
0009-8981/$ - see front matter © 2006 Elsevier B.V. All rights reserved. doi:10.1016/j.cca.2006.09.023
has been introduced into the market. The objective of the
present study was designed to evaluate the clinical performance
of the eBsensor glucose monitoring system.
2. Materials and methods
2.1. Subjects and blood glucose measurements
This study comprised 282 patients with diabetes, who were all in the morning fasting state, attending the outpatient clinic of Wei-Gong Memorial Hospital (Miaoli, Taiwan). Of these participants, fingertip capillary blood glucose concentrations were obtained using eBsensor blood glucose monitoring system and 2 currently marketed monitoring systems, the Glucocard II (Arkray) and the OneTouch Ultra (LifeScan). All measurements were performed in the Department of Laboratory Medicine of Wei-Gong Memorial Hospital by the same trained technician according to the manufacturer's instructions to avoid errors made by patients. Immediately after fingerstick measurement, venous blood sample from each of the diabetic patients was drawn by a nurse. Plasma glucose concentrations of these samples determined by the Yellow Springs Instruments (YSI) 2300 blood glucose analyzer were served as the reference values. The hematocrits of the participants ranged from 30–55% were within the operative specification of the eBsensor. To evaluate the precision of the eBsensor glucose monitoring system, 6ty measurements at each of the 6 clinically relevant blood glucose ranges (2.8–3.1, 4.9–5.3, 7.8–8.7, 13.2–14.2, 18.8–19.9, and 24.3–25.4 mmol/l) were performed for the 6 lots of test strips using 6 eBsensor meters. To produce the 6 different glucose concentrations for
each lot of strips, venous whole blood samples from healthy volunteers were spiked before analysis. Analyses for this part of the study were performed over 2 weeks. All study protocols were reviewed and approved by the ethical committee of Wei-Gong Memorial Hospital.
2.2. Data analysis
The clinical accuracy of eBsensor was assessed by comparing the eBsensor readings with the YSI reference values using Pearson correlation analysis, Deming regression analysis, Clarke Error Grid analysis [17,18], and the percentage of readings within a defined range of deviation from the reference values. Using Pearson correlation and Deming regression analysis, the eBsensor readings versus reference values and 2 currently marketed monitoring systems (comparative study) were performed. For Clarke Error Grid analysis, the x-axis and the y-axis were defined as the YSI reference values and the eBsensor readings, respectively. The resulting graphic display of the Clarke Error Grid analysis was divided into five zones: 1) zone A: clinically accurate; 2) zone B: error greater than ± 20% but would lead to benign or no treatment; 3) zone C: overcorrection of the true glucose value; 4) zone D: dangerous failure to detect and treat; 5) zone E: erroneous treatment. The percentage of readings within a defined deviation range (b5%, 5–10%, 10–15%, 15–20%, and N20%) of the reference values was analyzed for each of the glucose range (≤5.5 mmol/l, 5.6– 11.1 mmol/l, and≥11.2 mmol/l). Precision of the eBsensor glucose monitoring system was assessed using coefficients of variation (CVs) calculated from the 60 measurements at each of the 6 different glucose concentrations.
3. Results
The present study included 282 patients, among whom 119
(42.2%) were females and 163 (57.8%) were males. The age of
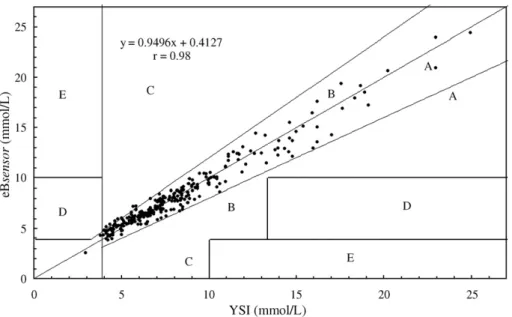
Fig. 1. Error Grid analysis of the eBsensor monitoring system. eBsensor readings were plotted against the YSI reference method.
Table 1
Number and percentage of eBsensor readings within a defined interval according to the different glucose concentration ranges
Percentage deviation from the reference value
Glycemic ranges b5% 5–10% 10–15% 15–20% N20% Total ≤5.5 mmol/L 20 (36.3%) 14 (25.5%) 15 (27.3%) 3 (5.5%) 3 (5.5%) 55 5.6–11.1 mmol/L 92 (50.5%) 49 (26.9%) 23 (12.6%) 14 (7.7%) 4 (2.2%) 182 ≥11.2 mmol/L 17 (37.8%) 16 (35.6%) 8 (17.8%) 4 (8.9%) 0 (0.0%) 45 Total 129 79 46 21 7 282 Data are number or (%).
Table 2
The CVs (%) for measurements in series for six different glucose concentration ranges (mmol/L) Lots of strips 2.8–3.1 4.9–5.3 7.8–8.7 13.2–14.2 18.8–19.9 24.3–25.4 Lot 1 4.32 3.81 4.25 3.52 3.4 3.44 Lot 2 5.56 4.89 3.35 3.34 3.83 3.93 Lot 3 4.74 4.4 4.32 3.51 2.62 3.14 Lot 4 5.24 4.0 3.86 3.42 3.43 4.6 Lot 5 5.84 5.11 4.86 5.92 4.47 5.26 Lot 6 4.17 5.43 5.02 4.37 3.77 3.12 171 C.-C. Chen et al. / Clinica Chimica Acta 377 (2007) 170–173
the participants was from 18 to 87 y. The hematocrits of these
participants were within the operative specification (30–55%) of
the eBsensor. The 282 eBsensor readings covered a wide range
of glucose concentrations from 2.6 to 24.4 mmol/l (55 readings
(19.5%)
≤5.5 mmol/l, 182 readings (64.5%) 5.6–11.1 mmol/l,
34 readings (12.1%) 11.2–16.6 mmol/l, 9 readings (3.2%) 16.7–
22.2 mmol/l, and 2 readings (0.7%) 22.3–27.8 mmol/l). Over the
range of glucose readings, Pearson correlation and Deming
regression analyses showed that eBsensor correlated well with
the YSI values with the equation of eBsensor = 0.9496 YSI
+ 0.4127 mmol/l and the 95% confidence intervals (CI) for the
slope and intercept were 0.9262 to 0.9731 and 0.2015 mmol/l to
0.6239 mmol/l, respectively. Pearson correlation analysis
showed that the correlation coefficient (r) was 0.98. Error Grid
analysis showed that 275 readings (97.5%) fell within zone A
and 7 readings (2.5%) fell within zone B (
Fig. 1
). All readings
falling on zone B were near the A/B border. There were no
readings in the C, D, or E zones.
Of the eBsensor readings, 97.5%, 90.1%, 73.8% and 45.7%
were within ± 20%, ± 15%, ± 10%, and ± 5%, respectively, of the
reference values. The total readings were divided into three
glucose ranges (≤ 5.5 mmol/l, 5.6–11.1 mmol/l, and
≥11.2 mmol/l) for further analysis (
Table 1
). In each of the
glucose ranges, the percentage of readings deviating from the
reference values within the 10% interval was found to be 61.8%
(
≤ 5.5 mmol/l), 77.4% (5.6–11.1 mmol/l), and 73.4%
(
≥11.2 mmol/l). The precision of the eBsensor glucose
monitoring system is shown in
Table 2
. Of the 6 test glucose
ranges (2.8–3.1 mmol/l, 4.9–5.3 mmol/l, 7.8–8.7 mmol/l,
13.2–14.2 mmol/l, 18.8–19.9 mmol/l, and 24.3–25.4 mmol/l),
CVs for lot 1 to lot 6 were ranged from 3.4% to 4.32%, from
3.34% to 5.56%, from 2.62% to 4.74%, from 3.42% to 5.24%,
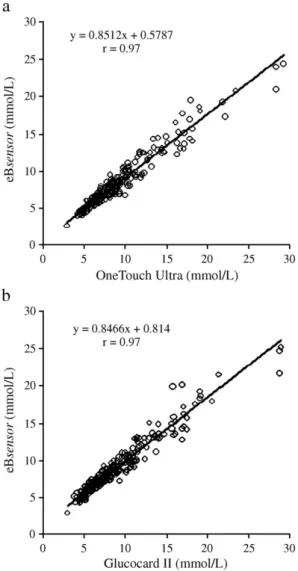
from 4.47% to 5.92%, and from 3.12% to 5.43%. As compared
to the currently marketed glucose monitoring systems, eBsensor
correlated well with the OneTouch Ultra values
(eBsen-sor = 0.8512 OneTouch Ultra + 0.5787 mmol/l, and r = 0.97;
Fig. 2
a) and with the Glucocard II values (eBsensor = 0.8466
Glucocard II + 0.814 mmol/l, and r = 0.97;
Fig. 2
b).
4. Discussion
eBsensor, a hand-held glucose monitoring system, was
recently introduced into the self-monitoring diagnostic market.
Using electrochemical detection technique, eBsensor was
designed for rapid determination (10 s) of glucose concentrations
over a wide range of glucose values (1.7 to 33.3 mmol/l) from a
small amount (approximately 2.5
μl) of capillary whole blood
sample. In order to determine if the eBsensor is an acceptable
device for measuring blood glucose concentrations, the present
study was aimed to evaluate the clinical performance of the
eBsensor. The 282 eBsensor readings covered a wide range of
glucose concentrations (2.6 to 24.4 mmol/l) suggesting that this
study population was sufficient to represent a larger population of
diabetic patients. Pearson correlation and Deming regression
analyses showed that the eBsensor readings correlated excellently
with the YSI reference values over the range of glucose
concentrations measured. The Error Grid analysis showed that
eBsensor glucose monitoring system had 100% of measurements
in zones A and B suggesting that eBsensor is a clinically
acceptable device for measuring blood glucose concentrations.
The percentage of deviation from the reference value is
another relevant approach to determine the accuracy of the
glucose monitoring system. It was recommended by the
International Organization for Standardization (ISO) that 95%
of the measurements should be within ± 20% of the reference
values for glucose concentrations higher than 4.2 mmol/l and
within ± 0.83 mmol/l for glucose values under 4.2 mmol/l
[19]
.
Our results showed that 97.5% of the eBsensor readings were
within ± 20% interval indicating that eBsensor met the accuracy
criteria proposed by ISO. According to the recommendation of
the American Diabetes Association (ADA), the acceptable
range of deviation from laboratory reference values was limited
within ± 5%
[20]
. Although the clinical performance of the
glucose monitoring systems has been reported regularly
[11–
16]
, none of the glucose monitoring systems was shown to be
satisfied based on the ADA stringent criterion
[21–23]
. Another
analysis approach has been proposed to group the glucose
monitoring systems into good, acceptable, and unacceptable for
Fig. 2. Linear regression analysis of the eBsensor readings against the currently marketed monitoring systems. (a) OneTouch Ultra and (b) the Glucocard II.
clinical use
[24]
. The
“good” meters were defined as N60% of
the readings within ± 10% of the reference value. Thus,
eBsensor should be classified as a
“good” meter based on the
result that eBsensor not only had 73.8% of the overall readings
but also had 61.8%, 77.4%, and 73.4% of the readings in three
different glycemic ranges within ± 10% interval.
The CVs of the eBsensor at the 6 different glucose levels
were within the satisfactory interval (b6%) suggesting that
eBsensor monitoring system provided precise measurements.
Furthermore, 2 currently marketed glucose monitoring systems,
OneTouch Ultra and Glucocard II, were selected for
compar-ison. Correlation and regression analyses showed that the
eBsensor readings correlated well with the OneTouch Ultra and
the Glucocard II values over the range of glucose concentrations
measured. In conclusion, the present study demonstrates that
eBsensor is a reliable glucose monitoring system providing
high accurate and precise glucose readings and can be rated as
“good meter”.
Acknowledgements
We thank our patients for participating in this study. We also
like to thank Wei-Gong Memorial Hospital, National Tsing Hua
University, National Chiao Tung University, and Visgeneer Inc.,
who supported the present study.
References
[1] Wild S, Roglic G, Green A, Sicree R, King H. Global prevalence of diabetes: estimates for the year 2000 and projections for 2030. Diabetes Care 2004;27:1047–53.
[2] Roglic G, Unwin N, Bennett PH, et al. The burden of mortality attributable to diabetes: realistic estimates for the year 2000. Diabetes Care 2005;28:2130–5.
[3] Hoyert DL, Heron MP, Murphy SL, Kung HC. Deaths: final data for 2003. Natl Vital Stat Rep 2006;54:1–120.
[4] DCCT Research Group. The effect of intensive treatment of diabetes on the development and progression of long-term complications in insulin-dependent diabetes mellitus. N Engl J Med 1993;329:977–86.
[5] UK Prospective Diabetes Study (UKPDS) Group. Intensive blood-glucose control with sulphonylureas or insulin compared with conventional treatment and risk of complications in patients with type 2 diabetes (UKPDS 33). Lancet 1998;352:837–53.
[6] American Diabetes Association:Standards of medical care in diabetes (Position Statement). Diabetes Care 2004;27(Suppl 1):S15–35. [7] World Health Organization. The Global Strategy on Diet, Physical Activity
and Health:Fact Sheet– Diabetes; 2003.
[8] Sonksen PH, Judd SL, Lowy C. Home monitoring of blood-glucose. Method for improving diabetic control. Lancet 1978;1:729–32. [9] Ikeda Y, Tsuruoka A. Self-monitoring of blood glucose, as a means of
self-management. Diabetes Res Clin Pract 1994:S269–71 [Suppl].
[10] Franciosi M, Pellegrini F, De Berardis G, et al. The impact of blood glucose self-monitoring on metabolic control and quality of life in type 2 diabetic patients: an urgent need for better educational strategies. Diabetes Care 2001;24:1870–7.
[11] Tate PF, Clements CA, Walters JE. Accuracy of home blood glucose monitors. Diabetes Care 1992;15:536–8.
[12] Trajanoski Z, Brunner GA, Gfrerer RJ, Wach P, Pieber TR. Accuracy of home blood glucose meters during hypoglycemia. Diabetes Care 1996;19:1412–5.
[13] Rheney CC, Kirk JK. Performance of three blood glucose meters. Ann Pharmacother 2000;34:317–21.
[14] Alto WA, Meyer D, Schneid J, Bryson P, Kindig J. Assuring the accuracy of home glucose monitoring. J Am Board Fam Pract 2002;15:1–6. [15] Dai KS, Tai DY, Ho P, et al. Accuracy of the EasyTouch blood glucose
self-monitoring system: a study of 516 cases. Clin Chim Acta 2004;349:135–41.
[16] Cohen M, Boyle E, Delaney C, Shaw J. A comparison of blood glucose meters in Australia. Diabetes Res Clin Pract 2006;71(2):113–8. [17] Cox DJ, Clarke WL, Gonder-Frederick L, et al. Accuracy of perceiving
blood glucose in IDDM. Diabetes Care 1985;8:529–36.
[18] Clarke WL, Cox D, Gonder-Frederick LA, Carter W, Pohl SL. Evaluating clinical accuracy of systems for self-monitoring of blood glucose. Diabetes Care 1987;10:622–8.
[19] ISO/CD 15197: Determination of Performance Criteria for In Vitro Blood Glucose Monitoring Systems for Management of Human Diabetes Mellitus. Geneva: ISO Central Secretariat; 2001.
[20] American Diabetes Association. Self-monitoring of blood glucose (consensus statement). Diabetes Care 1996;19(Suppl 1):S62–6. [21] Brunner GA, Ellmerer M, Sendlhofer G, et al. Validation of home blood
glucose meters with respect to clinical and analytical approaches. Diabetes Care 1998;21:585–90.
[22] Weitgasser R, Gappmayer B, Pichler M. Newer portable glucose meters-analytical improvement compared with previous generation devices? Clin Chem 1999;45:1821–5.
[23] Sacks DB, Bruns DE, Goldstein DE, Maclaren NK, McDonald JM, Parrott M. Guidelines and recommendations for laboratory analysis in the diagnosis and management of diabetes mellitus. Clin Chem 2002;48:436–72. [24] Poirier JY, Le Prieur N, Campion L, Guilhem I, Allannic H, Maugendre D.
Clinical and statistical evaluation of self-monitoring blood glucose meters. Diabetes Care 1998;21:1919–24.
173 C.-C. Chen et al. / Clinica Chimica Acta 377 (2007) 170–173