The chromaticity coordinates and color spectrum calibration using
tri-stimulus sensors and double light sources
Yao-Fang Hsieh*a, Ting-Wei Huanga, Mang Ou-Yangb,and Yi-Ting Kuobc
aDep. of Optics and Photonics, National Central Univ., Jhongli City, Taoyuan County , Taiwan bDepartment of Electrical Engineering, National Chiao-Tung Univ., Hsihchu city, Taiwan
cJen-Teh Junior College of Medicine, Nursing and Management, Miaoli County, Taiwan
ABSTRACT
Generally, the instrument of color measurement can be divided into spectrophotometer and color meter. The former instrument use prism or grating to separate the light, it can achieve high accuracy but a higher price. The latter instrument use color filter, however there is no spectrum information with it. This article establishes a color measuring system and uses eigen-spectrum method in double light sources to calibrate the spectrum. The measuring system includes tri-stimulus sensors which were made by color filter. The tungsten lamp and Xenon lamp are used to be light source. The advantage of this measuring system is the higher accuracy and the lower cost. The eigen-spectrum method can calibrate the spectrum in less eigenvector. This method used singular value deposition to obtain basis function of spectrum set, which can be obtained by measuring. Because the range of the spectrum set was 380nm to 780nm, the eigenvector per nanometer from 380nm to 780nm can be obtained. In general, the color spectrum can be obtained with less eigenvector. The color difference in L*a*b* color space from 31.2398 down to 2.48841, and reconstructs the spectrum information.
Keywords: spectrum, eigenspectrum method, double light sources
1. INTRODUCTION
The color is a science, how to make good use of the color character, how to correctly judgment color and define becomes the most important issue. This paper will introduce how to distinguish the color and the method of color measurement. Speaking of the human, the vision brings the impression, far compared to the sense of hearing and the sense of taste. The product purchase desire also will rely on the feeling of color and distinguish food cleanly the quality or not. But solely will rely on the subjective impression easy to create the mistake and the error. The external environment light source will be different, the angle, the position not same level will have the possibility to create the differences. If the color can be qualified and quantified, then may reduce the subjective consciousness, and avoids having the identical object color actually to have the infinite many kinds of possible adjectives. Furthermore, the color measuring instrument also by the widespread application in the display industry [1-3], the display industry raise in recent years a wave revolution unrest, however this unrest also caused between the country and the country executes the test of strength mutual competition respectively. However how to construct a set to conform to color of appraisal standard for all display actually not to achieve the comprehensive mutual recognition, and used to appraise this standard essential to admire a set of accurate color gauging system as well as the gauging standard. The color measuring instrument may also the suitable application situation in the appraisal environment light, spread out the color, promotes effect of the photo source, and lifting efficiency. However says by the present environment, color measuring instrument's use underused, its reason because often the price has not been able to cause the populace to accept causes, therefore how by a low end installment cell design set of standard color gauging system, and enables it to obtain the universal application, promotes its value added that for this reason research main purpose[4-7].
2. METHODOLOGY
2.1 The effect of spectrum and color signal
We use three color sensors, we can from color measurement to obtain three output, as (1) show,
780 1 1 380 780 2 2 380 780 3 3 380
( ) ( ) ( ) ( )
( ) ( ) ( ) ( )
( ) ( ) ( ) ( )
nm nm nm nm nm nmv
T
R
S
C
v
T
R
S
C
v
T
R
S
C
λ λ λλ
λ
λ
λ
λ
λ
λ
λ
λ
λ
λ
λ
= = ==
=
=
∑
∑
∑
(1), v1, v2, v3 represent the different output values of different sensors , T1, T2, T3 represent the
transmittance of different color filters, R represents the response of optical receiver and, TR (λ) is the sensitivity of combination of light filter and the optical receiver , S (λ) represents the lighting spectrum, C (λ) represents the object spectrum of reflection, λ is set from 380nm to the 780nm, and take 1nm as the interval, then indicates (1) by the matrix way, as (2) .
[ ] [ ] [ ]
[ ] [ ] [ ]
1 1 1 1 2 1 2 1 i i j j i i j j v TR S C v TR S C × × × × × × = • = •(2)
, where i=3, j=401. If the number of measured color ticket is k, we can obtain k set output.
[ ]
[ ]
[ ]
[ ]
[ ] [ ]
[ ]
1 1 2 2 [ ]j j i k i j j k i k i j j j j k v TR S C v TR S C × × × × × × × × = • • = • •(3)
When [TR]i× j can conform to CIE 1931 definition CMF of (Color Matching Function), then may obtain conforms to the CIE standard output three stimulus value, then the transformation is the CIE color coordinate. if it is unable to conform to the CIE 1931 standards, then may use of mathematical method of section 2.2 to reconstruct spectrum to obtains more approximately tri-stimulus values..
2.2 Eigenspectrum reconstruct
[ ]
, 2 ,[ ]
, 1 th i j m j k j m mC
a
B
==
∑
(4) (4) represents reconstruct kth spectrum, i=3, j=401 and k is the sum of measured spectrum. If the
By (5), when we measure k reflection spectrum, the 401 points which from 380nm to 780nm in three eigenvector, indicated by the
[B]
j i× . If also for known[TR]
i j× , when wants to measure an unknown reflection spectrum [SC]j,x ,that the output of by the sensor is [v]I,x. Then we can use (6) and (7) toobtain [a]i,x , that x represents the illumination light illumination in the random color ticket.
[ ]
2[
]
2 2 ,[ ]
[
]
2[ ]
2[ ]
2 , 1 i m x i x i j j m i j j i i x m v × TRS × a B × TRS × B × a = = •∑
= • •(6)
[ ]
C
j x,=
[ ] [ ]
B
j×2ia
j x,(7)
[
S C']
j x, =[ ] [ ]
S' j j× B j×2i•[ ]
a 2 ,i x(8)
[
XYZ
]
3,x=
[
CMF
] [
3×j•
S C
'
]
j x,(9)
So, when the
[B]
j i× and[TR]
i j× are known, the[SC]
j x, of unknown ticket and the[XYZ]
3,x can be calculated.2.3 Least square approximation
[ ]
[
]
[ ]
[ ]
[ ]
2 2 2 2 i k i j j k j i i k j k v TRS C C A v × × × × × × = • ⎡ ⎤ = • ⎣ ⎦ (10), where j=401, i=3, k is the number of color ticket, k=922. When the reconstruction
j k
SC ×
⎡ ⎤
⎣ ⎦ to original state [SC]i*j and the primitive least squares error (Least Square Error) has the minimum, uses[A]j*i for
to substitute [TR]i*j , the supposition optical fiber spectroscope measures the kth reflection spectrum is
[SC] , value of exports in the sensory element end is, may its expression for (11).
1 1,1 1,2 1,2 1 2,1 2,2 2,2 2 2 ,1 ,2 ,2 2 2 2 , ,th th i i j j j i j i i i k j j k C A A A v A A A v C A A A v C ´ é ù é ù é ù ê ú ê ú ê ú ê ú ê ú ê ú ê ú = ê ú · ê ú ê ú ê ú ê ú ê ú ê ú ê ú ê ú ê ú ê ú ê ú êë úû ê úë û ê ú ë û K K M M M M M K (11)
1,1 1, 1,2 2, 1,2 2 , 1, 1, 1 1,1 1,1 1, 1,2 2, 1,2 2 , 1, 2, 1 1,2 1,1 1, 1,2 2, 1,2 2 , 1, 2 , 1 1,2 ( ) 0 ( ) 0 ( ) 0 k n n i i n n n n k n n i i n n n n k n n i i n n i n n i A v A v A v C v A A v A v A v C v A A v A v A v C v A d d d = = = æ ¶ ç = é + + + - ù= ç ë û çç çç ç ¶ ç é ù ç = + + + - = ç ë û çç çç çç çç ¶ é ù = ë + + + - û= è
å
å
å
K K M K ,1 1, ,2 2, ,2 2 , , 1, 1 ,1 ,1 1, ,2 2, ,2 2 , , 2, 1 ,2 ,1 1, ,2 2, ,2 2 , , ,2 ( ) 0 ( ) 0 ( ) k m n m n m i i n m n n n m k m n m n m i i n m n n n m m n m n m i i n m n m i A v A v A v C v A A v A v A v C v A A v A v A v C A d d d = = ö÷ ÷÷ ÷÷ ÷÷ ÷÷÷ ÷÷ ÷÷÷ ÷÷ ÷÷÷ ÷ ç ÷ ç ÷ ç ÷÷ çç ÷ø ç ÷ ¶ é ù = ë + + + - û= ¶ é ù = ë + + + - û= ¶ = + + +-å
å
M K K M K 2 , 1 ,1 1, ,2 2, ,2 2 , , 1, 1 ,1 ,1 1, ,2 2, ,2 2 , , 2, 1 ,2 ,2 0 ( ) 0 ( ) 0 ( k i n n k j n j n j i i n j n n n j k j n j n j i i n j n n n j j i v A v A v A v C v A A v A v A v C v A A d d d = = = æ ö÷ ç ÷ ç ÷ ç ÷ ç ÷ ç ÷ ç ÷ ç ÷÷ ç ÷ ç ÷ ç ÷ ç ÷ ç ÷ ç ÷ ç ÷ ç ÷÷ ç ÷ ç ÷ ç ÷ ç é ù ÷ ç = ÷ ç ë û ÷÷ çç ÷ è ø ç ÷ ¶ é ù = ë + + + - û= ¶ é ù = ë + + + - û= ¶ =å
å
å
M K K M ,1 1, ,2 2, ,2 2 , , 2 , 1 ) 0 k j n j n j i i n j n i n n A v A v A v C v = é ù ê ú ê ú ê ú ê ú ê ú ê ú ê ú ê ú ê ú ê ú ê ú ê ú ê ú ê ú ê ú ê ú ê ú ê ú ê ú ê ú ê ú ê ú ê ú ê ú ê ú ê ú ê ú ê ú ê ú ê ú ê ú ê ú ê ú ê ú êæç ö÷ú êçç ÷÷ú êç ÷÷ú êçç ÷÷ êçç ÷÷ êç ÷ ÷ êçç ÷÷ êçç ÷÷ êçç ÷ êç ÷÷ êçç ÷÷ êç é ù ÷÷ ç êç ë + + + - û= ÷÷ êççè ÷÷ø êç ÷ ë û ê ÷ êå
K ú ú ú ú ú ú ú ú ú ú úúú ú (12) [ ] 1,1 2,1 ,1 ,1 1,2 2,2 ,2 ,2 1,2 2,2 ,2 ,2 2 1, 1, 2, 1, , 1, , 1, 1 1 1 1 1 1, 2, 2, 2, , 2, , 2, 1 1 1 1 2 2 m j m j i i m i j i i j k k k k n n n n m n n j n n n n n n k k k n n n n m n n j n n n n n n i i A A A A A A A A A A A A C v C v C v C v C v C v C v C v B ´ = = = = -= = = = ´ é ù ê ú ê ú ê ú ê ú ê ú ê ú ê ú ë û = ·å
å
å
å
å
å
å
K K K K M M M M K K K K K K 1, 2 , 2, 2 , , 2 , , 2 , 1 1 1 1 2 k k k k k n i n n i n m n i n j n i n n n n n i j C v C v C v C v = = = = ´ é ù ê ú ê ú ê ú ê ú ê ú ê ú ê ú ê ú ê ú ê ú ê ú ê ú ê ú ë ûå
å
å
å
å
M M M M K K (13)2.4 Measurement
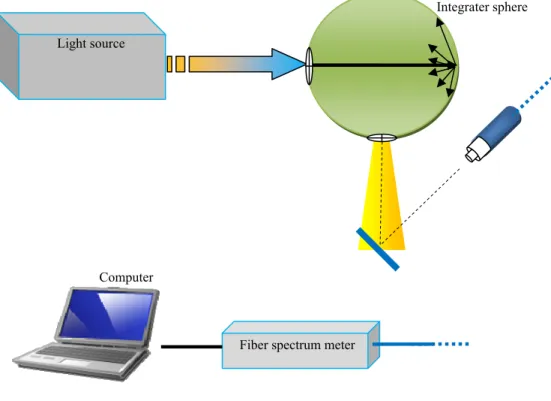
Fig. 1 This figure represents the measurement setup. The measurement has two types light source, which is tungsten and xenon. The color ticket has 922. The fiber spectrum meter can measure flux.
Light source
Fiber spectrum meter
Computer
3.
RESULTS
3.1 The measurement of tungsten light source and xenon light source
0 0.1 0.2 0.3 0.4 0.5 0.6 0.7 0.8 0 0.1 0.2 0.3 0.4 0.5 0.6 0.7 0.8 0.9 x y
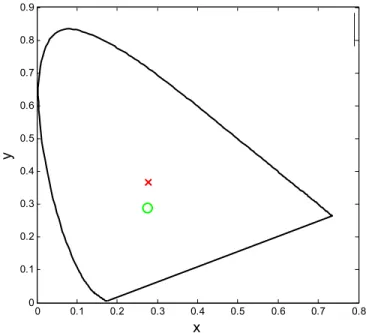
Fig. 2: The light source is tungsten. This figure is the color point distribution in xy chromaticity coordinate when the error is 0.078. The cross represents the measurement by sensor. The circle represents the measurement of spectrum meter. 0 0.1 0.2 0.3 0.4 0.5 0.6 0.7 0 0.1 0.2 0.3 0.4 0.5 0.6 0.7 u' v'
0 0.1 0.2 0.3 0.4 0.5 0.6 0.7 0.8 0 0.1 0.2 0.3 0.4 0.5 0.6 0.7 0.8 0.9 x y
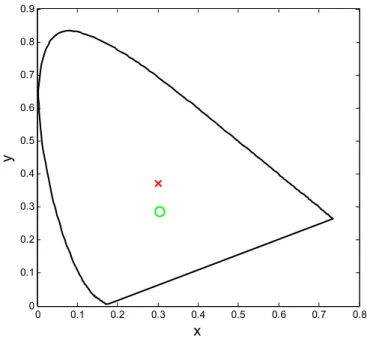
Fig. 4: The light source is xenon. This figure is the color point distribution in xy chromaticity coordinate when the error is 0.084. The cross represents the measurement by sensor. The circle represents the measurement of spectrum meter. 0 0.1 0.2 0.3 0.4 0.5 0.6 0.7 0 0.1 0.2 0.3 0.4 0.5 0.6 0.7 u' v'
Fig. 5: The light source is xenon. This figure is the color point distribution in u’v’ chromaticity coordinate when the error is 0.065. The cross represents the measurement by sensor. The circle represents the measurement of spectrum meter.
3.2 The results spectrum reconstruct
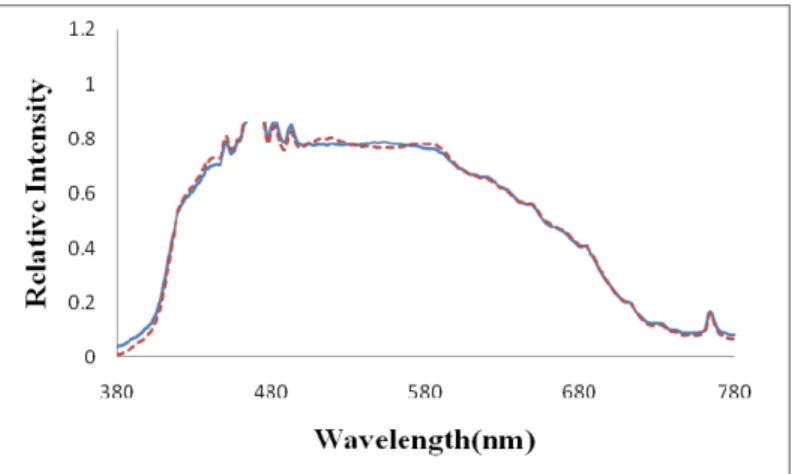
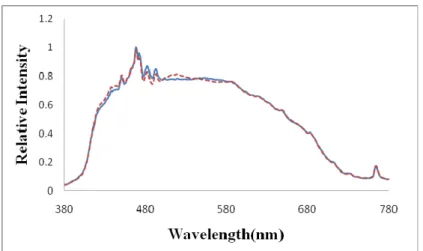
Fig. 6: This figure uses the method of eigenspectrum reconstruct to reconstruct the tungsten spectrum. The solid line represents the measurement by spectrum meter. The dash line represents the spectrum reconstruct.
Fig. 7: This figure uses the method of least square error to reconstruct the tungsten spectrum. The solid line represents the measurement by spectrum meter. The dash line represents the spectrum reconstruct.
Fig. 8: This figure uses the method of eigenspectrum reconstruct to reconstruct the xenon spectrum. The solid line represents the measurement by spectrum meter. The dash line represents the spectrum reconstruct.
Fig. 9: This figure uses the method of least square error to reconstruct the xenon spectrum. The solid line represents the measurement by spectrum meter. The dash line represents the spectrum reconstruct.
4. CONCLUSION
The color measuring instrument may replace the human eye to do for the objective color determination criterion. Human's eye is complex and sensitive, a good color measuring instrument must be able to substitute for the eye completely. In this research has used three sensitive spirit different light sensory element. The sensitivity and CIE 1931 schedule CMF
x
、y
、z
of definition, the existence relative difference, but its price is relatively speaking more inexpensive can cause the manufacture cost to reduce largely. In provides the characteristic spectrum reducing process, the least squares approximate method after the method, after two kind of adjustment calculating method adjustment, can effective reduce it in the even color space error. It Can cause its average error δEab922 to reduce to 0.8431, and can the use optical fiber spectroscope gauge and spectrum of information as well as the sensory element gauging output of the storage but of reflection spectrum reduced color ticket. And after the return to original state, the reflection spectrum and the optical fiber spectroscope measures reflection spectrum both root-mean-square value of the erroneous to be possible to reach 0.0103. Based on this result, we succeeds the sensory element obtains the precise chromaticity coordinate by three low in price, and can return to original state of reflection spectrum its testing color ticket. In light source part, when uses Xenon Lamp to do for the lighting source with when uses Tungsten Lamp does for the lighting source, will obtain the different result. When we use Xenon lamp does for the lighting source, regardless of uses the characteristic spectrum reducing process, or least squares approximate method, can obtain the more precise color coordinate value. Possible because Xenon Lamp in 380 to 780nm in visible scope spectral analysis average, therefore its can color of information average the expression moreover not stress in this from the blue color to the red wave band in any color. If can seek the more average light source, then can reconstruct to original state the more accurate reflection spectrum5. REFERENCE
[1] Y. Ohno and S. W. Brown, [Four-Color matrix method for correction of tristimulus colorimeters - Part 2], 65-68(1998).
[3] A. Pogosova, "Modeling of Human Color Vision System," Joensuu, Maste, 10(2007).
[4] R. S. Berns and F. H. Imai, "Spectral estimation using trichromatic digital cameras," proceedings of the International Symposium on Multispectral Imaging and Color Resproduction, 42-49(1999). [5] S. Westland, C. Ripamonti, and I. NetLibrary, "Computational Colour Science Using MATLAB."
vol. 10: J. Wiley Hoboken, NJ, 163-187(2004).
[6] L. T. Maloney, "Evaluation of linear models of surface spectral reflectance with small numbers of parameters," Optical Society of America, Journal, A: Optics and Image Science, (3), 1673-1683(1986).