Kinetics and Curing Mechanism of Epoxy and Boron
Trifluoride Monoethyl Amine Complex System
YE-SHIU LI, MING-SHIU LI, FENG-CHIH CHANG
Department of Applied Chemistry, National Chiao Tung University, Hsinchu, 300, Taiwan, Republic of China
Received 18 January 1999; accepted 7 May 1999
ABSTRACT: The kinetics of cationic polymerization of epoxy resin has been studied. Due to multiple reaction exotherms and irregular baselines involved in this system, the ASTM E 698 method was chosen to determine the kinetic parameters of this epoxy/ BF3-MEA system. The DER 332/BF3-MEA system follows the first order active chain
end (ACE) reaction mechanism. The adding of the hydroxyl group into the system is prone to decrease the activation energy and shifts the curing into the activated mono-mer (AM) mechanism due to the stronger nucleophilicity of the hydroxyl group than the epoxide group. On the other hand, the DER 331/BF3-MEA system possesses lower
activation energy because the DER 331 contains more hydroxyl groups—a-glycol and secondary alcohol. The former is the major contributor in lowering the activation energy. The hydroxyl group also can act as a chain transfer agent by retarding the propagation process, thus the reaction rate of the DER 332/BF3-MEA system is higher
than the DER 331/BF3-MEA system. The DER 332/BF3-MEA system shows good
correlation between the experimental data (FT-IR, DSC, and GPC) and the simulation curve based on ASTM E 698 before gelation, while a larger deviation is observed in the DER 331/BF3-MEA system. After gelation, the hydroxyl group also acts as an active site
to react with residual epoxy monomers and obtain a more condense matrix.© 1999 John Wiley & Sons, Inc. J Polym Sci A: Polym Chem 37: 3614 –3624, 1999
Keywords: epoxy; cationic polymerization; kinetics; reaction mechanism
INTRODUCTION
Generally the curing reaction of epoxy resin follows the nth order reaction or the autocatalytic reaction. The curing mechanism of the epoxy/amine system follows the autocatalytic model due to the increas-ing concentration of the hydroxyl group durincreas-ing the curing reaction that accelerates the curing reac-tion.1–7 Patel et al.8 claimed that the first order
reaction was in the epoxy/diethyltriamine system, however, his reported data was inconsistent. Woo and Seferis9reported that the epoxy/trimellitic
an-hydride system follows the second order kinetic
model because the ester group instead of the hy-droxyl group appears during the curing reaction. Similar results can also be obtained in the epoxy/ imidazole system. Heise and Martin10reported that the epoxy/2-ethyl-4-methyl-imidazole system fol-lows the first order kinetic model. Ghaemy11
re-ported that the cationic polymerization of epoxy/ BF3-EDA (boron trifluoride ethylene diamine) sys-tem follows the first order reaction by forming the epoxy-cationic complex and the reaction order be-comes 1.45 at the propagation process (or etherifi-cation). The BF3-EDA content of 6 –10 phr was
em-ployed in this study, which is substantially higher than normal usage of 2 phr. Thus, the polymeriza-tion process is accelerated by the presence of the amine group from the EDA.
The widely used differential scanning calorim-etry (DSC) softwares have been used to analyze Correspondence to: F.-C. Chang (E-mail: changfc@cc.nctu.
edu.tw)
Journal of Polymer Science: Part A: Polymer Chemistry, Vol. 37, 3614 –3624 (1999) © 1999 John Wiley & Sons, Inc. CCC 0887-624X/99/183614-11
curing kinetics including isothermal, Borchardt and Daniels,12and American Society for Testing
and Materials (ASTMVE) 69813 methods.
How-ever, only the ASTM E 698 method can be applied to the cationic polymerization of epoxy resin be-cause of multiple exotherms and irregular base-line. For the isothermal method, the reaction heat released from the higher temperature exothermic peak may not totally appear at a lower curing temperature. Thus the isothermal method suffers from the difficulty in determining the true reac-tion heat. The Borchardt and Daniels method is also inapplicable in this cationic polymerization of epoxy resin because the occurrence of the over-lapping reaction peaks in addition to the decom-position reaction during curing. Therefore, the ASTM E 698 method has been adopted to analyze the curing kinetics in this study.
Two commercially available DGEBA type ep-oxy resins, DER 331 and DER 332, are em-ployed in the study. The DER 331 resin contains substantially more hydroxyl groups than that of DER 332. The effect of hydroxyl group on epoxy curing mechanism and kinetics will be dis-cussed later.
EXPERIMENTAL Materials
Two DGEBA type epoxy resins, DER 331 and DER 332, with epoxide equivalent weights of 190 and 170, were purchased from the Dow Chemical Company (Midland, Michigan, USA). The compo-sitions of these two epoxy resins are listed in Table I. The boron trifluoride monoethyl amine complex (BF3-MEA) was supplied by the
Lan-caster Synthesis Ltd, Lancashire, UK. The ethyl-ene glycol was obtained from the Union Chemical Works Ltd. of Hsinchu, Taiwan. The 3-phenoxy-1,2-propanediol was supplied by the Aldrich Chemical Company of Dorset, UK. The 1-phe-noxy-2-propanol was supplied by the Lancaster Synthesis Ltd.
Procedures and Instrumentations
In order to mix completely the solid BF3-MEA and the epoxy resin, the epoxy resin is heated to 120°C. Then, 2 phr BF3-MEA is added and dis-solved in the resin. Then the solution is cooled down to room temperature by immersing the so-lution in a cold water bath. Since the
decomposi-tion temperature of the BF3-MEA is above 85°C, 14
the polymerization of epoxy is insignificant below this temperature. Thus the extent of reaction is ignored during the dissolving procedure. Calcu-lated amount of the hydroxyl-containing com-pound (3-phenoxy-1,2-propanediol, 1-phenoxy-2-propanol, ethylene glycol or phenol) is added and mixed completely at room temperature.
The kinetic studies and Tg measurements are conducted by a TA Instruments DSC 910 (New Castle, Delaware, USA) with heating rates of 2.5, 5, 10, and 20°C/min from 50 –300°C. The decom-position profile of the system is conducted by a TA Instruments TGA 951 with a constant heating rate of 10°C/min under air purging. The molecu-lar weight measurement is carried out by using a Waters 410 GPC (Milford, Massachusetts, USA) using flow rate of 1 ml/min. A Nicolet AVATAR 320 FT-IR (Madison, Wisconsin, USA) is used to analyze the epoxide group of the system with a resolution of 2 cm21.
Table I. The Compositions of Epoxy Used in This Study Items/Unit Materials DER 332 DER 331 Viscosity (cps)a 4,805 11,623 EEW (g/mol)a 173.4 185.6 DGEBA [n5 0] (%)b 98.0 79.3 [n5 1] (%) 0.0 11.1 [n5 2] (%) 0.0 2.2 a-Glycol (%) — 7.7 Others (%) 2.0 — Water, max (ppm)a 253.0 570.0 Hydro. Cl,cmax (ppm)a 201.0 234.0
aRepresents the data observed from the certificate of
anal-ysis supplied by the Dow Chemical Company.
bPercent represents the area fraction of optical density
measured by the refractometer of GPC.
cHydro. Cl (hydrolyzable chloride) represents the
RESULTS AND DISCUSSION Active Chain End (ACE) Mechanism
Penczek et al.15,16 proposed that the cationic po-lymerization of DER 332/BF3-MEA system
fol-lows the ACE mechanism as shown below: ACE Initiation
ACE Propagation
The active monomer is created by the BF3-MEA, and the concentration of the active monomer is considered to be constant because a constant BF3 -MEA concentration is employed. Therefore, the reaction rate is a first order to the concentration of the epoxy monomer.
ASTM E 698 Method
Figure 1(A) shows the DSC thermogram of the epoxy (DER 331) cured by the BF3-MEA, a small exotherm appears at about 120°C, followed by a larger exotherm between 130 and 220°C. This small exotherm at 120°C can be attributed to the thermal conversion of BF3-MEA to HBF4that has been previously reported.17,18 This larger
exo-therm is caused by the etherification reaction of the oxirane initiated by the HBF4 complex. The explanation of the final exotherm at 260°C is somewhat controversial. Chen and Pearce19
ex-plained this peak as result of further curing, while Tackie and Martin14 interpreted it as the
reaction between hydroxyl and oxirane. Figure 1(B) shows the corresponding dynamic TGA scan where a 3% weight loss occurs within the temper-ature range matching the last exotherm of the DSC thermogram. In other words, the exotherm at 260°C may come from further curing of oxirane and the thermal decomposition.
The reaction enthalpy of oxirane polymeriza-tion with multiple exotherms and irregular base-line of the thermogram is difficult to measure accurately. The kinetics of this epoxy/BF3-MEA system cannot be analyzed properly by traditional DSC methods. Therefore, the ASTM E 698 method has been adopted to overcome these lim-itations. The ASTM E 698 method assumes (1) the extent of the reaction at the exotherm peak, aP, is constant and independent of heating rate,
(2) the reaction rate constant obeys the Arrhenius equation [k 5 A exp(2Ea/RT)], and (3) the reac-tion is first order [da/dt 5 k(12a)]. This ASTM method requires several DSC scans at different heating rates. Based on the obtained linear rela-tionship between the reciprocal of exotherm peak temperature (TP) and the logarithm of the
heat-ing rate (log b), the Ozawa method20,21 can be
used to calculate the activation energy (Ea) of the system as follows:
Ea> 22.19R[d logb/d(1/TP)]
The pre-exponential factor (A) can then be evalu-ated:
A>bEa* exp(Ea/RTP)/RTP2
According to the assumption (1) of the ASTM E 698, the extent of reaction at exotherm peak is identical. As shown in Figure 2, the close area (I) Figure 1. DSC thermogram (A) and TGA
degrada-tion curve (B) of DER 331/BF3-MEA system at a
is observed for different heating rates (from 140.0 J/g to 148.6 J/g). In this study, area (I) is divided into four equal parts as area (a), (b), (c), and (d) as shown in Figure 3. Therefore, the corresponding temperatures Ta, Tb, Tc, and Tdall can be fitted to
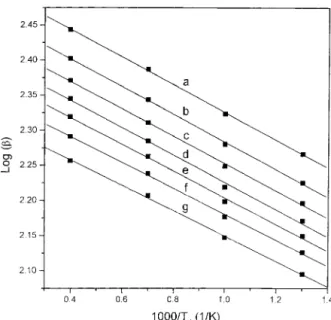
the assumption (1) of the ASTM E 698. The com-plementary area (II) is also divided into four equal parts and temperatures of Te, Tf, and Tgcan also be analyzed by this method. Figure 4 shows plots of the logarithm of heating rate versus the reciprocal of the analyzed temperature for the DER 332/BF3-MEA system resulting in high
lin-earity. This means that the ASTM E 698 is appli-cable in this system, and the calculated kinetic parameters of this system should be valid and are summarized in Table II. The activation energies, Eas, deviate within 10% (92–105 kJ/mol) while the pre-exponential factors (A) vary more signifi-cantly. Therefore, the apparent reaction rate con-stants also vary substantially.
Modification of the Data
The pre-exponential factor (A) generally reflects the collision frequency of the reactant molecules. During early stages of reaction, the monomer con-centration is expected to be higher and thus the pre-exponential factor is also higher. The temper-ature effect of different curing procedures is ex-pressed by the Arrhenius equation exp(2Ea/kT). Higher temperature induces higher motion speed of molecules, and thus increases the possibility of collision and reaction rate. The temperature ef-fect can be quantified by a modification factor (m), which obeys the Arrhenius equation exp(2Ea/ kT). Since the exotherm peak (point d in Fig. 3) Figure 2. DSC thermogram of DER 331/BF3-MEA
with different heating rates. (A) 20°C /min, DHI
5 144.0 J/g; (B) 10°C/min, DHI 5 148.6 J/g; (C) 5°C/
min,DHI5 140.0 J/g; (D) 2.5°C /min, DHI5 140.3 J/g.
Figure 3. Diagram of separated areas of the DER 332/BF3-MEA system at heating rate of 10°C/min.
Figure 4. Plots of logb vs. 1,000/Tdfor the DER 332/
shows the highest reaction efficiency, the modifi-cation factor (m) can be set as unity. Below this temperature (points a, b, or c), the factor is less than 1. That means slower molecular motion at lower temperature and thus lowers the reaction rate. Above the exotherm peak temperature (point e, f, or g), the factor m is greater than 1, implying higher vibration speed and greater pos-sibility of collision of the reaction. The factor m can be expressed as follows:
m5exp(2Ea/kTx) exp(2Ea/kTd) 5 exp
S
Ea kS
1 Td2 1 TxDD
where Ea 5 97.98 kJ/mol (average value of thisstudy) Tx5 Ta, Tb, Tc, Te, Tf, and Tg.
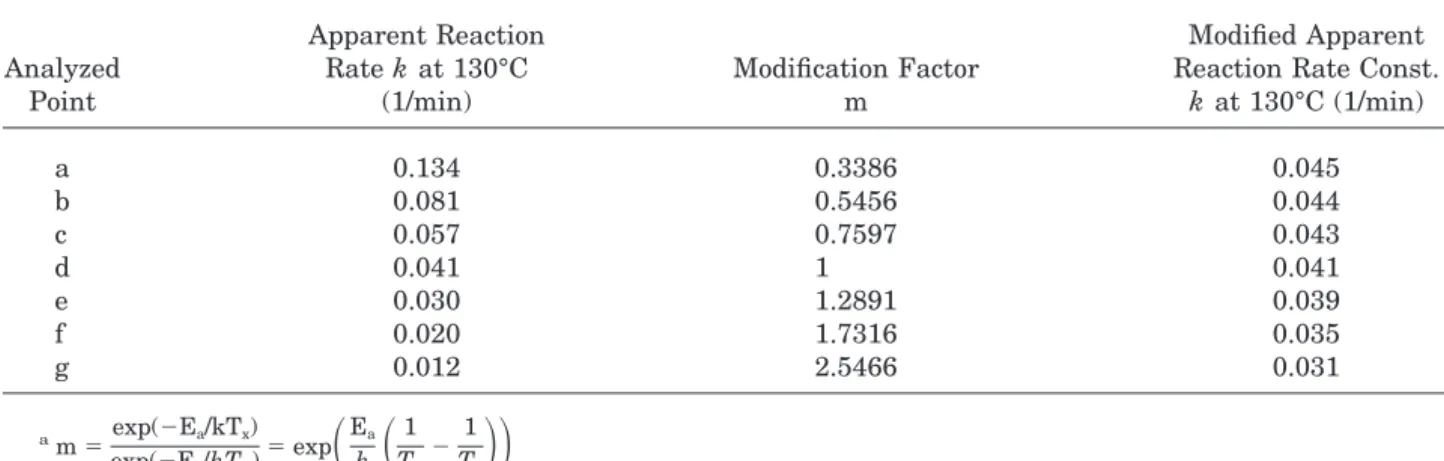
Table III lists the calculated factor m and other modified data of the system. The modified reac-tion rate constant is now fairly close before
gela-tion, an indication that the reaction indeed fol-lows the first order reaction model during early stages of the reaction. The modified reaction rate constant decreases gradually after exotherm peak because the diffusion control begins to dominate the reaction rate.
AM Mechanism
Our previous study22 using IR and GPC had
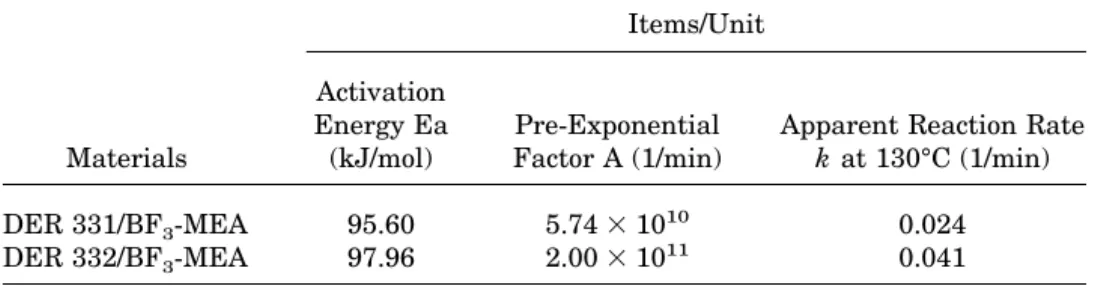
identified the major component of DER 331 and DER 332 epoxy resin as DGEBA. However, the DER 331 contains substantially higher content of hydroxyl and a-glycol (Table I). The kinetic parameters analyzed by the exotherm peak temperatures of these two epoxy resins are listed in Table IV. The DER 331/BF3-MEA
sys-tem shows lower activation energy, pre-expo-nential factor, and reaction rate constant than Table II. Kinetic Parameters Analyzed by the Exotherm Profile of the DER 332/BF3-MEA System
a Analyzed Point d log(b)/d(1/TX) X5 a, b, . . . g Activation Energy Ea (kJ/mol) Pre-Exponential Factor A Apparent Reaction Rate k at 130°C (1/min) a 25054.3 92.10 1.153 1011 0.134 b 25161.5 93.98 1.223 1011 0.081 c 25241.2 95.43 1.313 1011 0.057 d 25380.0 97.96 2.003 1011 0.041 e 25457.6 99.37 2.253 1011 0.030 f 25619.1 102.31 3.663 1011 0.020 g 25751.4 104.72 4.573 1011 0.012 aEa> 22.19R[d logb/d(1/T X)] A>bEa* exp(Ea/RTX)/RTX 2 k5 A* exp(2Ea/RTR) where TR5 130°C.
Table III. Modified Kinetic Parameters of the DER 332/BF3-MEA Systema
Analyzed Point Apparent Reaction Rate k at 130°C (1/min) Modification Factor m Modified Apparent Reaction Rate Const.
k at 130°C (1/min) a 0.134 0.3386 0.045 b 0.081 0.5456 0.044 c 0.057 0.7597 0.043 d 0.041 1 0.041 e 0.030 1.2891 0.039 f 0.020 1.7316 0.035 g 0.012 2.5466 0.031 am5exp(2Ea/kTx) exp(2Ea/kTd) 5 exp
S
Ea kS
1 Td2 1 TxDD
the corresponding DER 332/BF3-MEA system. The variations of these observed kinetic param-eters can be explained from the cationic poly-merization mechanism of oxirane. Penczek et al.15,16 proposed that the DER 331/BF
3-MEA
system follows both ACE and activated mono-mer (AM) mechanisms as below.
AM Initiation
AM Propagation
AM Re-Initiation
The higher nucleophilicity of a hydroxyl group than an oxirane makes the AM mechanism more favorable than the ACE initiation.23,24Therefore,
the activation energy Ea of the DER 331/BF3 -MEA system is lower than that of the DER 332/ BF3-MEA system as would be expected. However, the re-initiation and propagation rate of the AM mechanism are slower than the propagation rate of the ACE mechanism because these hydroxyl groups are able to act as a transfer agent to retard the reaction during polymerization.24 By taking
these competition reactions into account, the ap-parent reaction rate decreases with the presence of hydroxyl groups.
Effect of Hydroxyl Group
Based on above description, the ACE mechanism follows the first order reaction while the AM mechanism does not. Figure 5 shows the plots of logb versus 1,000/Td for the DER 332/EG/BF3 -MEA system. When 0.7 phr of the ethylene glycol is added into the system [curve (B)], the slope of the system is indeed slightly lower than the DER 332/BF3-MEA system due to the appearance of AM mechanism. When a stoichiometric amount of the ethylene glycol (1.8 phr) is added [curve (C)], Table IV. Activation Energy, Pre-Exponential Factor, and Apparent Reaction Rate
Constant of This Studya
Materials Items/Unit Activation Energy Ea (kJ/mol) Pre-Exponential Factor A (1/min)
Apparent Reaction Rate
k at 130°C (1/min)
DER 331/BF3-MEA 95.60 5.743 1010 0.024
DER 332/BF3-MEA 97.96 2.003 10
11 0.041
aAnalysis based on exotherm peak temperature, T
d.
Figure 5. Plots of log b vs. 100/ Td for the DER
332/BF3-MEA system. The solid lines are regression
lines. (A) DER 332/BF3-MEA; (B) DER 332/EG(0.7phr)/
the AM mechanism becomes dominant and the ACE mechanism is supressed. As the results of the dominant AM mechanism, the system shows poor regression on the plot of logb versus 1,000/Td diagram.
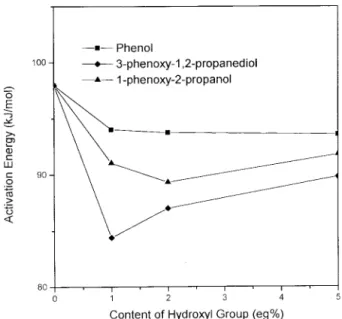
In order to compare the effect of different hy-droxyl group in DER 331, both 1-phenoxy-2-pro-panol and 3-phenoxy-1,2-propanediol are used to simulate the presence of secondary alcohol and a-glycol of the DER 331 monomer. Figure 6 shows the effect of hydroxyl group on the activation en-ergy of DER 332/BF3-MEA system. The presence of 3-phenoxy-1,2-propanediol results in the lower activation energy than that from the 1-phenoxy-2-propanol. The 1°-alcohol structure of 3-phe-noxy-1,2-propanediol has stronger nucleophilicity than 1-phenoxy-2-propanol (2°-alcohol only). Therefore, the a-glycol structure in DER 331 resin is mainly responsible for lowering the acti-vation energy to induce the AM mechanism.
Figure 6 also shows less effect of phenol in lowering the activation energy. This can be ex-plained by the fact that the aromatic structure of phenol weakens the nucleophilicity, and results in less change in activation energy.
Another interesting trend shown in Figure 6 is that a higher hydroxyl content (above 1% eq.) actually results in higher activation energy. Since the hydroxyl group can also act as the chain transfer agent, this results in retarding the prop-agation process and higher activation energy.
Figure 7 shows the activation energies of DER 331/BF3-MEA, DER 332/BF3-MEA, and DER 332/ BF3-MEA systems containing 1% eq. content of hydroxyl group during curing. The activation en-ergies from all these systems increase with the progress of reaction. Relative to the DER 332/ BF3-MEA system, the Eas of those systems con-taining hydroxyl groups (including the DER 331/ BF3-MEA system) increase slower after gelation (processes e, f ,and g). During the diffusion control region, the AM mechanism provides more active sites (hydroxyl group and active oxirane group) than that of the ACE mechanism (active oxirane group only).
Comparison between DER 331/BF3-MEA and DER 332/BF3-MEA System
The kinetic results of ASTM E 698 are verified by the DSC, GPC, and FT-IR analysis. Put the DER 331/BF3-MEA mixture in a 130°C oven, and take a sample every 5 min until the gelation. The only difference in the DER 332/BF3-MEA system is that the time interval for taking a sample is 4 min. These samples are analyzed by DSC and GPC to measuring the residual monomer ratio and molecular weight. This study also uses a FT-IR to detect the change of oxirane group. The time interval to take a spectrum is the same as above, the only difference is that a heater and a ature controller are used to maintain the
temper-Figure 7. Activation energy Ea (kJ/mol) of the DER 332/hydroxyl group/BF3-MEA system at different
reac-tion stages.
Figure 6. Activation energy Ea (kJ/mol) of the DER 332/hydroxyl group/BF3-MEA system with different
ature of the salt disk, thus there is no need for sampling in this experiment.
Figure 8 shows the thermogram plot of 130°C cured DER 332/BF3-MEA system at different
cur-ing times. The extent of reaction can be obtained by calculating the ratio of the remaining therm to the original exotherm. The smaller exo-therm near 260°C is ignored in this study for the
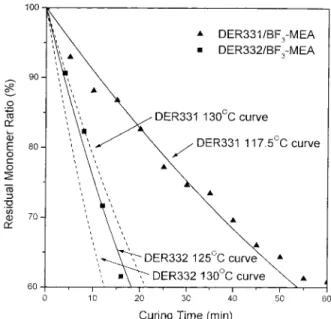
appearance of degradation reaction. Figure 9 compares the residual monomer ratio at 130°C by experiment and by the thermodynamical simula-tion based on ASTM E 698. The simulasimula-tion curve of 125°C fits well with experiment data on the DER 332/BF3-MEA system. The 5°C deviation can be attributed to the sampling procedure from the temperature-controlled oven and causes the actual temperature to be lower than the set tem-perature. On the other hand, the deviation of the Figure 9. Correlation between the experimental
re-sidual monomer ratio (%) at 130°C and the ASTM E 698 theoretically predicted curves.
Figure 10. GPC diagrams of the 130°C cured (A) DER 331/BF3-MEA system, and (B) the DER 332/BF3
-MEA system at different curing times
Figure 8. Thermograms of 130°C cured DER 332/ BF3-MEA system at different curing times.
DER 331/BF3-MEA system is higher than 10°C, implying that the first order reaction model can-not describe the behavior of the DER 331/BF3 -MEA system adequately.
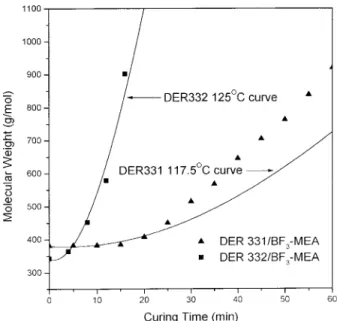
Figure 10(A) and (B) show the GPC diagram of 130°C cured DER 331/BF3-MEA and DER 332/ BF3-MEA systems at different curing times. The main peak at retention time of 33 min corre-sponds to the epoxy monomer (n5 0), while the smaller peak at retention time of 29 min in Figure 10(A) is attributed to the epoxy dimer (n5 1) of DER 331. A small peak between them (retention time of 31 min) is thea-glycol containing DGEBA. There is only a peak at 33 min in Figure 10(B), implying that the quantity of other minor compo-nents in this DER 332 is insignificant. The mo-lecular weights of these specimens are obtained by calibrating with pure epoxy monomer (n5 0, M.W. 5 340 g/mol), dimer (n 5 1, M.W. 5 608 g/mol) and trimer (n5 2, M.W. 5 876 g/mol).
Figure 11 shows the plots of molecular weight (Mw) versus the reaction time (min) of this study. The solid lines in Figure 11 are the theoretically predicted Mwof the system based on the assump-tion that the polymerizaassump-tion occurs only on the activated chains and molecular weight of each activated chain is identical, as follows:
MW 5
O
NM2O
NM 5 NmMm2 1 NPMP2 NmMm 1 NPMP whereNm : mole of residual monomer
NP : mole of polymer (same mole as BF3-MEA)
Mm : molecular weight of monomer (380 g/mol and 340 g/mol for DER 331 and DER 332, respectively)
MP : molecular weight of polymer, which can be calculated by averaging the consumed monomer (measured by DSC) on each poly-mer chain, as follows:
MP 5
Nm0aMm NP where
Nm0 : mole of initial epoxy monomer a : extent of reaction (5 1 2 e2kt).
Thus, the Mwcan be deduced by following:
MW 5 Mme2kt1
Nm0Mm
NP
(12 e2kt)2
The same temperature deviation can be ob-served in this experiment (5°C for DER 332/BF3 -MEA and 12.5°C for DER 331/BF3-MEA), which is attributed to the same reason. The larger devi-ation at higher molecular weight can be attrib-uted to the locally gelation caused by higher de-gree of polymerization.
The FT-IR can also be used to follow the poly-merization process. The 915 cm21 peak corre-sponds to the epoxide group, and the integrate value of the peak is viewed as the monomer con-tent. Since this peak will not disappear com-pletely after the end of the reaction, the area of this peak is modified by minus the ultimately area. The residual monomer ratio is then ob-tained by dividing the area of 915 cm21peak to the original one. Figure 12 shows the plot of re-sidual monomer ratio versus curing time of the study, and the solid lines are the simulation curves based on the ASTM E 698. The DER 332/ BF3-MEA system shows good simulation to 130°C theoretically simulation curve and the deviation for the DER 331/BF3-MEA system is also smaller (10°C), which is due to the better temperature control of this experiment. Both systems show good correlation before gelation (20 and 60 min for the DER 332/BF3-MEA and the DER 331/BF3 -MEA system, respectively). The deviation after Figure 11. Molecular weight (g/mol) vs. reaction time
(min) of 130°C cured DER 331/BF3-MEA and DER 332/
gelation is attributed to the diffusion control of both systems.
To sum up, the simulation curve based on ASTM E 698 correlates adequately with the re-sults of FT-IR, and the same deviation can be observed with the analyses of DSC and GPC. The better simulation is obtained in the DER 332/BF3
-MEA system because the ACE curing mechanism follows the first order reaction.
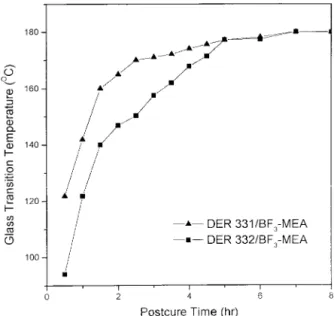
The simulation of GPC and FT-IR analyses can only be applied adequately before the system reaches the gel point; after that, the Tgis used to characterize the molecular structure. Figure 13 shows the Tgversus postcure time at 200°C of this study. Experiments were carried out by placing the sample into a 130°C oven for 60 min, and then raising the temperature to 200°C to postcure. The postcure was maintained in vacuum to minimize possible degradation induced by oxidation. Al-though the DER 332/BF3-MEA system reacts faster before the gelation than the DER 331/BF3
-MEA system, however, the latter system shows higher Tg after 30 min of postcure. This result confirms that the hydroxyl groups of the DER 331/BF3-MEA system provide additional reactive
sites to react with the remaining epoxy monomer, thus a more condense matrix can be obtained than that of the DER 332/BF3-MEA system. After
5 h postcure, Tgs of both systems reach 177°C.
CONCLUSIONS
According to the ASTM E 698 analysis, the DER 332/BF3-MEA system follows the first order
ac-tive chain end (ACE) reaction mechanism. The pre-exponential factor is higher at the beginning of the reaction because of higher monomer con-centration. A correction factor based on Arrhe-nius equation is adopted into the system, and the apparent reaction rate becomes fairly close after such modification during early stages of the reac-tion, which agrees with the assumption of first order reaction. The DER 331/BF3-MEA system
follows both the ACE and the activated monomer (AM) mechanisms due to the presence of hydroxyl groups from both a-glycol and 2°-alcohol of the DER 331 epoxy resin. Thea-glycol is more effec-tive on inducing AM mechanisms than the 2°-alcohol. That means that thea-glycol structure of the DER 331 resin is mainly responsible for in-ducing the AM mechanism. The hydroxyl group can also act as a chain transfer agent, thus the activation energy increases gradually with in-creasing content of the hydroxyl group. The reac-tion rate of the DER 332/BF3-MEA system is
higher than the DER 331/BF3-MEA system. Only
the DER 332/BF3-MEA system can be simulated
adequately by the first order reaction model be-fore gelation. The FT-IR analysis shows better simulation for the better temperature control of salt disk, while the data of DSC and GPC shows
Figure 13. Tg (°C) vs. postcure time (hr) of 200°C
cured DER 331/BF3-MEA and DER 332/BF3-MEA
sys-tems.
Figure 12. Residual monomer ratio (%) vs. reaction time (min) at 130°C under FT-IR 915cm21peak mea-surement.
5°C deviation for opening the 130°C oven and taking a sample every 4 min. The DER 331/BF3 -MEA system results in higher Tg after 200°C postcure because the hydroxyl group can also act as reactive sites to react with residual epoxy monomers.
This research is financially supported by the National Science Council, Taiwan, Republic of China, under con-tract NSC 87-2216-E-009-007. We also thank the Epo-lab Chemical Co. of Taiwan for materials donation.
REFERENCES AND NOTES
1. Senen, P. A.; Arturo, L. Q.; Mercedes, P. P.; Mont-serrat, V.; Pilar, P. J Polym Sci Poly Chem Ed 1998, 36, 1001.
2. Chandra, R.; Soni, R. K Polym Int 1993, 31, 239. 3. Chiao, L. Macromolecules 1990, 23, 1286.
4. Hsieh, T. H.; Su, A. C. J Appl Polym Sci 1990, 41, 1271. 5. Grillet, A. C.; Galy, J.; Pascault, J. P.; Bardin, I.
Polymer 1989, 30, 2094.
6. Spacek, V.; Pouchly, J.; Biros, J. Eur Polym J 1987, 23, 5, 377.
7. Barton, J. M. J Polym Comm 1980, 21, 603. 8. R. D.; Patel, R. G.; Patel, and V. S. Patel, British
Polym. J., 1987, 19, 37.
9. Woo, E. M.; Seferis, J. C. J Appl Polym Sci 1990, 40, 1237.
10. Heise, M. S.; Martin, G. C. J Appl Polym Sci 1990, 39, 721.
11. Ghaemy, M. Eur Polym J 1998, 34, 1151.
12. Wendlandt, W. W. Thermal Analysis vol. 1, Ch. 5; New York: Wiley, 1986.
13. ASTM E 698-79.
14. Tackie, M.; Martin, G. C. J Appl Ploym Sci 1993, 48, 793.
15. Penczek, S.; Kubisa, P.; Szymanski, R. Makromol Chem Macromol Symp 1986, 3, 203.
16. Penczek, S.; Kubisa, P.; Szymanski, R. Makromol Chem Macromol Symp 1986, 6, 201.
17. Smith, R. E.; Larsen, F. N.; Long, C. L. J Appl Polym Sci 1984, 29, 3697.
18. Smith, R. E.; Smith, C. H. J Appl Polym Sci 1986, 31, 929.
19. Chen, C. S.; Pearce, E. M. J Appl Polym Sci 1989, 37, 1105.
20. Ozawa, T. J. Therm Anal 1970, 2, 301. 21. Ozawa, T. J. Therm Anal 1970, 9, 369.
22. Li, M. S.; Ma, C. C. M.; Lin, M. L.; Chang, F. C. Polymer 1997, 38, 19, 4903.
23. Hammond, J. M.; Hooper, J. F., Robertson, W. G. P. J Polym Sci A, Polym Chem 1971, 19, 265. 24. Bouillon, N.; Pascault, J. P.; Tighzert, L. Makromol
![Table I. The Compositions of Epoxy Used in This Study Items/Unit MaterialsDER 332 DER 331 Viscosity (cps) a 4,805 11,623 EEW (g/mol) a 173.4 185.6 DGEBA [n 5 0] (%) b 98.0 79.3 [n 5 1] (%) 0.0 11.1 [n 5 2] (%) 0.0 2.2 a-Glycol (%) — 7.7 Others (%) 2.0 — Wa](https://thumb-ap.123doks.com/thumbv2/9libinfo/7660044.140338/2.921.494.838.146.444/table-compositions-epoxy-study-materialsder-viscosity-dgeba-glycol.webp)