Imaging the pair-correlated excitation function: The F + CH 4 HF (v )+ CH 3 (=0)
reaction
Weicheng Shiu, Jim J. Lin, Kopin Liu, Malcom Wu, and David H. Parker
Citation: The Journal of Chemical Physics 120, 117 (2004); doi: 10.1063/1.1629668 View online: http://dx.doi.org/10.1063/1.1629668
View Table of Contents: http://scitation.aip.org/content/aip/journal/jcp/120/1?ver=pdfcov
Published by the AIP Publishing
Articles you may be interested in
Rotationally selected product pair correlation in F + CD 4 DF ( )+ CD 3 (=0, N )
J. Chem. Phys. 120, 5863 (2004); 10.1063/1.1689634
Mode-correlated product pairs in the F + CHD 3 DF + CHD 2 reaction
J. Chem. Phys. 119, 8289 (2003); 10.1063/1.1611877
Photodetachment of F (H 2 O) n (n=1–4): Observation of charge-transfer states [ F (H 2 O) n + ] and the transition state of F+H 2 O hydrogen abstraction reaction
J. Chem. Phys. 115, 2889 (2001); 10.1063/1.1394758
Energy-dependent cross sections and nonadiabatic reaction dynamics in F ( 2 P 3/2 , 2 P 1/2 )+n– H 2 HF (v,J)+ H
J. Chem. Phys. 111, 8404 (1999); 10.1063/1.480182
Rotationally resolved differential scattering cross sections for the reaction F+para-H 2 (v=0,j=0) HF (v =2,3,j )+ H
J. Chem. Phys. 110, 10231 (1999); 10.1063/1.478955
Imaging the pair-correlated excitation function: The F
¿
CH
4\
HF
„
v
⬘
…
¿
CH
3„
Ä
0
…
reaction
Weicheng Shiu, Jim J. Lin,a)and Kopin Liub)
Institute of Atomic and Molecular Sciences, Academia Sinica P.O. Box 23-166, Taipei 106, Taiwan
Malcom Wu and David H. Parker
Department of Molecular and Laser Physics, University of Nijmegen, Toernooiveld 1, 6525 ED Nijmegen, The Netherlands
共Received 3 September 2003; accepted 6 October 2003兲
The velocity map ion imaging technique was applied to measure the reaction excitation function for the first time. It was found that the ‘‘raw’’ excitation function was significantly distorted by the density-to-flux transformation of the title reaction. Through a systematic investigation, possible reasons for such a dramatic effect are outlined. In addition, the state-resolved, pair-correlated excitation functions and branching ratios are presented. Effects of imperfect time slicing in the time-sliced velocity imaging technique in general are also discussed. © 2004 American Institute of
Physics. 关DOI: 10.1063/1.1629668兴
I. INTRODUCTION
The reactive excitation function(Ec), namely the de-pendence of the integral cross section 共ICS兲 on the initial translational energy Ec, is an important quantity in reaction
dynamics. It measures the efficiency of the translational en-ergy in driving the reaction system to the critical region of the transition state. It also serves as the most direct link between reaction dynamics and thermal kinetics.1 The crossed molecular beam method has long been established to be one of the most powerful approaches for such in-vestigations.1,2
Over the past several decades, we have examined the state-specific excitation functions for a number of elementary reactions1 and energy transfer processes,3 using a rotating sources, crossed-beam apparatus. The product state specific-ity was achieved by either laser-induced fluorescence or resonance-enhanced multiphoton ionization共REMPI兲 for in-terrogation. Because the density-to-flux problem—which is associated with the laser based detection scheme and requires the differential cross section 共DCS兲 information—is of con-cern, a simpler experimental approach to alleviate the prob-lem for obtaining the excitation function was developed.4 The premise of this approach relies on the fact that the true cross section is independent of the experimental geometry. Practically, we varied the collision energy by changing the intersection angle of the two molecular beams. Using two different seeding mixtures for the radical beam, thus two different beam speeds or kinematics for the same Ec, we
examined the consistency of these two sets of data over the overlapped energy range. This approach has stood the test for many reactions, and appears to be quite reliable.1,5–7
The above-mentioned approach, however, makes no
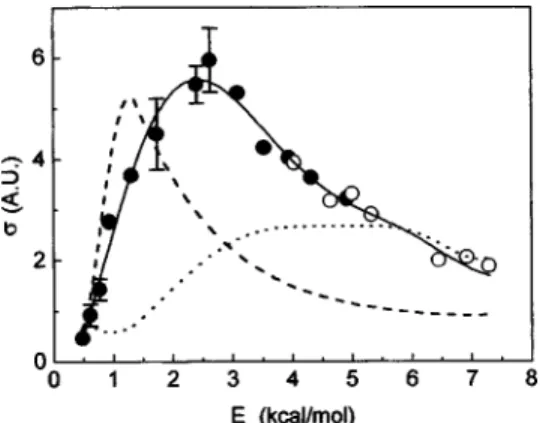
ex-plicit correction for the density-to-flux problem. The consis-tency criterion provides a necessary, but not a sufficient con-dition to recover the excitation function from measurements. Reported here is a case where the previous approach can lead to a very different impression of the excitation function of interest. Shown in Fig. 1 is the ‘‘raw’’ or the ‘‘apparent’’ excitation function, acquired in the same manner as the pre-vious investigations,1,4of the title reaction for the formation of the ground state CH3(⫽0). The F-atom beam was
gen-erated by discharging 5% F2 seeded either in He or in Ne
with the beam speed of 1.62 or 1.13 km/s, respectively. The former covers the energy range from 1.7 to 7.3 kcal/mol, whereas the latter from 0.48 to 4.9 kcal/mol. As is seen, the consistency of the two sets of data over the overlapped en-ergy range is quite reasonable. The shape of the apparent excitation function is, however, peculiar. It rises sharply from the threshold of⬍0.5 kcal/mol and forms a prominent peak near 1.3 kcal/mol followed by a rapid decline with further increase in collision energy. Particularly worth noting are how abrupt the post-maximum decline is and how small the cross section approaches at high energies. Its appearance also differs significantly from those found previously for the iso-topically analogous reaction of F⫹CD4.
8
This ‘‘unusual’’ shape prompted us to scrutinize the title reaction further and to examine the effects of the density-to-flux transformation on the ICS measurements in greater detail.
The remainder of the paper is organized as follows: A brief description about the experiments will be given in Sec. II. The results will then be presented, which include the ef-fectiveness of time slicing in the three-dimensional共3D兲 ve-locity imaging and the effects of the density-to-flux transfor-mation on ICS. A discussion of the dynamical implications of the excitation function will then follow. The reason for the failure of the previous approach 共Fig. 1兲 will also be dis-cussed; this should serve as a caution for future investiga-tions.
a兲Also at: Department of Applied Chemistry, National Chiao Tung
Univer-sity, Hsinchu, Taiwan 300. Electronic mail: jimlin@po.iams.sinica.edu.tw
b兲Also at: Department of Chemistry, National Taiwan Normal University,
Taipei 106, Taiwan. Electronic mail: kpliu@gate.sinica.edu.tw
117
0021-9606/2004/120(1)/117/6/$22.00 © 2004 American Institute of Physics
II. EXPERIMENT
The experiment was carried out using the rotating-sources, crossed-beam apparatus as detailed previously.8 –10 The probe of the CH3 product was achieved by a (2⫹1)
REMPI scheme via the intermediate 3 pz 2A
⬙
Rydbergstate.8,11For the ‘‘apparent’’ excitation function measurement
共Fig. 1兲, the ion optics was operated in the spatial mode,
namely no velocity mapping, to minimize the local bleaching effects on the microchannel plates from long-term running. At each intersection angle the probe laser wavelength, near 333 nm, was scanned over the Q-head of the CH3(00
0
) band, and the ion signal was acquired by a boxcar integrator gated for m/e⫽15 in the ion time-of-flight 共TOF兲 mode of opera-tion. Dividing the signal by the initial relative speed yields the ‘‘apparent’’ cross section.
To recover the true excitation function, one needs to make the density-to-flux correction, which in turn requires information about DCSs over a fairly wide range of energies. Performing the same experiments but shifting to the time-sliced velocity-imaging mode of operation10for different col-lision energies accomplished this. To make direct compari-sons to the ‘‘boxcar’’ results共Fig. 1兲, the laser was scanning back and forth over the Q branch many times while the image was acquired. The scanning of the laser wavelengths results in an approximately rotationally integrated image for a given vibrational state of CH3 products, which is different
from the partially rotational-selected image reported previ-ously for the F⫹CD4reaction.
10,12,13
No rotational alignment effects were found, even when the N-selected CH3 共and CD3) products were imaged共unpublished results兲. To make
the density-to-flux transformation more robust, the path of the probe laser was also scanned 共typically ⫾8 mm) back and forth to generate an artificial laser sheet for interro-gation.10Again, the consistency criterion that the ICS mea-surements at the same collision energy should be indepen-dent of the experimental geometries was examined to ensure the results are devoid of experimental artifacts.
III. RESULTS
A. Effects of time slicing
For a scattering or a photodissociative process, the desired differential quantity is d3 /dud⍀, where d⍀ is the solid angle element d(cos)d in the center-of-mass
共c.m.兲 frame. Using the 3D velocity mapping approach,
either the Doppler-selected TOF method14or the time-sliced velocity imaging technique,10 one actually measures
d3 /duxduyduzor D(ux, uy, uz) in a c.m. Cartesian
coor-dinate after the density-to-flux correction. Since the c.m. ve-locity volume element should be invariant to the coordinates, i.e., Cartesian or polar, the desired and the measured quanti-ties can readily be related through d3 /u2 dud⍀ ⫽d3 /du
xduyduz. Since the scattering process usually
ex-hibits a cylindrical symmetry around the initial relative ve-locity vector, one is free to integrate the azimuthal angle to just report the DCS as d2 /dud(cos)⬀u2 D(ux, uy, uz
⬇0),14
where the z axis denotes the ion TOF axis in the time-sliced velocity imaging approach. And D(ux, uy, uz
⬇0) can be approximated by the velocity mapped image 共in
the x – y plane which contains the relative velocity兲 when the Newton sphere is sliced through the center. Practically, this simple relationship between the measured and desired quan-tities will be valid only if the gate width used in the time-sliced, velocity-mapped image is sufficiently narrow to have an effective central slicing. Clearly, given a gate width, there is always a range of u, for which the products are recoiled with sufficiently small velocities so that the slicing condition cannot be met. The situation then returns to the conventional two-dimensional 共2D兲 共or compressed兲 imaging. The ques-tions are: How narrow a gate width should one use for ef-fective time slicing? And, how can corrections be made for imperfect slicing when measuring very small values of u?
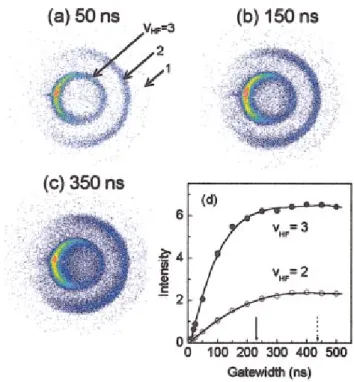
Figure 2 shows the systematic study of the effects of the gate width. The initial collision energy was 4.91 kcal/mol, and the voltages of the ion optics were held constant 共14 V/cm extraction field兲 while the gate width was varied. Fig-ures 2共a兲–2共c兲 display three representative images corre-sponding to the narrow, medium, and wide gates, respec-tively. Three well-separated rings are clearly visible. Energetically, they are ascribed to the coincidently formed HF products inv⫽3, 2, and 1, respectively. At first glance, it
might be surprising to see such well-separated features for the wide-gate case 关Fig. 2共c兲兴. After all, if the gate is wide enough, then the image should essentially become a com-pressed共2D兲 one—blurring the structural features should be observed. The main reason is in fact the very same as the need for the density-to-flux transformation.4 In a typical crossed-beam experiment, the time for collision is long,
⬎5 – 10s depending on the molecular beam pulse widths. The probe laser samples only those products remaining in the laser illumination region when it is fired, and thus are blind to those flying out of the probing volume. In other words, the laser 共sheet兲 detection effectively acts as a first-cut 共spatial兲 slice in the scattering zone.
Summing up the ion counts within the annulus for each individual ring yields the total ion signals for the correspond-ing pair-correlated product states. The results are
summa-FIG. 1. The apparent excitation function for the formation of CH3(v⫽0)
product from the F⫹CH4 reaction. Two different F-atom beams, 5% F2
seeded in He共䊊兲 and 5% F2in Ne共•兲, were used to cover the full energy
range.
118 J. Chem. Phys., Vol. 120, No. 1, 1 January 2004 Shiuet al.
rized in Fig. 2共d兲. 关The events for HF(v⫽1) are statistically negligible in this work.兴 Also marked in arrows are the maxi-mal temporal spreads of the corresponding pairs, calculated on energetic grounds and the ion-optics settings. The signals display a linear rise for smaller gate width, and gradually approach their respective limits at different rates for wider gates. Similar experiments were also performed at two lower collision energies 2.63 and 1.73 kcal/mol. The general obser-vations noted in Fig. 2共d兲 appear to be universal. All of these can readily be understood. It should also be apparent that the figure-of-merit for the effectiveness of time slicing has to do with the ratio of the gate width and the temporal spread of the ion clouds. Qualitatively, an ion cloud with a small tem-poral spread will require a narrower gate. In addition, the rate of approaching the limit depends on, among other factors, the actual angular distribution.
With a series of images as a function of gate widths in hand, we are in a position to answer the first question ad-dressed above. For each image, we performed the density-to-flux transformation as detailed previously.10 It should be noted that the generation of the density-to-flux transforma-tion matrix was based on the assumptransforma-tion that the gate width is narrow enough to have a valid sliced image. If the gate width is too wide, the共blind兲 use of the matrix will yield an erroneous result. Hence, our strategy is to use the gate width evolution of various dynamics attributes as a gauge to find out the optimal gate width to be used. Figure 3 summarizes the results for the reactive fluxes into HF(v⫽3) and HF(v
⫽2), and Fig. 4 for their ratios at Ec⫽4.91, 2.63, and 1.73
kcal/mol, respectively. 共The state-resolved, pair-correlated DCS is too involved and will be the subject for the future.兲
To account for the fact that the narrower gate inevitably samples few events, we normalized the state-resolved fluxes in Fig. 3 by either the gate width used or the corresponding temporal spread of the ion cloud, whichever is smaller. The sharp decrease of the normalized flux for gate width⭐25 ns is an experimental artifact, arising from the imperfect square-wave gating of the ICCD. The general trends are quite ap-parent: A too-wide gate will underestimate the reactive flux
and will make the branching ratio (v
⬘
⫽3)/(v⬘
⫽2) smallerthan it should be. The most critical parameter in deciding the
gate width to be used is the relative magnitude of the gate width to the temporal spread of the smallest ring to be de-tected. An inspection of Figs. 3 and 4 indicates a ratio of
⭐1/3 as an empirical rule-of-thumb.
FIG. 2. 共Color兲 Exemplified in 共a兲–共c兲 are the raw images taken with three different gate widths for slicing. The collision energy is 4.91 kcal/mol. The results are summarized in共d兲 which shows how the signal for the correlated HF-vibration state depends on the gate width used. The arrows mark the calculated temporal spreads of the ion clouds forvHF⫽3 共↓兲 and vHF⫽2 共↓兲.
FIG. 3. The normalized fluxes into vHF⫽3 共•兲 and vHF⫽2 共䊊兲 product
states at Ec⫽4.91, 2.63, and 1.73 kcal/mol, respectively. The normalization
is performed by dividing the experimentally derived ‘‘flux’’ by either the gate width or the temporal spread, whichever is smaller. The fluxes for the three energies are not related to one another.
FIG. 4. Dependencies of the correlated product flux ratios on gate widths for
Ec⫽4.91 共•兲, 2.63 共䊊兲, and 1.73 共⌬兲 kcal/mol, respectively.
B. Correction to the imperfect time slicing
As alluded to earlier, there are cases for which the recoil velocities of some products are too slow to be time-sliced effectively. This can often occur in the excitation function measurements. For example, the concomitant formation of HF(v⫽3) is energetically closed at Ec⭐0.56 kcal/mol when
the CH3(⫽0, low N) product is probed. Thus, near the
pair-specific threshold region the rings for HF(v
⬘
⫽3) willbe quite small. Even the narrowest gate 共10 ns兲 of a typical ICCD cannot perform time slicing for them. One is essen-tially back to the conventional 2D→3D backtransformation for those共very兲 slowly recoiled products. The correction to the imperfect time slicing is analogous to the wide gate re-sults shown in Figs. 3 and 4. As is seen, the correction factor could be as large as a factor of 2 depending on the quantity, which in turn depends on the actual angular distribution. Al-ternatively, with the time-sliced velocity imaging technique, one can zoom in the image region of interest by lowering the voltages of the ion-optics setup.10 In any event, those very slowly recoiled products usually represent only a very small fraction of total reactive fluxes—thus have little impact on ICS.
C. The ‘‘true’’ excitation function
Putting all together, we can now recover the excitation function. Experimentally, for each Ectwo back-to-back im-ages were acquired—one for the narrow gate 共typically 30–50 ns兲 and the other for the wide gate 共typically 350 ns兲. To normalize the narrow gate images 共each acquired for about 3000 s兲 for different Ec’s, a set of wide gate images
共each acquired for 300 s兲 over the collision energy range was
taken independently to minimize the long-term drift prob-lems. After the density-to-flux transformation and the correc-tions to imperfect slicing of the narrow gate images, the re-sultant excitation function for the title reaction is shown in Fig. 5. For comparison, the ‘‘apparent’’ excitation function
共Fig. 1兲 is also displayed here as the dashed line. The
dra-matic change in shapes—i.e., with versus without the density-to-flux transformation—is quite striking. More than ten images were taken under the identical beam geometries to those acquired by boxcar integrator 共Fig. 1兲 over the en-ergy range of 0.8 –7.3 kcal/mol. The density-to-flux correc-tion factor was obtained for each of these images. Connect-ing these correction factors yield the density-to-flux correction function, shown as the dotted line in Fig. 5. Ap-plying this correction function to the ‘‘apparent’’ (Ec)
gives the corrected boxcar data, displayed as the solid line in Fig. 5. It is gratifying to see that it is entirely consistent with the true(Ec) obtained by the imaging approach.
D. State-resolved, pair-correlated„Ec…
and branching ratios
Exemplified by Figs. 3 and 4 at three energies, Fig. 6 shows how the state-specific (Ec) for CH3(⫽0) is
de-composed into the pair-correlated excitation functions 关Fig. 6共a兲兴 and how the correlated vibrational branching varies with the collision energy 关Fig. 6共b兲兴. Figure 6 represents the first correlated quantity that has ever been measured over a wide range of collision energies in such detail for any chemi-cal reaction.13 The threshold for the formation of HF(v
⫽3), in concomitance with CH3(⫽0), is ⬃0.56 kcal/mol.
At low collision energies, HF(v⫽2) dominates. But, once
the HF(v⫽3) channel opens up, its cross section rises
rap-idly and becomes the favored channel. At even higher ener-gies, the cross sections for HF(v⫽3) declines at a faster rate
thanv⫽2, and the two vibrational states become comparable
with slight preference for HF (v⫽2). As a result, the peak of
(Ec) shown in Fig. 5 arises predominantly from the behav-ior of HF(v⫽3). The formation of the more exoergic
chan-nel, HF(v⫽1), is always small even at the highest collision
energy of this study. Since there are practically only two state-correlated channels, the branching ratios of HF(v⫽3)
and HF(v⫽2) display an almost perfect anticorrelation with
collision energies as seen in Fig. 6共b兲.
We note in passing that the results shown in Fig. 6 are not inconsistent with the previous bulb experiments,15–17for
FIG. 5. The true excitation function obtained by the imaging approach. The closed circles were taken with the 5% F2/Ne beam, and the open circles
were with the 5% F2/He beam. The error bars are the results from several
independent measurements including the use of two different F-atom beams. The dashed line is the apparent excitation function taken from Fig. 1, and the dotted line gives the density-to-flux correction function共see the text for details兲. The solid line represented the ‘‘corrected’’ apparent excitation func-tion.
FIG. 6. In共a兲, the state-resolved, pair-correlated excitation functions of the title reaction are shown. Displayed in共b兲 are their branching ratios as a function of the collision energy.
120 J. Chem. Phys., Vol. 120, No. 1, 1 January 2004 Shiuet al.
which HF(v⫽2) was found to be the most populated state.
Under the thermal conditions, the collision energy is low and with a wider distribution, thus the results will be dominated by the low energy collisions.
IV. DISCUSSION AND CONCLUSION
The appearance of the true excitation function共Fig. 5兲 deserves some comments. The excitation function displays a fast rise near the threshold region and reaches a maximum, followed by a rapid decline with further increase in collision energy. Similar dependence of the cross section for the reac-tion K⫹CH3I→KI⫹CH3 was reported by Gersh and
Bein-stein about 30 years ago,18 so as for a number of other el-ementary reactions later.2,19–21Several dynamical models of hard-sphere variants have been proposed to rationalize the results, particularly on the post-maximum decline.2,21 It is difficult to judge the validity of those empirical models be-cause of the lack of reliable potential energy surface and more rigorous dynamic treatments. Consider two textbook examples:22 the venerable line-of-center model of a hard sphere reaction, and a barrierless reaction governed by an attractive potential. The observed excitation function for F
⫹CH4 exhibits the characteristic of both models—
resembling the former model for Ec⭐2.5 kcal/mol and the
latter one at higher energy. This seems to suggest a potential having a 共early兲 barrier of ⬃0.5 kcal/mol to reaction and an attractive potential well after the transition state. The former is in accordance with the activation energy of 0.43 kcal/mol from the most recent thermal kinetics measurement.23As to the latter, it remains to be seen if the hydrogen bonding24of F–H¯CH3 in the exit channel alone is sufficient to provide
the necessary attractive potential. The shapes of the state-correlated excitation function shown in Fig. 6共a兲 qualita-tively support the proposed scenario. From the vibrationally adiabatic viewpoint, the reaction cross section of the least exoergic channel,vHF⫽3, is expected to be influenced more
by the attractive well in the post-threshold region than the
vHF⫽2 channel. Indeed, the pair-correlation excitation
func-tion for vHF⫽3 displays a significantly faster decline after
the peak.
Of course, it will be too unrealistic at this stage to be-lieve that the dynamics of excitation function is governed by the proposed hybrid model. Here we merely wish to point out the subtle role the attractive interaction in the post-barrier region might play for an earlier barrier reaction. The corre-lated vibrational branching ratios shown in Fig. 6 exhibit a complicated dependency on collision energies. This quantity in general depends, among other factors such as the geometry/motion of the transition state etc.,12,13 sensitively on how steep the repulsive energy release is when the paired products depart. Further information on the potential energy surface and theoretical efforts is needed to quantitatively ac-count for the results of Figs. 5 and 6.
We have elucidated above in detail how the density-to-flux transformation can alter the excitation function of the title reaction in a dramatic way. We have also investigated in practical ways how to properly choose the gate width in a time-sliced velocity imaging experiment, and how to
esti-mate the correction factors should the circumstances force one back to the 2D image mode. A vital question remains to be addressed: Why does the previous approach outlined in Sec. I, which apparently works reasonably well for many other systems, fail so badly for the present reaction?
There is no doubt that the answer to the question is com-plicated. In the end, we believe that to a large extent it has to do with the highly quantized nature of the DCS,
d2 /dud(cos), of the present reaction. The title reaction is very exoergic, ⌬H00⫽⫺31.85 kcal/mol. Energetically, nu-merous rovibrational states of HF coproducts can be formed. The kinematic and dynamic constraints, however, channel most of products into only a small subset of available prod-uct states. Moreover, the most populated HF-prodprod-uct vibra-tional states are the two least exoergic ones, which results in a highly biased probe in the density mode because of the large disparities of the u2 term in going from the probed
density to the reactive flux in the c.m. velocity space. The last point is precisely the dominant reason for the appearance of the density-to-flux correction function 共the dotted line in Fig. 5兲 that underlies the dramatic changes seen from Fig. 1 to Fig. 5. The highly anisotropic angular distributions of the two rings, as revealed from images shown in Fig. 2, com-pound the effects further.
It is a bit frustrating to find out that in order to obtain the dynamical information about ICS for a scattering process, one first needs to know about the more detailed DCS. Nev-ertheless, the take-home lesson from this study is that it pays off to examine the DCS data, at least at a few representative collision energies, to ensure the obtained ICS results are not distorted too far from the truth.
ACKNOWLEDGMENTS
This work was supported by the National Science Coun-cil of Taiwan关NSC 2119-M-001-011 共K.L.兲 and NSC 91-2113-M-001-024共J.J.L.兲兴.
1K. Liu, Int. Rev. Phys. Chem. 20, 189共2001兲. 2
A. Gonzalez Urena, J. Phys. Chem. 96, 8212共1992兲; Adv. Chem. Phys.
66, 213共1987兲.
3K. Liu, R. G. MacDonald, and A. F. Wagner, Int. Rev. Phys. Chem. 9, 187
共1990兲.
4D. M. Sonnenfroh and K. Liu, Chem. Phys. Lett. 176, 183共1991兲. 5
W. D. Geppert, D. Reignier, T. Stoecklin, C. Naulin, M. Costes, D. Chastaing, S. D. Le Picard, I. R. Sims, and I. W. M. Smith, Phys. Chem. Chem. Phys. 2, 2873共2000兲.
6C. Naulin and M. Costes, Chem. Phys. Lett. 310, 231共1999兲.
7W. D. Geppert, C. Naulin, and M. Costes, Chem. Phys. Lett. 333, 51
共2001兲; 364, 121 共2002兲.
8J. Zhou, J. J. Lin, W. Shiu, S.-C. Pu, and K. Liu, J. Chem. Phys. 119, 2538
共2003兲.
9F. Dong, S.-H. Lee, and K. Liu, J. Chem. Phys. 113, 3633共2000兲. 10
J. J. Lin, J. Zhou, W. Shiu, and K. Liu, Rev. Sci. Instrum. 74, 2495共2003兲.
11
J. W. Hudgens, T. G. DiGiuseppe, and M. C. Lin, J. Chem. Phys. 79, 571
共1983兲.
12J. J. Lin, J. Zhou, W. Shiu, and K. Liu, Science 300, 966共2003兲. 13J. Zhou, J. J. Lin, W. Shiu, and K. Liu, J. Chem. Phys. 119, 4997共2003兲. 14
Y.-T. Hsu, K. Liu, L. A. Pederson, and G. C. Schatz, J. Chem. Phys. 111, 7921共1999兲.
15W. W. Harper, S. A. Nizkorodov, and D. J. Nesbitt, J. Chem. Phys. 113,
3670共2000兲.
16
M. A. Nazar and J. C. Polanyi, Chem. Phys. 55, 299共1981兲.
17
M. A. Wickramaaratchi, D. W. Setser, H. Hildebrandt, B. Korbitzer, and H. Heydtmann, Chem. Phys. 94, 109共1985兲.
18M. E. Gersh and R. B. Beinstein, J. Chem. Phys. 55, 4661共1971兲. 19J. M. L’Hermite, G. Ragmat, and R. Vetter, J. Chem. Phys. 95, 3347
共1991兲.
20
A. Gupta, D. S. Perry, and R. N. Zare, J. Chem. Phys. 72, 6237共1980兲.
21V. Saez Rabanos, E. Verdasco, V. J. Herrero, and A. Gonzalez Urena, J.
Chem. Phys. 81, 5725共1984兲.
22R. D. Levine and R. B. Bernstein, Molecular Reaction Dynamics and
Chemical Reactivity共Oxford University Press, Oxford, 1987兲, pp. 58–64.
23A. Persky, J. Phys. Chem. 100, 689共1996兲; Chem. Phys. Lett. 298, 390
共1998兲.
24B.-Q. Wang, Z.-R. Li, D. Wu, X.-Y. Hao, R.-J. Li, and C.-C. Sun, Chem.
Phys. Lett. 375, 91共2003兲.
122 J. Chem. Phys., Vol. 120, No. 1, 1 January 2004 Shiuet al.