Received 9 March 1998; revised 1 December 1998; accepted 7 December 1998
ABSTRACT: The 3-amino-9-ethyl carbazole (AEC)/Dispersed Orange 3 (DO3)/diglycidyl 1,2 cyclohexanedicarboxylate (DCD) main chain copolymers are synthesized and stud-ied on their photorefractive (PR), photoconductive, and holographic characteristics. They are good hologram recording media because not only the stored hologram exhibits excellent fringe contrast with the resolution at about 20mm, but also the image can be stored, erased, and overwritten. The UV/Vis spectra shows that AEC segments may form charge transfer complexes with either DO3 segments or TNF sensitizers. By incorporating the sensitizer or increasing the charge transfer component concentration, the grating growth rate can be speeded up. Applying an electric field on the polymer film containing no sensitizer helps to elevate the grating growth speed, but it shows little influence on the grating growth speed of the films with sensitizers. More nonlinear optical (NLO) segments in the copolymer result in higher diffraction efficiency. The dark decay of the film depends on the dark conductivity. Incorporating sensitizers or more charge transport segments leads to more dark decay because of increasing dark conductivity. The dark decay of the PR properties at elevated temperature can also be evaluated by the thermal stimulated discharge current (TSDC) spectroscopy technique. © 1999 John Wiley & Sons, Inc. J Polym Sci B: Polym Phys 37: 1057–1068, 1999
Keywords: holographic recording; photorefractive; sensitizer; polymer; resolution; thermal stimulated discharge current (TSDC)
INTRODUCTION
Progresses in preparing and elevating the prop-erties of organic PR materials have been achieved since they are discovered.1 In general, there are three approaches to prepare the organic PR ma-terials including nonlinear optical polymer hosts doped with photoconducting molecules,2–9 photo-conducting polymer hosts doped with nonlinear
optical molecules,10 –16 and fully functionalized polymers in which the photoconducting moiety and the nonlinear optical chromophore were at-tached onto the polymer chains.17–21A large por-tion of PR polymers reported are made of a pho-toconducting polymer matrix such as polyvinyl carbazole (PVK) doped with NLO mole-cules.12,13,22–27Several sensitizers have also been used in the PVK-based PR polymer. These sensi-tizers can form a charge transfer complex with PVK and are able to improve the PR proper-ties.12,22In this paper, TNF is added into the film as the sensitizer. It is well known that TNF can
Correspondence to: W. T. Whang
Journal of Polymer Science: Part B: Polymer Physics, Vol. 37, 1057–1068 (1999) © 1999 John Wiley & Sons, Inc. CCC 0887-6266/99/111057-12
form charge transfer (CT) complexes with PVK. Since AEC possesses an additional amino group on the phenyl ring comparing with the repeating unit of PVK, it is necessary to verify whether TNF can form CT complexes with AEC or not. If the ionization potential of the donor is sufficiently low and/or the electron affinity is acceptably high, the lowest-energy CT band will not overlap strongly with those of the local transition and, hence, is resolvable. UV/Vis spectroscopy can be used to characterize the charge transfer (CT) process be-tween donor and acceptor fragments of the charge transfer complexes.28 –35 The spectroscopic tech-nique is used as a tool to learn about whether the CT complexes between AEC and TNF exists or not. The influences of relative component concen-trations, the applied electric field, and sensitizers on the PR response time and the diffraction effi-ciency are also studied.
PR polymers have been developed for applica-tions such as optical computing,36optical correla-tor,37data38 –39or image storage.40In this paper, hologram images are written and read in the fully functionalized polymer to study the resolution of the recorded hologram In addition to the resolu-tion, other two properties are necessary for a good recording media. First of all, for long-term data storage, the dark decay should be as low as pos-sible to extend the storage life. After a hologram image is recorded, the PR medium is kept in dark condition and the diffraction signal may decay as slow as possible. Secondly, for an erasable me-dium, the polymeric materials should be able to be repeatedly stored, erased, and overwritten the information on the same position of the media. Then, the stored data can be renewed and the media can be repeatedly recorded many times. The PR polymers are stored, erased, and over-written the images to investigated the erasure and update capability of the DCD/AEC/DO3 film in this paper. In this study, we try to investigate the relationships among the dark current, the sensitizer, and the dark decay behaviors at the room temperature. Dark decay behaviors at ele-vated temperatures are also studied with the thermal stimulated discharge current (TSDC) measurement.
EXPERIMENTAL
Materials and Film Preparation
AEC, DO3, and DCD are supplied by the Aldrich Chemical Co. Ltd. The charge generation moiety
AEC, the NLO azo dye DO3, and the diepoxy comonomer DCD are dissolved completely in cy-clohexanone in a three-necked round-bottomed flask at room temperature. The reaction mixture is refluxed at 105°C under nitrogen atmosphere for 12 h. Then the solution is cooled to room tem-perature and added with hexane. The polymer precipitates, it is filtered and then vacuum dried. The dried polymer is grounded into fine powder. The chemical structure of the polymer is illus-trated in Figure 1. The Mn and Mw of the polymer (DCD/AEC/DO35 2 : 1 : 1) measured by the GPC are 10140 and 32760, respectively. The polymer is dissolved in cyclohexanone and spin coated on the ITO side of an ITO glass to form a thin film. After the films are vacuum dried at 105°C, two result-ing films of the same composition are hot pressed in the vacuum oven and the polymer is sand-wiched between two ITO layers.
Measurements
In the degenerate four-wave mixing (FWM) ex-periment, two mutually coherent s-polarized writ-ing beams are spatially overlapped in the polymer film with an angle (20°) between them and form a diffraction grating. A p-polarized reading beam is counterpropagating to one of the writing beams at the Bragg matching condition. A green beam la-ser (l 5 514 nm) and a red beam laser (l 5 632.8 nm) are applied as the writing and reading beam, respectively.
In the holographic recording experiment, the image is written and read by a green light laser (l 5 514 nm). During holographic recording, the beam is expanded by a beam expander and then split into two writing beams, beam 1 and beam 2, by a beam splitter. Beam 1 passed through the center part of an image chart and then the pat-tern is imaged onto the photorefractive polymer film. The average power density measured at the polymer plane is about 14 mW/cm2. Once beam 1 is cut, the hologram image can be read by beam 2. The restored image is detected by a CCD camera. The hologram images are recorded without apply-ing electric field, and the recordapply-ing time is 30 s. The recorded image can be erased if the film is continuously exposed by beam 2. It can be over-written by replacing a new image chart and being exposed under beam 1 and beam 2. The experi-mental setup is demonstrated in Figure 2.
All TSDC measurements are obtained with a Solomat TSC/RMA 9100 spectrometer. To obtain the TSDC spectra, all films are polarized by a
constant static electric field (E5 100 V/mm) at Tp for 5 min. Tpis a temperature with 5–10°C higher than the glass transition temperature. The films are then quenched down to a freezing tempera-ture Tf(2100°C) to freeze the dipole orientation under the electric field for 5 min. After the field is removed, the depolarization current can be mea-sured by heating at 7°C/min from Tfto final tem-perature Te (Te ^ Tp). The DSC measurements are achieved with a Dupont 2910 Thermal Anal-ysis System and are performed from room
tem-perature to the final temtem-perature at a heating rate 10°C/min. The UV/Vis spectra are obtained with a Hitachi-U2000 spectrometer. The IR tra are measured with a Nicolet Protege 460 spec-trometer.
For photoconductivity measurement, gold is vapor-deposited on the PR polymer film spin-coated onto the indium-tin oxide (ITO) glasses. A green beam laser (l 5 514 nm) is chosen as the light source to measure the photoconductivity of the polymer under the fixed applied field (300V).
Figure 1. The chemical structure of (a) DCD, (b) AEC, (c) DO3, (d) TNF, and (e) DCD/AEC/DO3.
The dark conductivity is measured without light exposure.
RESULTS AND DISCUSSION Film Characterization
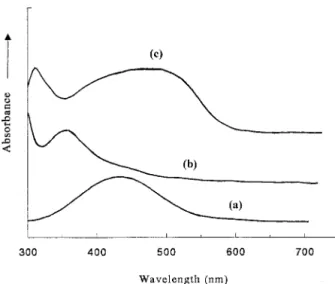
The UV/Vis absorption spectra of monomers and the polymer are demonstrated in Figure 3. The typical absorption peaks of AEC and DO3 mono-mers are at 350 and 435 nm, respectively. The DCD/AEC/DO3 copolymer film shows the absorp-tion peak at about 495 nm due to the absorpabsorp-tion of the azo chromophore DO3, and the other peak at 320 nm results from the carbazole unit of AEC. A distinct red shift of the absorption peak of the azo
moiety DO3 and a blue shift peak related to the absorption peak of AEC moiety are observed. It probably indicates that there are charge-transfer complexes between DO3 and AEC segments. UV/ Vis spectra of the model compounds are reported by us elsewhere41 to study the possible mecha-nism of the formation of the complexes and the reasons of the peak shift. It reveals that electrons releasing from the AEC moieties to the DO3 moi-eties leads to the formation of charge-transfer complexes and the corresponding red and blue shift.
Figure 4(a) and (b) show the UV/Vis spectra of the AEC/cyclohexanone solution with and with-out TNF, respectively. By subtracting the spec-trum of 4(b) from 4(a), a strong band at 390 nm is left in Figure 4(c). It may be due to the intermo-lecular CT between AEC and TNF. It is well known that PVK and TNF can form an intermo-lecular CT complex in which PVK acts as an elec-tron donor and TNF as an elecelec-tron acceptor. The
Figure 2. The experimental setup used for the holographic recording and readout.
Figure 3. The UV/Vis absorption spectra of (a) DO3 in cyclohexanone, (b) AEC in cyclohexanone, and (c) DCD/AEC/DO3 film.
Figure 4. The UV/Vis absorption spectra of (a) AEC and TNF in cyclohexanone, (b) AEC in cyclohexanone, and (c) the difference spectrum of (a) and (b).
chemical structure of AEC is similar to the re-peating unit of PVK except an additional amine group on the carbazole unit of AEC. The addi-tional amine group makes AEC a better electron donor. The possibility of intermolecular CT in the DCD/AEC/DO3 polymer film depends on the local conformations of the polymer chains and their ability to form well-packed electron donor/accep-tor pairs with TNF. However, from the viewpoint of conformations, the additional amine group in AEC may increase the tortional angle and thereby decreases the p overlap with TNF and decreases the amount of charge transfer. This may account for the poorer photoconductive re-sponse of the DCD/AEC/DO3 polymer film (Fig. 7) than that of the PVK-based polymer.
The FTIR spectra of the polymers are shown in Figure 5. The broad absorption of the hydroxyl group between 3200 and 3400 cm21and the CN absorption of tertiary amine at 1341 cm21are due to the AEC and DO3 groups being attached to the polymer chain by reacting the amine groups with the diepoxy comonomer. In addition, the NAN stretching vibration at 1438 cm21 and the NO2 vibration absorption at 1513 cm21are due to the DO3 moiety. The CAO absorption band at 1732 cm21is observed due to the DCD monomer.
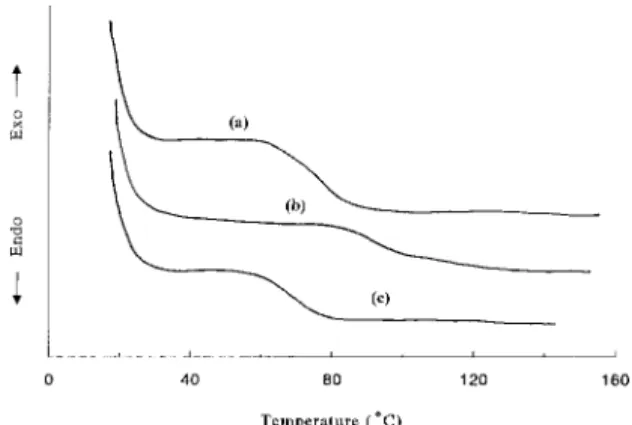
Differential scanning calorimeter (DSC) dia-grams of different PR polymers are illustrated in Figure 6. The glass transition temperatures (Tg) of films with the composition (DCD : AEC : DO3) of 2 : 0.5 : 1.5 and 2 : 1 : 1 are 63°C and 72°C, respectively. Since AEC is a more bulky side group than DO3, the Tg of the film gets higher when more AEC is incorporated. The Tg of the DCD/AEC/DO3 (2 : 0.5 : 1.5) film with 5 wt.% TNF is 61°C.
Photoconductive Properties
Photocurrents of the DCD/AEC/DO3 films with different component molar ratio and sensitizer addition as a function of exposure time are illus-trated in Figure 7. The DCD/AEC/DO3 (2 : 0.5 : 1.5) film with 5 wt.% sensitizers exhibits faster photoconductive response than the film without TNF. It reaches a saturation value after being exposed for 58 s under an external electric field of 20 V/mm. There is an initial induced period, then followed by a sharp increase in the photocurrent. Because of the low concentration of the charge transporting segments, the charge transporting segments of the DCD/AEC/DO3 (2 : 0.5 : 1.5) film
Figure 5. The FTIR spectrum of the DCD/AEC/DO3 film.
Figure 6. Differential scanning calorimetry (DSC) curves of (a) the DCD/AEC/DO3 (2 : 0.5 : 1.5) film, (b) the DCD/AEC/DO3 (211) film, and (c) the DCD/AEC/ DO3 (2 : 0.5 : 1.5) film with 5 wt.% TNF.
Figure 7. Photocurrents of the DCD/AEC/DO3 (2 : 0.5 : 1.5) film (a) without TNF, (b) with 5 wt.% TNF, (c) with 10 wt.% TNF, and the DCD/AEC/DO3 (211) film (d) without TNF, (e) with 5 wt.% TNF as a function of exposure time.
are separated far apart from each other if no sensitizers are incorporated. Once the film is ex-posed by the laser, the initial photogenerated charge will be trapped by the neighboring traps. That is why the photocurrent is not observed at the beginning of the laser illumination. The traps are gradually filled as the film is kept on illumi-nation. The filled traps will no longer trap an-other carrier if the detrapping of the trapped car-riers is negligible. After a certain amount of traps are filled, the photogenerated charge can be transported and the photocurrent can be de-tected. The induction period is the time required for filling the traps before the current flow can be detected. The induction time is about 40 s. Adding TNF helps to form a charge transport network inside the film and decrease the induction period. The induction period decreases as more TNF (10 wt.%) is incorporated. However, adding too much sensitizer should be avoided considering the prob-lems such as crystallization of the dopants. Com-paring Figure 7(a) with Figure 7(d), we find that the film with the ratio 2 : 1 : 1 exhibits higher photocurrent and shorter induction time. Since more AEC carbazole groups shorten their separa-tion distance, and the local vibrasepara-tion and rotasepara-tion of the charge transporting segments makes the hopping of the carriers possible under the glass transition temperature, the easier hopping of the carriers may account for the increase in the pho-toconductivity and decrease in the induction time. Comparing the DCD/AEC/DO3 (2 : 0.5 : 1.5) film with the DCD/AEC/DO3 (2 : 1 : 1) film with and without 5 wt.% sensitizer, the contribution of add-ing the sensitizer to the photoconductive response of the former is more significant than that of the latter. Since the former without sensitizer exhib-its lower photoconductivity, TNF plays a more important role on the photoconductivity in the sensitizer-incorporated film.
Holographic Recording
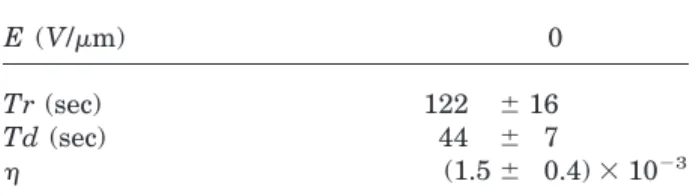
Figure 8 shows the time dependence of the FWM diffracted signal of films without sensitizers un-der different external electric field. The rise time (Tr) is defined as the time needed for the dif-fracted signal to rise from 10% to 90% of the saturation value during writing, and the decay time (Td) is defined as the time required for the diffracted signal to drop from 90% to 10% of the saturation value during erasure. The electric field dependence of Tr, Td, and the diffraction effi-ciency of DCD/AEC/DO3 film is illustrated in
Table I. When no electric field is applied, the photogenerated charge can be separated and transported by the diffusion process due to the gradient of carrier density. Not only is the grating growth rate slow but the diffraction efficiency is low. After an external electric field is applied, photogenerated charges can be separated and transported by both the diffusion and the drift process. Both the grating growth rate becomes faster and the diffraction efficiency gets a little bit higher when a larger electric field is applied.
Figure 9 shows the time dependence of the FWM diffracted signal of films with sensitizers under different external electric field. Once the sensitizer is added, the grating growth rate be-comes faster under zero electric field. However, applying an electric field on the film shows little influence on the grating growth rate and the dif-fraction efficiency as shown in Table II. It can be interpreted by the changes in the photoconductiv-ity of the films with or without sensitizers (shown in Figure 7). Such a little dependence between the applied electric field and PR properties may re-sult from less effective applied electric field across the film because of increasing conductivity after sensitizer incorporation. The electric field depen-dence of Tr, Td, and the diffraction efficiency of DCD/AEC/DO3 film with sensitizers are illus-trated in Table II. By changing the composition, it is found that more charge transport segments lead to a faster PR response, but a lower diffrac-tion efficiency as shown in Table III.
A resolution test chart is utilized to evaluate the resolution of the recorded hologram images in the PR film. The chart is correspondent to the USAF 1951 resolution target standard except the group number. For example, the fifth group in this test chart is equal to the third group of the USAF resolution target standard, and the forth group in this test chart is equal to the second group of the USAF resolution target standard, etc. Figure 10(a) shows the image of the original resolution chart transmitting through a filter. Figure 10(b) and (c) illustrate a reconstructed image of the resolution chart that is written in the DCD/AEC/DO3 film with or without sensitizers, respectively. In Figure 10(a), the fourth element of the fifth group is distinguishable. The corre-sponding element is perceptible in the restored image, as shown in Figure 10(b). Since the image demagnification in our optical system is two, the resolution of the recorded hologram is about 20mm. Images are stored, erased, and overwritten on the same spot of the DCD/AEC/DO3 film to
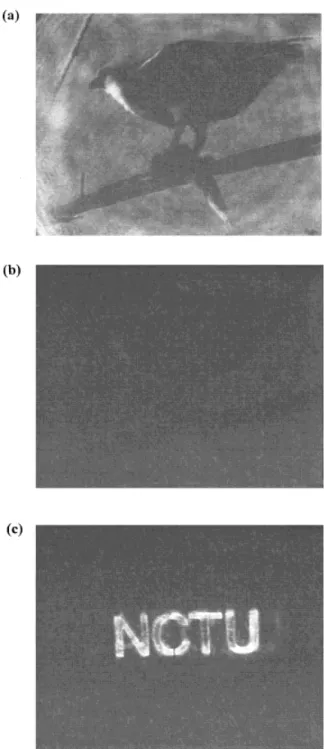
inves-tigate the erasure and update capability. In Fig-ure 11(a), by replacing the test chart with a mask, a picture of a hawk staying on a branch with a fish in its claw is recorded in the film to demon-strate its performance in the image storage. A clear image is observed. The recorded image can be deleted when beam 1 is cut and the spot is illuminated by beam 2. The erased image is illus-trated in Figure 11(b). It demonstrates that the stored image can be completely deleted. Then, a new mask with the letters N, C, T, and U is used
to store a new image. The updated image is illus-trated in Figure 11(c). It shows that the image can be replaced on the same spot of the film. This polymer can be used as a good hologram recording media since the images can be stored, erased, and updated repeatedly.
Observation of asymmetric two-beam coupling is shown in Figure 12. The coupling gain is small because of poor transmission of the green light through the film resulting from strong absorption at the wavelength 514 nm. Samples have been
Figure 8. The time dependence of the FWM diffracted signals of films without sensitizers measured under (a) no electric field, (b) 4V/mm, (c) 10V/mm, and (d) 20V/mm.
Table I. The Electric Field (E) Dependence of the Rise Time (Tr), the Decay Time (Td), and the Diffraction Efficiency (h) of the DCD/AEC/DO3 (2 : 0.5 : 1.5) Films without Sensitizers
E (V/mm) 0 4 10 20
Tr (sec) 150 6 22 54 6 5 50 6 4 42 6 4
Td (sec) 48 6 8 42 6 4 35 6 6 34 6 4
previously irradiated to produce deep trap sites in the polymer that can enhance the modulated space charge field. It is a process that refers to the optical trap activation. An increase in the inten-sity of beam 1 is observed after beam 2 is blocked. It is complemented by an approximately equal decrease in the intensity of beam 2 when beam 1 is blocked.
The dark conductivities of the DCD/AEC/DO3 films with different component molar ratio and with sensitizer additions are shown in Figure 13.
Comparing Figure 13(a) and (b), the dark conduc-tivity increases as the content of charge transport segment AEC gets higher, because increasing the content of charge transport segments decreases the distance between two AEC moieties and helps the formation of a charge transport pathway within the copolymer. Figure 13(c) illustrates that the sensitizers bring about a further promo-tion in the dark conductivity.
In this study, changing relative compositions of the films and adding sensitizers will lead to
dif-Figure 9. The time dependence of the FWM diffracted signals of films with 5 wt.% TNF sensitizers measured under (a) no electric field, (b) 4V/mm, (c) 10V/mm, and (d) 20V/mm.
Table II. The Electric Field (E) Dependence of the Rise Time (Tr), the Decay Time (Td), and the Diffraction Efficiency (h) of the DCD/AEC/DO3 (2 : 0.5 : 1.5) Films with 5 wt. % TNF
E (V/mm) 0 4 10 20
Tr (sec) 65 6 16 40 6 14 35 6 16 27 6 6
Td (sec) 26 6 7 20 6 4 20 6 8 19 6 2
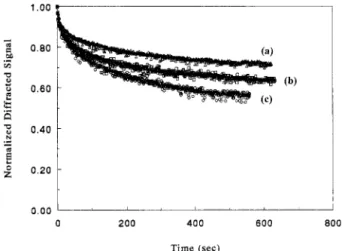
dark decay of PR gratings are investigated. The dark decay of PR gratings in DCD/AEC/DO3 poly-mers with different component molar ratio and with sensitizer additions are demonstrated in Figure 14. The normalized PR signal of DCD/ AEC/DO3 (2 : 0.5 : 1.5) film with 5 wt.% TNF drops to 56 in 10 min of the original value during the dark decay process which is much lower than other two films containing no TNF. The final dif-fracted signal of DCD/AEC/DO3 (2 : 0.5 : 1.5) film without TNF drops to 72 of the original value in 10 min during the dark decay process. The final diffracted signal of DCD/AEC/DO3 (2 : 1 : 1) film without TNF drops to 62 of the original in 10 min. That is, more AEC content leads to fast dark decay. As the content of charge transport segment AEC increases, the equilibrium normalized final diffracted signal gets lower.
Thermal Stability
Figure 15 shows the TSDC curves of different PR films. TSDC curve of DCD/AEC/DO3 (20.51.5) film in Figure 15(a) shows a peak at 52°C. It is reasonable to attribute this to the randomization of the oriented dipole moments of NLO chro-mophores. The rising current at the temperature higher than 64°C is due to the charge releases from the segmental molecular motion at Tg. The corresponding Tgmeasured by DSC is 64°C (Fig. 6) . Since NLO segments are bonded onto the fully functionalized PR polymer and the orientational relaxation of the NLO chromophores leads to the decay of the PR diffraction signal, TSDC tech-nique can be used to evaluate the decay of the PR signal at elevated temperature. In the FWM ex-periment, the NLO chromophores are poled by the space charge field during the writing period, the disorientation of the chromophores results in the decay of the grating. A similar process hap-pens in the TSDC measurement. The dipole mo-ment of the film is poled under a constant applied
Figure 10. The image of (a) the original resolution chart transmitting through a filter, a reconstructed image of the resolution chart written in the DCD/AEC/ DO3 film (b) with, and (c) without TNF sensitizers.
content gets higher [DCD/AEC/DO3 ratio 2 : 1 : 1, Fig. 15(b)], it also shows two peaks, one at 55°C and the other starting rising at 70°C. Both peaks occur at higher temperature than the correspond-ing peaks in Figure 15(a), due to more AEC con-tent.
CONCLUSIONS
Although AEC possesses an additional amino group on the phenyl ring of a carbazole unit com-pared with the repeating unit of PVK, the UV/Vis spectra show that it can form a CT complex with TNF. The PR copolymer (DCD/AEC/DO3) exhib-its a poorer photoconductive response than PVK. This may be due to longer distances between the AEC moieties and the additional amine group in AEC resulting in the increase of the tortional angle and the decrease of thep overlap with TNF. The PR properties of the copolymers show good PR characteristics even under zero electric field, but the response speed is slower than those under
Figure 11. (a) A reconstructed image of the picture of a hawk staying on a branch with a fish in its claw, (b) the erased image, and (c) the overwritten image of the letters N, C, T, and U.
Figure 12. Asymmetric two beam coupling of the DCD/AEC/DO3 (2 : 1 : 1) film.
Figure 13. The dark conductivities of (a) the DCD/ AEC/DO3 (2 : 0.5 : 1.5) film, (b) the DCD/AEC/DO3 (2 : 1 : 1) film, and (c) the DCD/AEC/DO3 (2 : 0.5 : 1.5) film with 5 wt.% TNF.
due to sensitizer addition of the former is more than the latter. When an electric field is applied on the films without sensitizers, the grating growth rate becomes faster and the diffraction efficiency gets higher. However, such promotion in the diffraction efficiency and response speed gets much less significant when sensitizers are added into the film. It is attributed to the eleva-tion in the photoconductivity and the lowering of the effective electric field after sensitizer addi-tion. The potential application of the copolymers in the holographic information storage is also demonstrated as an erasable medium. The holo-gram image can be written and read in the copol-ymer with a low power laser without applying an external electric field. The resolution of the re-corded hologram is about 20 mm and the image shows good fringe contrast. It is also demon-strated that the images can be stored, erased, and then overwritten. It indicates that the stored im-ages can be updated. The dark conductivity plays an important role in the dark decay of fully
func-tionalized PR polymer. Either no sensitizers or less AEC content leads to less dark decay and higher equilibrium normalized diffraction signal in the dark decay process. The TSDC technique is a good tool to evaluate the dark decay of the PR signal at elevated temperatures because it is sen-sitive to the disorientation of the NLO chro-mophores.
The authors acknowledge the financial support from the National Science Council of R.O.C. under grant No. NSC 87-2216-E009-002.
REFERENCES AND NOTES
1. Ducharme, S.; Scott, J. C.; Twieg, R. J.; Moerner, W. E. Phys Rev Lett 1991, 66, 1846.
2. Zhang, Y.; Spencer, C. A.; Ghosal, S.; Casstevens, M. K. Appl Phys Lett, 1994, 64, 1908.
3. Eich, M.; Reck, B.; Yoon, D. Y.; Willson, C. G.; Bjorklund, G. C. J Appl Phys 1989, 66, 3241. 4. Schildkraut, J. S. Appl Phys Lett, 1991, 58, 340. 5. Silence, S. M.; Walsh, C. A.; Scott, J. C.; Matray,
T. J.; Twieg, R. J.; Hacke, F.; Bjorklund, G. C.; Moerner, W. E. Opt Lett 1992 17, 1107.
6. Cui, Y.; Zhang, Y.; Prased, P. N.; Schildkraut, J. S.; Williams, D. J. Appl Phys Lett 1992, 61, 2132.
Figure 14. The dark decay of PR gratings in (a) the DCD/AEC/DO3 (2 : 0.5 : 1.5) film, (b) the DCD/AEC/ DO3 (211) film, and (c) the DCD/AEC/DO3 (2 : 0.5 : 1.5) film with 5 wt.% TNF.
Figure 15. TSDC curves of (a) the DCD/AEC/DO3 (2 : 0.5 : 1.5) film and (b) the DCD/AEC/DO3 (2 : 1 : 1) film.
7. Silence, S. M.; Walsh, C. A.; Scott, J. C.; Moerner, W. E. Appl Phys Lett 1992, 61, 2967.
8. Jungbauer. D.; Teraoka, I.; Yoon, D. Y.; Reck, B.; Swalen, J. D.; Twieg, R.; Willson, C. G. J Appl Phys 1991, 69, 8011.
9. Ducharme, S.; Jones, B.; Takacs, J. M.; Zhang, L. Opt Lett 1993, 18, 152.
10. Obrzut, J.; Obrzut, M. J.; Karasz, F. E. Synth Ma-ter 1989, 29, E103.
11. Gelsen, O. M.; Bradley, D. D. C.; Murata, H.; Tsu-tsui, T.; Saito, S.; Ruhe, J.; Wegner, G. Synth Met 1991, 41, 875.
12. Zhang, Y.; Cui, Y.; Prased, P. N. Phys Rev B 1992, 46, 9900.
13. Donckers, M. C. J. M.; Silence, S. M.; Walsh, C. A.; Hache, F.; Burland, D. M.; Moerner, W. E.; Twieg, R. J. Opt Lett 1993, 18, 1044.
14. Chang, L. T.; Tam, W.; Marder, S. R.; Stiegman, A. E.; Rikken, G.; Spangler, C. W. J Phys Chem 1991, 95, 10643.
15. Boyd, G. T.; Francis, C. V.; Trend, J. E.; Ender, D. A. J Opt Soc Am B 1991, 8, 887.
16. Hampsch, H. L.; Yang, J.; Wong, G. K.; Torkelson, J. M. Polym Commun 1989, 30, 40.
17. Tamura, K.; Padias, A. B.; Hall, H. K., Jr.; Pey-ghambarian, N. Appl Phys Lett 1992, 60, 1803. 18. Kippelen, B.; Tamura, K.; Peyghambarian, N.;
Pa-dias, A. B.; Hall, H. K., Jr. J Appl Phys 1993, 74, 3617.
19. Li, J.; Lee, Y. J.; Yang, Y.; Kumar, J.; Tripathy, S. K. Appl Phys B 1991, 53, 279.
20. Li, J.; Jeng, R. J.; Kamath, M.; Kumar, J.; Tripa-thy, S. K. Mater Res Soc Symp Proc 1992, 277, 160. 21. Sansome, M. J.; Teng, C. C.; East, A. J.; Kwiatek,
M. S. Opt Lett 1993, 18, 1400.
22. Silence, S. M.; Hache, F.; Donckers, M.; Walsh, C. A.; Burland, D. M.; Bjorklund, G. C.; Twieg, R. J.; Moerner, W. E. Proc Soc Photo Opt Instr Eng 1993, 1852, 253.
23. Silence, S. M.; Donckers, M. C. J. M.; Walsh, C. A.; Burland, D. M.; Twieg, R. J.; Moerner, W. E. Appl Opt 1994, 33, 2218.
24. Zhang, Y.; Spencer, C. A.; Ghosal, S.; Casstevens, M. K.; Burzynski, R. J Appl Phys 1994, 76, 671. 25. Malliaras, G. G.; Krasnikov, V. V.; Bolink, H. J.;
Hadziioannou, G. Appl Phys Lett 1994, 66, 262. 26. Meerholz, K.; Volodin, B. L.; Sandalphon; Kippelen,
K.; Peyghambarian, N. Nature 1994, 371, 497. 27. Kippelen, B.; Sandalphon; Meerholz, K.; Volodin,
B. L.; Lyon, S. R.; Padias, A. B.; Hall, H. K., Jr.; Peyghambarian, N. Mater Res Soc Proc 1994, 328, 577.
28. Vozzhennikov, V. M.; Bulgarovskaya, I. V.; Krasavin, V. P.; Kotov, B. V. Russian J Phys Chem 1982, 56, 1065.
29. Vozzhennikov, V. M.; Kotov, B. V.; Krasavin, V. P. Russian J Phys Chem 1977, 51, 1074.
30. Bulgarovskaya, I. V.; Vozzhennikov, V. M.; Stash, A. I. Russian J Phys Chem 1987, 61, 217.
31. Kolninov, O. V.; Zvonkova, Z. V.; Glushkova, V. P. Russian J Phys Chem 1969, 43, 832.
32. Karl, N.; Ziegler, J. Chem Phys Lett 1975, 32, 438. 33. Harrer, D.; Karl, N. Chem Phys Lett 1973, 21, 49. 34. Frankevich, L.; Rumyantsev, B. M.; Lesin, V. I.;
Kotov, B. V. Opt Spectrosc 1977, 42, 520.
35. Rosenburg, H. M.; Eimutis, E. C. J Phys Chem 1966, 70, 3494.
36. Halvorson, C.; Kraabel, B.; Heeger, A. J.; Volodin, B. L.; Meerholz, K.; Sandalphon; Peyghambarian, N. Opt Lett 1995, 20, 76.
37. Vacar, D.; Heeger, A. J.; Volodin, B.; Kippelen, B.; Peyghambarian, N. Rev Sci Instr 1997, 68, 1119. 38. J. F.; Heanue, M. C.; Bashaw, L. Hesselink,
Sci-ence, 265, 749 (1994).
39. Lundquist, P. M.; Poga, C.; DeVoe, R. G.; Jia, Y.; Moerner, W. E.; Bernal, M. P.; Coufal, H.; Grygier, R. K.; Hoffnagle, J. A.; Jefferson, C. M.; Macfar-lane, R. M.; Shelby, R. M.; Sinserbox, G. T. Opt Lett 1996, 21, 890.
40. Volodin, B. L.; Sandalphon; Meerholz, K.; Kip-pelen, B.; Kukhtarev, N. V.; Peyghambarian, N. Opt Eng 1995, 34, 2213.
41. Chang, C. J.; Whang, W. T.; Hsu, K. Y. J Appl Polym Sci, submitted.