Copyright1999 Elsevier Science Inc. All rights reserved. 0022-3999/99 $–see front matter S0022-3999(98)00082-8
DEVELOPMENT OF A
CHINESE CHRONIC ILLNESS–RELATED
STRESS INVENTORY FOR PRIMARY CARE
KAI-KUEN LEUNG,* BEE-HORNG LUE,*†
LI-YU TANG‡ and EN-CHANG WU§
Abstract—This study evaluates the construct validity and internal consistency of a Chronic Illness–
Related Stress Inventory (CRSI) for primary care Chinese patients and studies the relationship between chronic illness–related stress and sociodemographic characteristics and indices of disease severity. A to-tal of 301 patients were interviewed using a structured questionnaire. The responses to the CRSI were divided into a frequency scale and a severity scale. Six factors including physical integrity and discomfort, psychosocial function and economic burdens, self-fulfillment and daily life, sexual function, self-esteem, and diet limitations were obtained for each CRSI scale. Except for the last factor, all other factors and the scale as a whole for both scales have a Cronbacha of .0.90. The results of the convergent and dis-criminant validity analysis were promising. In addition, chronic illness–related stress was related to insur-ance status and the self-perceived severity of disease. 1999 Elsevier Science Inc.
Keywords: Chronic illness; Construct validity; Instrument; Primary care; Reliability; Stress.
INTRODUCTION
Chronic illnesses are a collection of various kinds of diseases of different etiologies,
symptoms, disease courses, treatment strategies, and prognoses. They are difficult
to define, but their common characteristics are incurability and long-term disability
and dependency [1, 2]. Being ill is considered threatening to most individuals. The
stress perceived by patients with chronic illness is different from patients with acute
illness. Patients with chronic illness are faced with long-standing conflicts,
adjust-ments, and psychosocial situations to which they must adapt [3]. Moreover, these
patients suffer from stress not only due to the demands of the illness, but also due
to failure to cope with these demands [4].
In the literature, different investigators have emphasized different aspects of the
chronic illness–related stress spectrum and have generated different chronic illness–
related stress dimensions [3, 5–8]. Although investigators classify chronic illness–
related stress into different dimensions, the stress perceived by each patient is the
result of interactions between himself and his intrapersonal systems, interpersonal
Departments of *Family Medicine and †Social Medicine, College of Medicine, National Taiwan Uni-versity, Taipei, Taiwan, ROC.
‡College of Nursing, Yang Ming University, Taipei, Taiwan, ROC.
§Department of Psychology, College of Science, National Taiwan University, Taipei, Taiwan, ROC. Address correspondence to: Dr. Kai-Kuen Leung, Department of Family Medicine, National Taiwan University Hospital, No. 1 Chang-Te Street, Taipei 10016, Taiwan, ROC. Tel: 001-886-2-23970800 (ext. 6827); E-mail: kkleung@ha.mc.ntu.edu.tw
relationships, and people in his social environment. Obviously, chronic disease
stress would be best understood using a biopsychosocial paradigm. How patients
perceive their illness is important to both clinicians and researchers. Lazarus
pro-posed that the nature of the perceived stress is the most important determinant in
the coping behaviors that people employ [9]. Because patients with chronic illness
are exposed to long-term threat, how these patients deal with their stress has an
im-portant effect on outcome. According to many studies, individuals who experience
more stress are likely to develop negative physical [10–12] and psychological
re-sponses [13–16]. Therefore, understanding chronic illness–related stress is the first
step for a physician in helping patients to realize their problems, to use fruitful
cop-ing mechanisms, and to prevent detrimental consequences. In clinical practice,
phy-sicians usually spend very limited time with their chronically ill patients. In our
soci-ety, people usually regard a primary care physician as someone who only takes care
of physical conditions. Moreover, reporting psychosocial difficulties to others is
con-sidered shameful in Chinese culture, especially when done in a face-to-face manner.
In the doctor–patient encounter, patients report only their physical discomfort and
ask for symptomatic relief. Psychosocial issues and stress experiences are frequently
not presented to physicians. Undiscovered stress may be related to poor medical
compliance and adverse health outcome. To assess hidden stressors in chronic
ill-ness patients, an instrument that is theoretically sound, methodologically valid, and
clinically applicable is needed. Unfortunately, most of the instruments available,
such as the Social Readjustment Rating Scale [17] and the Hemodialysis Stressor
Scale [18], are not designed for this purpose. Scales designed to measure
illness-re-lated stress in medical patients, such as the Meaning of Illness Questionnaire [19]
and the Psychosocial Adjustment to Illness Scale [20], have not been validated
em-pirically in Chinese patients treated by primary care physicians, and the usefulness
of these instruments in primary care in our country is questionable.
This study was conducted for the purpose of designing a chronic illness–related
stress questionnaire and to validate it in a group of primary care patients. The
relia-bility and convergent and discriminant validity of this questionnaire are discussed.
METHOD
In this study, chronic illness is defined as any disease that is incurable, requires a prolonged period of medical care, and causes a slow decline in physical function. Most chronic diseases seen by primary-care physicians, such as hypertension, diabetic mellitus, and cerebral vascular accident, fulfill these criteria.
Patients who had chronic illnesses and had visited the family medicine out-patient clinic at the Na-tional Taiwan University Hospital for at least 6 consecutive months were candidates for this study. The 6-month interval was set to ensure that the patients were evaluated completely and the diagnosis of chronic illness was confirmed. Patients with a psychiatric diagnosis were excluded from this study be-cause the kinds of stress they face and the way they respond to their difficulties are different from pa-tients with chronic physical illness. All diagnostic information was confirmed by chart audit.
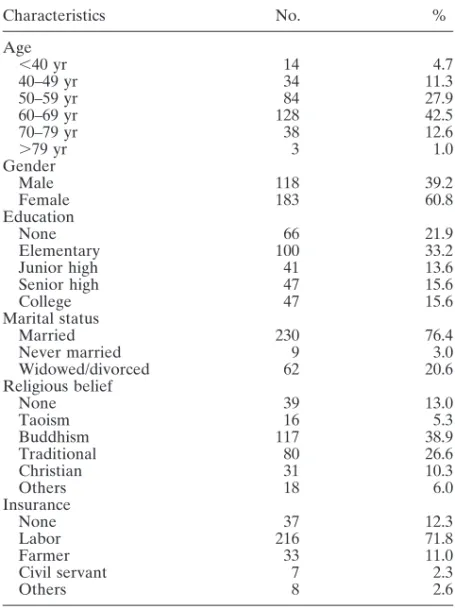
A total of 301 patients, each with at least one chronic illness, constituted the final sample. Their socio-demographic characteristics and diagnostic distribution are shown in Table I. After obtaining oral con-sent from the patients and their doctors, all patients were interviewed by a well-trained interviewer based on a structured questionnaire that included sociodemographic data, the CRSI, and questions about the duration and self-perceived severity of their chronic illnesses. Interviewer training included basic under-standing of stress and illness, underunder-standing the application of the CRSI, interview skills, and interview practice with simulated patients.
The chronic illness–related stress inventory (CRSI) is an instrument that was designed for this study. It has a multidimensional structure that captures different sources of related stress. Ten
illness-Table I.—Demographic characteristics of the study population (N5 301) Characteristics No. % Age ,40 yr 14 4.7 40–49 yr 34 11.3 50–59 yr 84 27.9 60–69 yr 128 42.5 70–79 yr 38 12.6 .79 yr 3 1.0 Gender Male 118 39.2 Female 183 60.8 Education None 66 21.9 Elementary 100 33.2 Junior high 41 13.6 Senior high 47 15.6 College 47 15.6 Marital status Married 230 76.4 Never married 9 3.0 Widowed/divorced 62 20.6 Religious belief None 39 13.0 Taoism 16 5.3 Buddhism 117 38.9 Traditional 80 26.6 Christian 31 10.3 Others 18 6.0 Insurance None 37 12.3 Labor 216 71.8 Farmer 33 11.0 Civil servant 7 2.3 Others 8 2.6
related stress dimensions and a list of 110 stress-related items were developed by the investigators, based on a review of the literature and clinical experience. The ten dimensions were as follows: (a) physical discomfort caused by illness and treatment; (b) threats stemming from illness and treatment; (c) physical and functional changes; (d) deprivation of oral and sexual needs; (e) loss of self-esteem; (f) feeling of abnormality; (g) change in job and career; (h) economic burden; (i) change in social and family function; and (j) loss of self-control. The stress-related items were sent to four physicians and one clinical psychol-ogist for content analysis. All five reviewers had experience in the treatment of chronically ill patients in primary care, and they also had research experience. Reviewers were asked to judge each item from the questionnaire as follows: (1) relevance to the dimension of stress that it is proposed to measure; (2) the impact of the stress item in terms of quality-of-life; and (3) the readability of the sentence. After the deletion of irrelevant items and the revision of some items, the questionnaire was tested by a group of 20 out-patients. A well-trained interviewer read all the questions to each of the patients and asked whether he (she) could understand the meaning of the items. Comments on each item were recorded and the questionnaire was again revised according to the comments of the patients. The final inventory contained 41 questions written in Chinese. An English translation of the CRSI is given in the Appendix. The response to each item was divided into two scales. The first scale captured the self-perceived fre-quency of each stress condition answered by a five-point Likert scale (always55, often54, sometimes53, seldom52, never51) and the second scale captured the self-perceived severity of stress, answered by an-other five-point Likert scale (very severe55, severe54, moderate53, mild52, very mild51). The total score of each scale was the sum of the raw score of the 41 items. The score of each subscale identified by factor analysis was the sum of the raw score of the item loading under each factor.
The duration of chronic disease was defined as the total number of months a patient had acknowl-edged his (her) own chronic illness. If the patient had more than one chronic condition, the illness with the highest level of self-perceived severity and the longest duration was selected. The self-perceived se-verity of each chronic disease was answered by a five-point Likert scale (very severe, severe, moderate, mild, very mild). A self-perceived severity score was calculated from the sum of the severity score of all acknowledged chronic illnesses.
Factor analysis using the principle components method was applied to the frequency scale and the severity scale of the CRSI. A varimax rotation was selected because we hypothesized that factors identi-fied in the CRSI may be correlated. Cronbacha analysis was applied to both scales to examine the item-total correlation of each item of the inventory and the internal consistency of the whole scale. Conver-gent and discriminant validity were examined by comparing the frequency and severity scale of the CRSI. Convergent validity was defined as high correlation between measures of the frequency scale and the severity scale on the same factor. Discriminant validity was assessed as follows: (1) correlations be-tween measures of different factors of the same scale should be less than the correlations bebe-tween mea-sures of the same factor of different scales; (2) correlations between meamea-sures of different factors of dif-ferent scales should be less than the correlations between measures of the same factor of difdif-ferent scales; and (3) a similar pattern of interrelation between factors should be seen in both scales.
The relationships between sociodemographic characteristics including gender, educational level, mar-ital status, religious belief, and insurance status and the CRSI were examined by ANOVA. The relation-ships between continuous variables including age, number of chronic illnesses, total score of self-per-ceived severity of illnesses, and duration of chronic illness and the CRSI were examined by the Pearson product-moment correlation.
RESULTS
Reliability measures
Factor analysis and internal consistency of the frequency scale of the CRSI. Nine
factors were extracted with an eigenvalue of
.1. This explained 73.8% of the total
variance. All items clustered under each factor had factor loading of
.0.40, but
there were three factors with only two items. To reduce the number of factors and
make the results easier to interpret, a six-factor model was chosen by referring to
the slope of the scree test. The six factor model explained 64.9% of the total
vari-ance. Internal consistency of items under each factor and all items of the whole
questionnaire were calculated by using Cronbach
a statistic [21]. The results of the
factor analysis and Cronbach
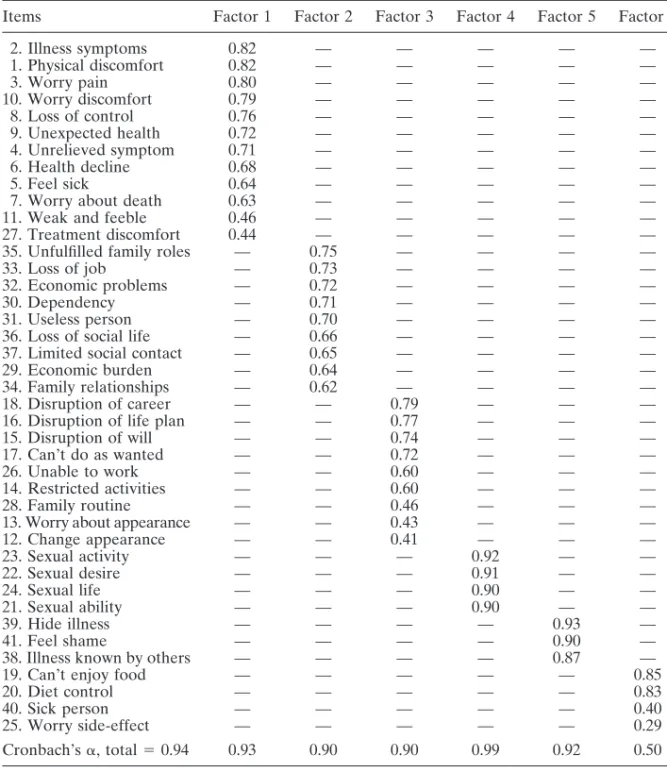
as are shown in Table II. Factor 1 (physical integrity
and discomfort) contains 12 items regarding physical discomfort caused by chronic
illness and treatment. It also contains items about threats to bodily integrity and
health. Factor 2 (psychosocial function and economic burden) contains nine items
regarding change of psychosocial roles and function and economic burdens due to
illness and treatment. Factor 3 (self-fulfillment and daily life) contains nine items
regarding achievements, change of physical appearance, ability to perform usual
ac-tivities, and ability to work. Factor 4 (sexual function) contains four items about
sexual problems stemming from chronic illness. Factor 5 (self-esteem) contains
three items regarding loss of self-esteem and the social stigma of chronic illness.
Cronbach
as of the first five factors were .0.90. Factor 6 (diet limitations) contains
four items, two related to limitation of diet and two items unrelated to diet. The
Cronbach
a of the items of the sixth factor was 0.50, implying that these items were
not highly related. The Cronbach
a became 0.86 if the last two items were excluded.
The Cronbach
a of the whole scale was 0.94.
Factor analysis and internal consistency of the severity scale of the CRSI. Factor
analysis of the severity scale also produced nine factors with an eigenvalue of
.1,
fre-Table II.—Factor analysis and internal consistency of the frequency scale of the chronic illness–related stress inventory
Items Factor 1 Factor 2 Factor 3 Factor 4 Factor 5 Factor 6
2. Illness symptoms 0.82 — — — — — 1. Physical discomfort 0.82 — — — — — 3. Worry pain 0.80 — — — — — 10. Worry discomfort 0.79 — — — — — 8. Loss of control 0.76 — — — — — 9. Unexpected health 0.72 — — — — — 4. Unrelieved symptom 0.71 — — — — — 6. Health decline 0.68 — — — — — 5. Feel sick 0.64 — — — — —
7. Worry about death 0.63 — — — — —
11. Weak and feeble 0.46 — — — — —
27. Treatment discomfort 0.44 — — — — —
35. Unfulfilled family roles — 0.75 — — — —
33. Loss of job — 0.73 — — — —
32. Economic problems — 0.72 — — — —
30. Dependency — 0.71 — — — —
31. Useless person — 0.70 — — — —
36. Loss of social life — 0.66 — — — —
37. Limited social contact — 0.65 — — — —
29. Economic burden — 0.64 — — — —
34. Family relationships — 0.62 — — — —
18. Disruption of career — — 0.79 — — —
16. Disruption of life plan — — 0.77 — — —
15. Disruption of will — — 0.74 — — —
17. Can’t do as wanted — — 0.72 — — —
26. Unable to work — — 0.60 — — —
14. Restricted activities — — 0.60 — — —
28. Family routine — — 0.46 — — —
13. Worry about appearance — — 0.43 — — —
12. Change appearance — — 0.41 — — — 23. Sexual activity — — — 0.92 — — 22. Sexual desire — — — 0.91 — — 24. Sexual life — — — 0.90 — — 21. Sexual ability — — — 0.90 — — 39. Hide illness — — — — 0.93 — 41. Feel shame — — — — 0.90 —
38. Illness known by others — — — — 0.87 —
19. Can’t enjoy food — — — — — 0.85
20. Diet control — — — — — 0.83
40. Sick person — — — — — 0.40
25. Worry side-effect — — — — — 0.29
Cronbach’sa, total 5 0.94 0.93 0.90 0.90 0.99 0.92 0.50
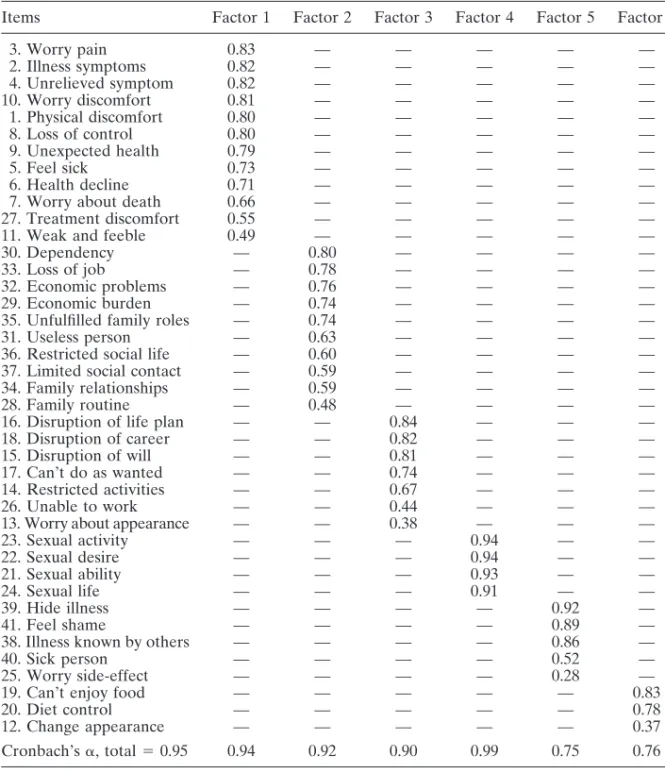
quency scale, the severity scale could be simplified by a six-factor model, which
ex-plained 69% of the total variance. Table III presents the results of the factor
analy-sis and internal conanaly-sistency of the severity scale. Factors 1 and 4 contain the same
items as the frequency scale. The other factors had items similar to the factor
struc-ture of the frequency scale. The items of the first four factors had a Cronbach
a of
.0.90. The last two factors had a Cronbach a of 0.75 and 0.76, respectively. The
Cronbach
a of the whole scale was 0.95.
Convergent and discriminant validity of the CRSI. The correlation coefficient of
cor-Table III.—Factor analysis and internal consistency of the severity scale of chronic illness–related stress inventory
Items Factor 1 Factor 2 Factor 3 Factor 4 Factor 5 Factor 6
3. Worry pain 0.83 — — — — — 2. Illness symptoms 0.82 — — — — — 4. Unrelieved symptom 0.82 — — — — — 10. Worry discomfort 0.81 — — — — — 1. Physical discomfort 0.80 — — — — — 8. Loss of control 0.80 — — — — — 9. Unexpected health 0.79 — — — — — 5. Feel sick 0.73 — — — — — 6. Health decline 0.71 — — — — —
7. Worry about death 0.66 — — — — —
27. Treatment discomfort 0.55 — — — — —
11. Weak and feeble 0.49 — — — — —
30. Dependency — 0.80 — — — —
33. Loss of job — 0.78 — — — —
32. Economic problems — 0.76 — — — —
29. Economic burden — 0.74 — — — —
35. Unfulfilled family roles — 0.74 — — — —
31. Useless person — 0.63 — — — —
36. Restricted social life — 0.60 — — — —
37. Limited social contact — 0.59 — — — —
34. Family relationships — 0.59 — — — —
28. Family routine — 0.48 — — — —
16. Disruption of life plan — — 0.84 — — —
18. Disruption of career — — 0.82 — — —
15. Disruption of will — — 0.81 — — —
17. Can’t do as wanted — — 0.74 — — —
14. Restricted activities — — 0.67 — — —
26. Unable to work — — 0.44 — — —
13. Worry about appearance — — 0.38 — — —
23. Sexual activity — — — 0.94 — — 22. Sexual desire — — — 0.94 — — 21. Sexual ability — — — 0.93 — — 24. Sexual life — — — 0.91 — — 39. Hide illness — — — — 0.92 — 41. Feel shame — — — — 0.89 —
38. Illness known by others — — — — 0.86 —
40. Sick person — — — — 0.52 —
25. Worry side-effect — — — — 0.28 —
19. Can’t enjoy food — — — — — 0.83
20. Diet control — — — — — 0.78
12. Change appearance — — — — — 0.37
Cronbach’sa, total 5 0.95 0.94 0.92 0.90 0.99 0.75 0.76
related with each other. Table IV presents the zero-order correlation matrix
be-tween different factors derived from factor analysis of the two scales.
Correspond-ing factors of the two scales had a correlation coefficient of
.0.80 for the first five
factors and a correlation coefficient of 0.43 for the last factor. The average
coeffi-cient for convergent validity was 0.80. The average coefficoeffi-cients among different
fac-tors measured by the same scale and across different scales were 0.36 and 0.35,
re-spectively. In Table IV, a similar pattern of interrelation between factors is shown.
In each scale, the correlation is higher among the first three factors than the last
Table IV.—Correlation matrix of the factors of the frequency and severity scalesa Scale 1 2 factor 1 2 3 4 5 6 1 2 3 4 5 6 1 1 1.00 2 0.55 1.00 3 0.66 0.65 1.00 4 0.37 0.44 0.53 1.00 5 0.19 0.33 0.30 0.15 1.00 6 0.05 0.12 0.13 0.17 0.10 1.00 2 1 0.89 0.50 0.55 0.26 0.20 0.06 1.00 2 0.60 0.91 0.65 0.43 0.35 0.10 0.59 1.00 3 0.57 0.55 0.83 0.41 0.31 0.18 0.62 0.60 1.00 4 0.37 0.39 0.48 0.88 0.20 0.21 0.27 0.41 0.38 1.00 5 0.27 0.31 0.35 0.25 0.83 0.37 0.30 0.36 0.39 0.28 1.00 6 0.41 0.41 0.38 0.26 0.14 0.43 0.46 0.38 0.39 0.27 0.26 1.00
aScale 1, frequency scale; scale 2, severity scale. Factor 1, physical integrity; factor 2, psychosocial
function; factor 3, self-fulfillment; factor 4, sexual function; factor 5, self-esteem; factor 6, diet limi-tation.
three factors and there is a trend toward a decrease in coefficients from top to
bot-tom and from left to right in the correlation matrix.
Relationship between sociodemographic characteristics and chronic illness–related
stress. Age, gender, marital status, and religious belief were statistically unrelated
to each of the two scales of the chronic illness–related stress inventory. Insurance
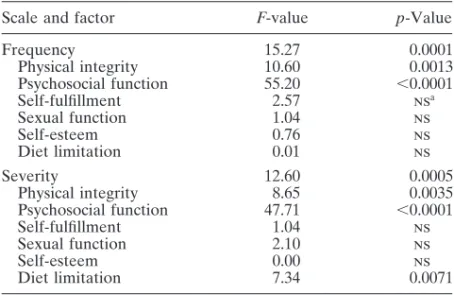
status was the only variable statistically related to the whole and to many factors of
both scales (Table V). This result indicates that patients without medical insurance
coverage perceived more illness-related stress than those with insurance coverage.
Moreover, the perceived stress included not only financial burdens but physical
bur-dens as well.
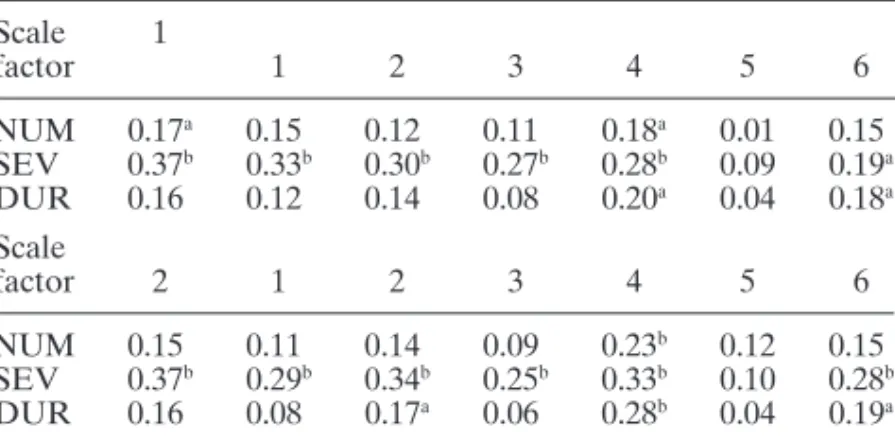
Relationship between number, duration, and perceived severity of disease and
chronic illness–related stress. Table VI presents the correlation matrix of the three
Table V.—Relationship between insurance status and the frequency and severity scale of the CRSI
Scale and factor F-value p-Value
Frequency 15.27 0.0001 Physical integrity 10.60 0.0013 Psychosocial function 55.20 ,0.0001 Self-fulfillment 2.57 nsa Sexual function 1.04 ns Self-esteem 0.76 ns Diet limitation 0.01 ns Severity 12.60 0.0005 Physical integrity 8.65 0.0035 Psychosocial function 47.71 ,0.0001 Self-fulfillment 1.04 ns Sexual function 2.10 ns Self-esteem 0.00 ns Diet limitation 7.34 0.0071 aNonsignificant.
Table VI.—Correlation matrix of three disease characteristics and chronic illness–related stress
Scale 1 factor 1 2 3 4 5 6 NUM 0.17a 0.15 0.12 0.11 0.18a 0.01 0.15 SEV 0.37b 0.33b 0.30b 0.27b 0.28b 0.09 0.19a DUR 0.16 0.12 0.14 0.08 0.20a 0.04 0.18a Scale factor 2 1 2 3 4 5 6 NUM 0.15 0.11 0.14 0.09 0.23b 0.12 0.15 SEV 0.37b 0.29b 0.34b 0.25b 0.33b 0.10 0.28b DUR 0.16 0.08 0.17a 0.06 0.28b 0.04 0.19a
Scale 1, frequency scale; scale 2, severity scale. Factor 1, physical integrity; factor 2, psychosocial function; factor 3, self-fulfillment; factor 4, sexual function; factor 5, self-esteem; factor 6, diet limita-tion; NUM, number of chronic illnesses; SEV, self-perceived stress; DUR, duration of illness.
ap, 0.01;bp, 0.001.
disease characteristics and measures of the frequency and severity scale. Number
and duration of disease were weakly related to factor 4 (sexual function) in both
scales. The self-perceived severity of disease was strongly related to both scales and
most of the factors, indicating that those who interpreted their diseases as more
se-vere at the same time perceived more illness-related stress.
DISCUSSION
Hypertension, diabetes mellitus, cerebrovascular disease, cardiovascular disease,
and arthritis are the most common chronic conditions encountered in primary
prac-tice in Taiwan. Patients with different kinds of chronic illness may have some types
of stress in common and some stress related only to the specific disease. In the
pro-cess of composing illness-related stress items, only items that targeted stress related
to most types of disease were included in this inventory. Although ten different
di-mensions were proposed to construct the inventory, only 41 items that described
stress conditions frequently encountered in primary care were selected. The results
of the factor analysis were promising. Nine factors were produced in the initial
anal-ysis for both the frequency and severity scales. These nine factors empirically
repro-duced nearly all the proposed dimensions of illness-related stresses. The
shortcom-ings of the nine-factor model were that many factors contained only two items, and
that further analysis was too complicated. One way to solve this problem would be
to add more items to those factors with too-few items. However, this lengthens
re-sponse time and makes it less practical to use in a primary care setting. Moreover,
the scree test revealed that there was a break-point on the slope at the sixth factor,
so a six-factor model seemed to be more appropriate. A six-factor model gave a
sat-isfactory item separation and explained
.60% of the total variance of the sample.
With only a few exceptions, factor analyses of frequency and severity produced
fac-tors containing identical items.
Internal consistency reliability of the CRSI was tested by Cronbach
a analysis.
lower bound for the reliability of multi-item scales [22]. Our results revealed very
high internal consistency among items of the instrument as a whole and across
dif-ferent factors as identified by factor analysis. The only exception was the last factor.
It contained items about diet limitation and two further items not related to diet.
These two items had very low factor loading compared with items concerned with
diet limitation. Further study may focus on revision or deletion of items that had
low item-total correlations within each factor to maximize the Cronbach
a value.
Diet problems seemed to be a unique component in illness-related stress in our
study population. Because hypertension, diabetes mellitus, cerebrovascular disease,
and cardiovascular disease made up the majority of our sample, it was not surprising
that these patients perceived considerable stress stemming from diet restriction.
Conventionally, construct validity is examined by the multitrait–multimethod
(MTMM) technique, originally described by Campbell and Fiske [23]. However,
MTMM methodology requires comparison of different traits with different
meth-ods. In our experience, we had difficulty finding other well-established tests to
mea-sure chronic illness stress in Chinese patients. With these limitations, we examined
the convergent and discriminant ability of the CRSI with the two response scales.
This approach may be less convincing than the original MTMM design from a
meth-odological point of view, but is more feasible to carry out in a early study.
In the present investigation, the correlation matrix revealed high correlation
co-efficients between different scales of the same factor for the first five factors, but was
obviously low for the last factor. This finding was consistent with the results of
fac-tor analysis and Cronbach
a analysis, where the measures of the last factor in both
scales contained more nonidentical items and lower internal consistency among
items. Measurement of the last factor for the two scales might imply different stress
dimensions. Except for the items comprising the last factor, it was demonstrated
that the CRSI had fulfilled the basic requirement of construct validity.
Chronic illness–related stress correlated with insurance status, but not with other
sociodemographic characteristics such as age, gender, marital status, education
level, and religious belief. This demonstrates that the financial burden from a
chronic, never-ending condition was a very important stressor for patients. It was
noteworthy that patients without medical insurance had stress other than financial
burdens. Physical burden was also higher in patients without medical insurance than
in those with insurance coverage. An explanation could not be obtained from the
results of this study. It is possible that there was a substantial difference between
patients with insurance coverage and those without coverage who sought medical
care. Medical insurance is a well-known variable that can affect one’s illness
behav-ior [24–26].
Chronic illness–related stress was also moderately correlated with the
self-per-ceived severity of illness. The relation between illness-related stress and the
objec-tive characteristics of illness, including the number of chronic illnesses and the
dura-tion of the most severe illness, was markedly low. It is possible that an individual
may use similar information in the cognitive evaluation of illness-related stress and
severity of illness. The cognitive process, not the objective nature of the illness, was
shown to be more important in the formation of stress. This result is concordant
with most results described in the literature reporting that cognitive appraisal is
im-portant in determining the stress of an event [27–29].
in-struments. The CRSI was developed to assist clinicians in identifying hidden
stresses and improving the quality of care. Completing the CRSI (including the
fre-quency and severity scales) requires an average of 10 minutes. Self-rating of the
CRSI may require less time to complete. There is no test similar to the SMOG
grad-ing formula to test the readability of the questionnaire in the Chinese language. In
the development of the CRSI, items were written in simple sentences with plain
vo-cabulary, so that the questionnaire could be understood by people with 6 years
of education.
This study showed that the CRSI is a promising instrument for the evaluation of
chronic illness–related stress in a primary care setting in the Chinese population.
Further improvement of the CRSI should focus on item selection and revision,
es-pecially items in the last factor. Reliability and validity studies should be continued
with other methods and in other samples. In future studies, we will need to prove
whether the CRSI can predict clinical outcomes. This is a major concern for
clini-cians who use an instrument to measure stress in chronic illness.
REFERENCES
1. Curtin M, Lubkin I. What is chronicity? In: Lubkin IM, ed. Chronic illness: impact and interventions, 2nd ed. Boston: Jones and Bartlett 1990:2–20.
2. Dimond M, Jones SL. Chronic illness across the life span. Norwalk, Connecticut: Appleton-Century-Crofts 1983.
3. Abram HS. The psychology of chronic illness. J Chronic Dis 1972;25:659–641. 4. Ben-Sira Z. Chronic illness,stress and coping. Soc Sci Med 1984;18:725–736. 5. Levy N. The chronically ill patient. Psychiatry Q 1979;51:189–197.
6. Moos RH, Tsu VD. The crisis of physical illness: an overview. In: Moos RH, ed. Coping with physical illness. New York: Plenum 1977:3–21.
7. Miller JF. Coping with chronic illness. In: Miller JF, ed. Coping with chronic illness: overcoming powerlessness. Philadelphia: Lippincott 1983:15–36.
8. Cohen F, Lazarus RS. Coping with stresses of illness. In: Stone GC, Cohen F, Adler NE, eds. Health psychology. San Francisco: Jossey-Bass 1979:217–254.
9. Lazarus RS, Launiar R. Stress-related transactions between person and environment. In: Pervin LA, Levis M, eds. Perspectives in interactional psychology. New York: Plenum 1978:287–327. 10. Krantz DS. Cognitive processes and recovery from heart attack: a review and theoretical analysis.
J Human Stress 1980;6:27–38.
11. Harrell JP. Psychological factors and hypertension: a status report. Psychol Bull 1980;87:482–501. 12. Cohen F. Personality, stress and the development of physical illness. In: Stone GC, Cohen F, Alder
NE, eds. Health psychology — a handbook. San Francisco: Jossey-Bass 1979.
13. Paykel ES. Life stress and psychiatric disorder: applications of the clinical approach. In: Dohren-wend BS, DohrenDohren-wend BP, eds. Stressful life events: their nature and effect. New York: Wiley 1974:135–149.
14. Theorell T. Selected illness and somatic factors in relation to two psychosocial stress indices: a pro-spective study in middle-aged construction building workers. J Psychosom Res 1976;20:17–20. 15. McCabe PM, Schneiderman N. Psychophysiologic reactions to stress. In: Schneiderman N, Tapp J,
eds. Behavioural medicine. Hillsdale, New Jersey: Erlbaum 1985.
16. Turner RJ, Beiser M. Major depression and depressive symptomatology among the physically dis-abled: assessing the role of chronic stress. J Nerv Ment Dis 1990;178:343–350.
17. Holmes TH, Rahe RH. The social readjustment rating scale. J Psychosom Res 1967;11:213–218. 18. Baldree KS, Murphy SR, Powers MJ. Stress identification and coping patterns in patients on
hemodi-alysis. Nurs Res 1982;31:107–112.
19. McAdams C, Byrne C, Browne G, Roberts J, Streiner D. Measuring the meaning of illness in cancer patients. Paper presented at the Fourth National Symposium on Oncology Nursing, McMaster Uni-versity, Hamilton, ON, Canada.
20. Derogatis LR. The psychosocial adjustment to illness scale (PAIS). J Psychosom Res 1986;30:77–91. 21. Cronbach, LJ. Coefficient alpha and the internal structure of tests. Psychometrika 1951;16:297–334.
22. Novick M, Lewis G. Coefficient alpha and the reliability of composite measurements. Psychome-trika 1967;32:1–13.
23. Campbell DT, Fiske DW. Convergent and discriminant validation by the multitrait–multimethod matrix. Psychol Bull 1959;56:85–105.
24. Aday LA, Lee ES, Spears B, et al. Health insurance and utilization of medical care for children with special health care needs. Med Care 1993;31:1013–1026.
25. Landerman LR, Burns BJ, Swartz MS, et al. The relationship between insurance coverage and psy-chiatric disorder in predicting use of mental health services. Am J Psychiatry 1994;151:1785–1790. 26. Brindis C, Kapphahn C, McCarter V, Wolfe AL. The impact of health insurance status on adoles-cents’ utilization of school-based clinic services: implications for health care reform. J Adolesc Health 1995;16:18–25.
27. Lazarus RS, Folkman S. Stress, appraisal, and coping. New York: Springer 1984.
28. Lazarus RS, Launier R. Stress-related transactions between person and environment. In: Pervin LA, Lewis M, eds. Perspectives in interactional psychology. New York: Plenum 1978.
29. Cohen F, Lazarus RS: Coping and adaptation in health and illness. In: Mechanic D, ed. Handbook of health, health care, and health professions. New York: Free Press 1983.
APPENDIX A English translation of the CRSI domains and items:
(a) Physical discomfort caused by illness and treatment (four items): 1. I physically feel discomfort all the time due to chronic illness 2. I suffer from symptoms caused by chronic illness
4. I cannot get rid of those symptoms caused by my illness 27. I suffer from discomfort caused by the treatment (b) Threats stemming from illness and treatment (six items):
3. I worry that chronic illness will bring about pain and discomfort 6. I worry about the deterioration of my health
7. I worry that I am going to die of my illness
10. I worry that I must live with my illness and discomfort for a long period of time 13. I worry that illness will change my physical appearance
25. I worry about treatment side effects (c) Physical and functional changes (four items):
14. I cannot continue my usual activities after being ill 30. I have to depend on others after being ill 11. I have become weak and feeble
26. I cannot continue my work after being ill (d) Deprivation of oral and sexual needs (six items):
19. I cannot enjoy my favorite foods due to my illness 20. I must control my diet due to illness
21. I lost sexual desire due to illness
22. I have to limit my sexual activity due to illness 23. My sexual ability declined due to illness 24. Treatment of my illness affects my sexual life (e) Loss of self-esteem (four items):
38. I do not want others to know that I am chronically ill 39. I hide my illness from others
40. I do not like others to treat me as a sick person 41. I feel shame at having a chronic illness (f) Feeling of abnormality (three items):
5. I feel that I will always be a sick person 12. Chronic illness changed my physical appearance 31. I became a useless person after being ill (g) Change of job and career (six items):
16. My illness affects my life plan
17. Being chronically ill prevents me from doing what I want to do 18. Being chronically ill prevents the development of my career 26. Treatment of my illness disrupts my usual working schedule 33. I cannot continue my job after being ill
(h) Economic burden (two items):
29. Treatment of my illness increases my economic burden 32. I have economic difficulties after being ill
(i) Change in social and family function (five items): 28. Treatment of my illness disrupts my family routine
34. Being chronically ill affects the relationship between me and my family
35. I cannot fulfill my family responsibilities (such as earn money, do housework, etc.) after being ill 36. I cannot continue my usual social activities because of my illness
37. I have to limit my time in social interactions after being ill (j) Loss of self-control (two items):
8. I cannot control the progression of my illness 9. I cannot anticipate the deterioration of my illness