Solvents in Taiwan
YUNG-MING CHANG,
MPH, CHI-FU TAI,
BS, SWEO-CHUNG YANG,
MPH,
CHIOU-JONG CHEN,
PHD, TUNG-SHENG SHIH,
SCD, RUEY S. LIN,
MD, DRPHAND SAOU-HSING LIOU,
MD,
MOH,
PHDPURPOSE: A retrospective cohort mortality study based on standardized mortality ratios (SMRs) was
conducted to investigate the possible association between exposure to chlorinated organic solvents and various types of cancer deaths.
METHODS: Vital status and causes of death of study subjects were determined from January 1, 1985 to
December 31, 1997 by linking cohort data with the National Mortality Database. Person-year accumulation began on the date of entry to the cohort, or January 1, 1985 (whichever came later), and ended on the closing date of the study (December 31, 1997), if alive; or the date of death.
RESULTS: This retrospective cohort study examined cancer mortality among 86,868 workers at an
electronics factory in the northern Taiwan. Using various durations of employment and latency and adjusting for age and calendar year, no significantly elevated SMR was found for any cancer in either male or female exposed workers when compared with the general Taiwanese population. In particular, the risk of female breast cancer was not found to be increased. Although ovarian cancer suggested an upward trend when analyzed by length of employment, ovarian cancer risk for the entire female cohort was not elevated.
CONCLUSIONS: It is concluded that this study provided no evidence that exposure to chlorinated
organic solvents was associated with human cancer risk.
Ann Epidemiol 2003;13:652–660. 쑕 2003 Elsevier Inc. All rights reserved.
KEY WORDS: Chlorinated Organic Solvents, Standardized Mortality Ratio, Trichloroethylene,
Tetrachlo-roethylene.
INTRODUCTION
In June 1998 the press in Taiwan revealed that an electron-ics factory located in the northern part of island improperly disposed of waste materials including chlorinated organic solvents. The dumping site has been found to result in organic solvent contamination of the underground water. This electronics factory began operations in May 1968 and was shut down in 1992. The products of this factory included various parts, main board, and integrated circuits for black-and-white and color television sets. The Environ-mental Protection Agency (EPA) in Taiwan verified that the water in some wells nearby had been polluted by trichlo-roethylene (TCE) and tetrachlotrichlo-roethylene (PCE). The
From the Graduate Institute of Life Sciences, National Defense Medical Center (Y-M.C., S-H.L.); Institute of Occupational Safety and Health, Council of Labor Affairs, Executive Yuan (Y-M.C., C-F.T., S-C.Y., C-J.C., T-S.S.); College of Public Health, National Taiwan University (R.S.L.); and School of Public Health, National Defense Medical Center (S-H.L.), Taipei, Taiwan.
Address correspondence to: Dr. Saou-Hsing Liou, 161 Ming-Chun East Road, Sec. 6, P.O. Box 90048-509, Rm. 4333, Nei-Hu, Taipei, Taiwan, 114, Republic of China. Tel.: 886-2-87924813(5); Fax: 886-2-87924814. Email:[email protected]
Received April 12, 2002; accepted December 16, 2002.
쑕 2003 Elsevier Inc.All rights reserved. 1047-2797/03/$–see front matter 360 Park Avenue South, New York, NY 10010 doi:10.1016/S1047-2797(03)00038-3
water quality was below the standard established for drinking water by the World Health Organization (WHO). TCE and PCE are the main chlorinated hydrocarbon solvents used in dry cleaning, machine cleaning, and metal degreasing(1). Animal experiments showed that TCE and PCE cause liver carcinoma and lung carcinoma in mice, as well as renal cell carcinoma in rats(2–5). Epidemiological research has focused on the risk of cancer (including liver(6–9), cervical (6, 9, 10), bladder(9–13), lung cancers(6, 10, 14), leukemia (6, 11) and Hodgkin’s disease (10)) among workers em-ployed by industries using these two chemicals. However, most of the results obtained from such studies were largely inconclusive. Based on the evidence in experimental ani-mals and humans, TCE and PCE are considered “probable carcinogens” to humans (Group 2A) by the International Agency for Cancer Research(15).
The Institute of Occupational Safety and Health in Taiwan conducted an epidemiological study to investigate the association between cancer risk of workers and chemical exposures in their working environment. Initially, a propor-tionate cancer morbidity study was conducted in the first year. The results of the first year study showed a slightly and marginally significant proportionate cancer morbidity ratio (PCMR) for breast cancer (PCMR⫽ 1.2, 95% CI: 1.0–4.4) among female workers in the exposed group when compared
with either textile or electronics control groups. Because of the well-known methodological problems of PCMRs and to confirm the association, a retrospective cohort mortality study based on standardized mortality ratios (SMRs) was conducted to further analyze the relationship between vari-ous types of cancer and workplace exposures among the employees at this electronics factory.
MATERIALS AND METHODS
Description and Ascertainment of the Study Cohort Cohort of the exposed group was retrieved from the Bureau of Labor Insurance (BLI) computer database from 1978 through December 31, 1997. Data provided by BLI included employment histories at different factories and the changes of insurance status from 1978 through December 31, 1997. To ensure complete recruitment of the exposed cohort, BLI also provided hard copies of insurance records of the exposed group who had their first employment from 1973 to 1978 (since no computerized records were available before that year).
To verify the completeness of the exposed cohort, we used the labor-insurance hospitalization data to identify employees of the exposed group who had been hospitalized, and the list of names of the United Labor Association (ULA), which comprised of employees of the exposed group. Both, the patients among the labor insurance hospitalization dataset and the list of members in the United Labor Associa-tion (ULA), were included in the cohort established in this study. The result indicated that the cohort of exposed workers was complete.
Follow-up of the Study Cohort
Vital status of study subjects was determined from January 1, 1985 to December 31, 1997 (the closing date of the study) by linkage with the National Mortality database, which was maintained and updated regularly by the Department of Health (DOH). January 1, 1985 was selected as the earliest date of entry into the follow-up because the National Mor-tality database was incomplete before that date. This record linkage was used to identify deaths in this cohort. The causes of death were coded based on the International Statistical Classification of Disease, Injury, and Cause of Death issued by DOH in 1981.
Calculation of Person-years
Person-year accumulation began on the date of entry to the exposed cohort, or January 1, 1985 (whichever came later), and ended on the closing date of the study (December 31, 1997), if alive; or the date of death. In addition, person-years were stratified by gender, current age, duration of
employment and calendar year. To calculate the dose– response relationship, we divided the workers into three groups based on the duration of employment, that is, em-ployment of less than or equal to 1 year, longer than 1 year but less than or equal to 5 years, and longer than 5 years. Length of employment analysis was carried out for cancer sites with a minimum of 3 deaths. The dose–response rela-tionship of period effect was also estimated. We divided the workers into two groups based on two time intervals: 1985–1990 and 1991–1997.
Duration of Employment
The current age of each worker was determined by sub-tracting the year of birth from 1997. The age at start of work at the factory was determined by subtracting the date of birth from the inception date of labor insurance coverage. The duration of employment was defined as the period between the inception of labor insurance coverage and the termination of such coverage. If a worker changed employ-ment during this period, the total duration of employemploy-ment in this index company was estimated by summing up all durations during which labor insurance coverage was in effect. According to the chairperson of the Union of Labor Association (ULA), workers in this index factory began being laid off in early 1992, and most of them were dismissed by July 31, 1992. Hence, we made the following assumptions for individuals of incomplete records in joining or withdraw-ing from the labor insurance when calculatwithdraw-ing the duration of employment:
1. The date of joining the insurance was incomplete but the date of withdrawing from insurance was complete (n⫽ 6508): If the records were extracted from the paper records, we assumed that the date of joining the insurance was October 15, 1970 (given that BLI insurance paper records started from May 1, 1973, we define the date of joining the insurance as the median between the first operation date of this index company and May 1, 1973). If the records were extracted from the computerized records, we assumed that the date of joining the insurance was January 31, 1973 (given that the BLI insurance computer database started from January 1, 1978, we define the date of joining the insurance as the median between the first operation date of this index company and January 1, 1978). 2. The date of joining the insurance was complete but
the date of withdrawing from insurance was incom-plete (n⫽ 5220): The duration of employment can be assumed to be one half of the period from the date of joining the insurance to January 1, 1978 or July 31, 1992, depending on whether the records were from paper records (January 1, 1978) or the computerized database (July 31, 1992). Addition of the duration of
employment to the date of joining the insurance was used to estimate the date of withdrawing from the insurance.
Statistical Analysis
The Statistical Analysis System (SAS) version 8.0 was used for data processing. SMRs were used to estimate the strength of the association between occupational exposure and the cancer death. Number of deaths stratified by the underlying cause among the study cohort were compared with the ex-pected numbers derived from death rates of the general Taiwanese population. Expected numbers were obtained by applying Taiwanese five-year age-specific, one-calendar-year-specific, and gender-specific death rates to person-years from identical strata in the cohort. SMRs were obtained by dividing the number of observed deaths by the expected number. Statistical significance of SMR was based on 95% confidence intervals constructed according to Liddell(16). In the data analysis, we analyzed the whole dataset with-out any exclusion at first. Then the exclusion criteria of
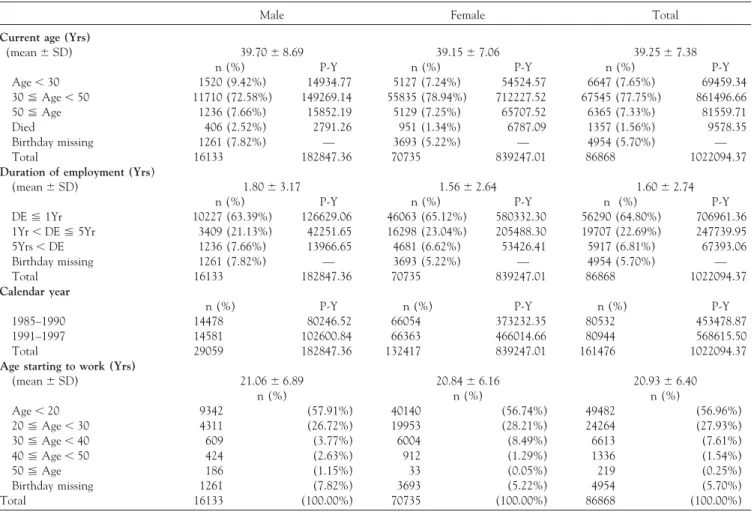
TABLE 1. Distribution of characteristics among the study cohort stratified by gender
Male Female Total
Current age (Yrs)
(mean⫾ SD) 39.70⫾ 8.69 39.15⫾ 7.06 39.25⫾ 7.38
n (%) P-Y n (%) P-Y n (%) P-Y
Age⬍ 30 1520 (9.42%) 14934.77 5127 (7.24%) 54524.57 6647 (7.65%) 69459.34 30⬉ Age ⬍ 50 11710 (72.58%) 149269.14 55835 (78.94%) 712227.52 67545 (77.75%) 861496.66 50⬉ Age 1236 (7.66%) 15852.19 5129 (7.25%) 65707.52 6365 (7.33%) 81559.71 Died 406 (2.52%) 2791.26 951 (1.34%) 6787.09 1357 (1.56%) 9578.35 Birthday missing 1261 (7.82%) — 3693 (5.22%) — 4954 (5.70%) — Total 16133 182847.36 70735 839247.01 86868 1022094.37
Duration of employment (Yrs)
(mean⫾ SD) 1.80⫾ 3.17 1.56⫾ 2.64 1.60⫾ 2.74
n (%) P-Y n (%) P-Y n (%) P-Y
DE⬉ 1Yr 10227 (63.39%) 126629.06 46063 (65.12%) 580332.30 56290 (64.80%) 706961.36 1Yr⬍ DE ⬉ 5Yr 3409 (21.13%) 42251.65 16298 (23.04%) 205488.30 19707 (22.69%) 247739.95 5Yrs⬍ DE 1236 (7.66%) 13966.65 4681 (6.62%) 53426.41 5917 (6.81%) 67393.06 Birthday missing 1261 (7.82%) — 3693 (5.22%) — 4954 (5.70%) — Total 16133 182847.36 70735 839247.01 86868 1022094.37 Calendar year
n (%) P-Y n (%) P-Y n (%) P-Y
1985–1990 14478 80246.52 66054 373232.35 80532 453478.87 1991–1997 14581 102600.84 66363 466014.66 80944 568615.50 Total 29059 182847.36 132417 839247.01 161476 1022094.37
Age starting to work (Yrs)
(mean⫾ SD) 21.06⫾ 6.89 20.84⫾ 6.16 20.93⫾ 6.40 n (%) n (%) n (%) Age⬍ 20 9342 (57.91%) 40140 (56.74%) 49482 (56.96%) 20⬉ Age ⬍ 30 4311 (26.72%) 19953 (28.21%) 24264 (27.93%) 30⬉ Age ⬍ 40 609 (3.77%) 6004 (8.49%) 6613 (7.61%) 40⬉ Age ⬍ 50 424 (2.63%) 912 (1.29%) 1336 (1.54%) 50⬉ Age 186 (1.15%) 33 (0.05%) 219 (0.25%) Birthday missing 1261 (7.82%) 3693 (5.22%) 4954 (5.70%) Total 16133 (100.00%) 70735 (100.00%) 86868 (100.00%)
Abbreviations: Yrs⫽ years; n ⫽ number of workers; P-Y ⫽ person-years; DE ⫽ duration of employment.
workers with duration of employment of less than 3 months, 6 months, 1 year and 5 years, respectively, were imposed in the SMR analysis. In addition, SMRs were stratified by duration of employment and by calendar year for a dose– response relationship analysis. A chi-square test was used to evaluate the statistical significance of SMR trends(17).
RESULTS
Description of the Study Cohort Members
The total number of workers in the exposed group was 86,868. Most of the cohort members were females (80%). The distribution of individual members and person-years stratified by gender, current age, duration of employment, calendar year and age at start of work is shown inTable 1. The male cohort contributed 182,847 person-years and the female cohort contributed 839,247 person-years during the 13-year observation period. Most of the workers’ current
age was between 30 and 50 years, and these groups contrib-uted 149,269 person-years in the male cohort and 712,227 person-years in the female cohort. Only 7.15% of workers were younger than 30 years of age.
Most of the workers were employed at this company for less than 1 year (64.81%). About 40% of the workers in both male and female groups had employment duration less than 3 months (data not shown). While only 8.82% of workers were employed for more than 5 years in this study cohort, those who had been employed for more than 10 years accounted for less than 0.7% of the total (data not shown). Male workers employed for less than 1 year, be-tween l year and 5 years, and more than 5 years contributed 126,629, 42,251 and 13,966 person-years, respectively. The person-years were 580,332, 205,488 and 53,426 contributed by female workers employed for less than 1 year, between l year and 5 years, and more than 5 years, respectively.
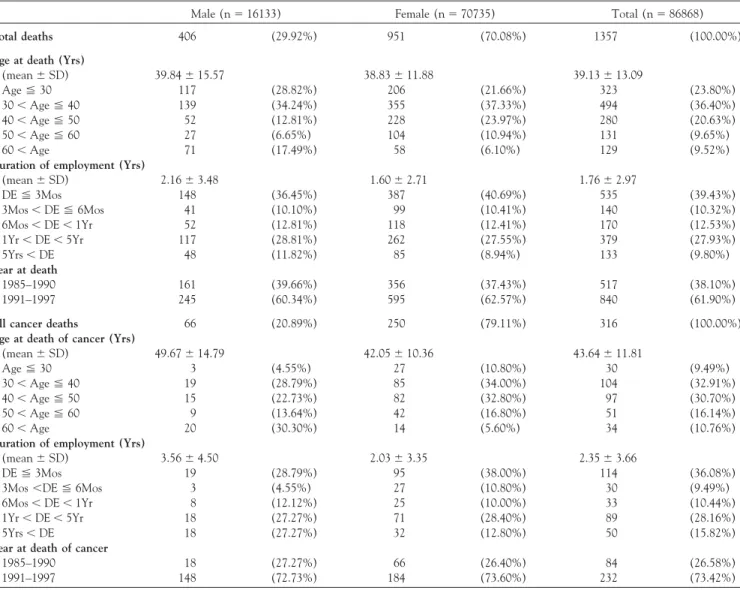
TABLE 2. Distribution of characteristics among all deaths and cancer deaths in the study cohort
Male (n⫽ 16133) Female (n⫽ 70735) Total (n⫽ 86868)
Total deaths 406 (29.92%) 951 (70.08%) 1357 (100.00%)
Age at death (Yrs)
(mean⫾ SD) 39.84⫾ 15.57 38.83⫾ 11.88 39.13⫾ 13.09 Age⬉ 30 117 (28.82%) 206 (21.66%) 323 (23.80%) 30⬍ Age ⬉ 40 139 (34.24%) 355 (37.33%) 494 (36.40%) 40⬍ Age ⬉ 50 52 (12.81%) 228 (23.97%) 280 (20.63%) 50⬍ Age ⬉ 60 27 (6.65%) 104 (10.94%) 131 (9.65%) 60⬍ Age 71 (17.49%) 58 (6.10%) 129 (9.52%)
Duration of employment (Yrs)
(mean⫾ SD) 2.16⫾ 3.48 1.60⫾ 2.71 1.76⫾ 2.97 DE⬉ 3Mos 148 (36.45%) 387 (40.69%) 535 (39.43%) 3Mos⬍ DE ⬉ 6Mos 41 (10.10%) 99 (10.41%) 140 (10.32%) 6Mos⬍ DE ⬍ 1Yr 52 (12.81%) 118 (12.41%) 170 (12.53%) 1Yr⬍ DE ⬍ 5Yr 117 (28.81%) 262 (27.55%) 379 (27.93%) 5Yrs⬍ DE 48 (11.82%) 85 (8.94%) 133 (9.80%) Year at death 1985–1990 161 (39.66%) 356 (37.43%) 517 (38.10%) 1991–1997 245 (60.34%) 595 (62.57%) 840 (61.90%)
All cancer deaths 66 (20.89%) 250 (79.11%) 316 (100.00%)
Age at death of cancer (Yrs)
(mean⫾ SD) 49.67⫾ 14.79 42.05⫾ 10.36 43.64⫾ 11.81 Age⬉ 30 3 (4.55%) 27 (10.80%) 30 (9.49%) 30⬍ Age ⬉ 40 19 (28.79%) 85 (34.00%) 104 (32.91%) 40⬍ Age ⬉ 50 15 (22.73%) 82 (32.80%) 97 (30.70%) 50⬍ Age ⬉ 60 9 (13.64%) 42 (16.80%) 51 (16.14%) 60⬍ Age 20 (30.30%) 14 (5.60%) 34 (10.76%)
Duration of employment (Yrs)
(mean⫾ SD) 3.56⫾ 4.50 2.03⫾ 3.35 2.35⫾ 3.66
DE⬉ 3Mos 19 (28.79%) 95 (38.00%) 114 (36.08%)
3Mos⬍DE ⬉ 6Mos 3 (4.55%) 27 (10.80%) 30 (9.49%) 6Mos⬍ DE ⬍ 1Yr 8 (12.12%) 25 (10.00%) 33 (10.44%) 1Yr⬍ DE ⬍ 5Yr 18 (27.27%) 71 (28.40%) 89 (28.16%)
5Yrs⬍ DE 18 (27.27%) 32 (12.80%) 50 (15.82%)
Year at death of cancer
1985–1990 18 (27.27%) 66 (26.40%) 84 (26.58%)
1991–1997 148 (72.73%) 184 (73.60%) 232 (73.42%)
Abbreviations: Yrs⫽ years; DE ⫽ duration of employment.
Table 1 also shows the distribution of age at start of work. Most of the workers started working under the age of 30. The proportion of workers who started working before the age of 20 was 57%. Regarding the calendar year, almost all workers contributed person-years during the period between 1985 and 1997.
Description of the Deceased Cancer Cases
There were 1357 deaths in this study cohort (Table 2). Among them, 316 (24%) deaths were due to cancers. Thirty-six percent of the workers who died due to cancer were employed for less than 3 months, followed by between 1 and 5 years of employment. Female workers (80%) were dominant in the sex distribution of cancer deaths. Most of the female cancer cases died between 30 and 50 years of age, while in males a larger number of deaths occurred at
more than 60 years of age. Most of cancer cases (73%) died between 1991 and 1997. The distribution of characteristics in all causes deaths was similar to those of cancer cases except that most of the all causes deaths occurred at the age less than 40.
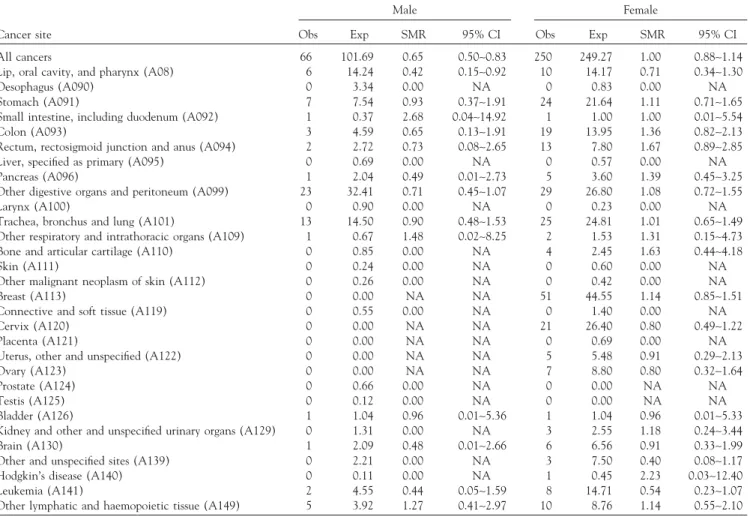
SMR Analysis Based on Entire Cohort without Any Exclusion
The observed number of all-cause death in the males was significantly lower than expected (SMR⫽ 0.79, 95% CI: 0.71–0.87), while the SMR in the females was significantly elevated (SMR⫽ 1.13, 95% CI: 1.05–1.20). The estimates and 95% confidence intervals for various types of cancers stratified by gender are shown in Table 3. The observed deaths for all cancer in males was significantly lower than expected (SMR: 0.65, 95% CI: 0.50–0.83), while the ob-served deaths for all cancer was equal to the expected in females (SMR: 1.00, 95% CI: 0.88–1.24).
For male workers, there was no SMR found to be signifi-cantly increased. The SMRs of small intestine cancer, cancer
TABLE 3. SMRs for all types of cancers based on entire cohort without any exclusion
Male Female
Cancer site Obs Exp SMR 95% CI Obs Exp SMR 95% CI All cancers 66 101.69 0.65 0.50∼0.83 250 249.27 1.00 0.88∼1.14 Lip, oral cavity, and pharynx (A08) 6 14.24 0.42 0.15∼0.92 10 14.17 0.71 0.34∼1.30 Oesophagus (A090) 0 3.34 0.00 NA 0 0.83 0.00 NA Stomach (A091) 7 7.54 0.93 0.37∼1.91 24 21.64 1.11 0.71∼1.65 Small intestine, including duodenum (A092) 1 0.37 2.68 0.04∼14.92 1 1.00 1.00 0.01∼5.54 Colon (A093) 3 4.59 0.65 0.13∼1.91 19 13.95 1.36 0.82∼2.13 Rectum, rectosigmoid junction and anus (A094) 2 2.72 0.73 0.08∼2.65 13 7.80 1.67 0.89∼2.85 Liver, specified as primary (A095) 0 0.69 0.00 NA 0 0.57 0.00 NA Pancreas (A096) 1 2.04 0.49 0.01∼2.73 5 3.60 1.39 0.45∼3.25 Other digestive organs and peritoneum (A099) 23 32.41 0.71 0.45∼1.07 29 26.80 1.08 0.72∼1.55
Larynx (A100) 0 0.90 0.00 NA 0 0.23 0.00 NA
Trachea, bronchus and lung (A101) 13 14.50 0.90 0.48∼1.53 25 24.81 1.01 0.65∼1.49 Other respiratory and intrathoracic organs (A109) 1 0.67 1.48 0.02∼8.25 2 1.53 1.31 0.15∼4.73 Bone and articular cartilage (A110) 0 0.85 0.00 NA 4 2.45 1.63 0.44∼4.18
Skin (A111) 0 0.24 0.00 NA 0 0.60 0.00 NA
Other malignant neoplasm of skin (A112) 0 0.26 0.00 NA 0 0.42 0.00 NA Breast (A113) 0 0.00 NA NA 51 44.55 1.14 0.85∼1.51 Connective and soft tissue (A119) 0 0.55 0.00 NA 0 1.40 0.00 NA Cervix (A120) 0 0.00 NA NA 21 26.40 0.80 0.49∼1.22
Placenta (A121) 0 0.00 NA NA 0 0.69 0.00 NA
Uterus, other and unspecified (A122) 0 0.00 NA NA 5 5.48 0.91 0.29∼2.13 Ovary (A123) 0 0.00 NA NA 7 8.80 0.80 0.32∼1.64
Prostate (A124) 0 0.66 0.00 NA 0 0.00 NA NA
Testis (A125) 0 0.12 0.00 NA 0 0.00 NA NA
Bladder (A126) 1 1.04 0.96 0.01∼5.36 1 1.04 0.96 0.01∼5.33 Kidney and other and unspecified urinary organs (A129) 0 1.31 0.00 NA 3 2.55 1.18 0.24∼3.44 Brain (A130) 1 2.09 0.48 0.01∼2.66 6 6.56 0.91 0.33∼1.99 Other and unspecified sites (A139) 0 2.21 0.00 NA 3 7.50 0.40 0.08∼1.17 Hodgkin’s disease (A140) 0 0.11 0.00 NA 1 0.45 2.23 0.03∼12.40 Leukemia (A141) 2 4.55 0.44 0.05∼1.59 8 14.71 0.54 0.23∼1.07 Other lymphatic and haemopoietic tissue (A149) 5 3.92 1.27 0.41∼2.97 10 8.76 1.14 0.55∼2.10
Abbreviations: Obs⫽ observed; Exp ⫽ expected; NA ⫽ not applicable.
of other respiratory organs, and cancer of other lymphatic and hemopoietic tissue were non-significantly increased (SMR⬎ 1.0). For female workers, there was also no SMR found to be significantly increased. SMRs for cancers of stomach, colon, rectum, pancreas, other digestive organs, other respiratory organs, bone and articular cartilage, breast, kidney and other urinary organs, and other lymphatic and hemopoietic tissue, as well as Hodgkin’s disease were non-significantly increased. The SMRs for several cancers found to be non-significantly increased could have been influ-enced by the small number of deaths.
SMR Analysis Using Different Exclusion Criteria of Minimal Duration of Employment and Latent Period Further analysis was applied with exclusion criteria of mini-mal duration of employment and latent period of 3 months, 6 months, 1 year, and 5 years, respectively (data not shown). After adjustment for age and calendar year, all SMRs among both male and female groups showed statistically non-significant and were similar to the SMRs based on the all
workers without any exclusion. No significant SMR was found for any type of cancers. The risk of female breast can-cer was also not significantly increased.
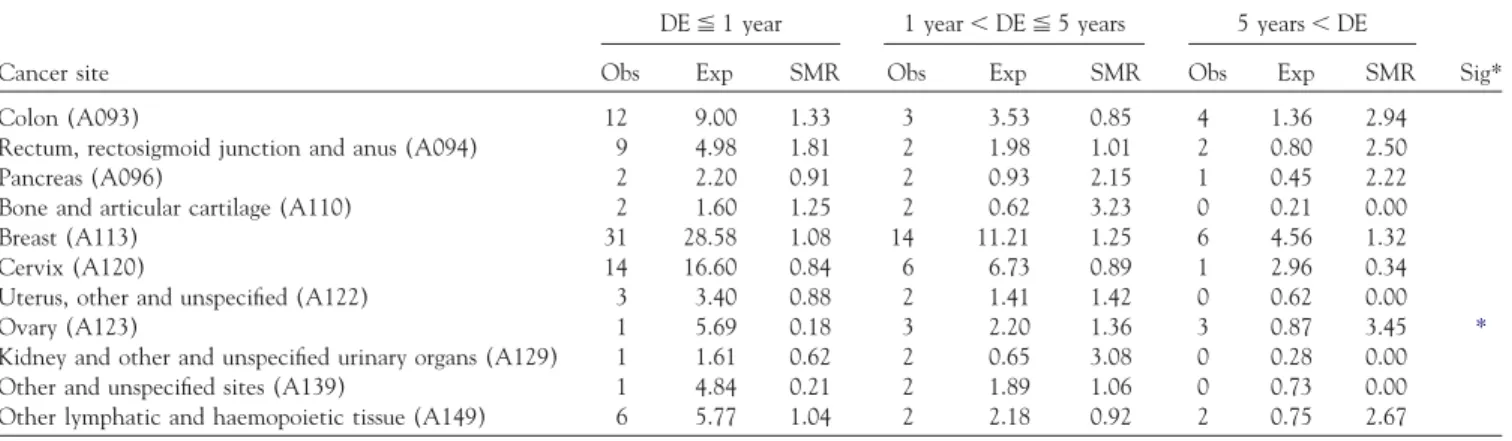
Trend Analysis on Calendar Year and Duration of Employment
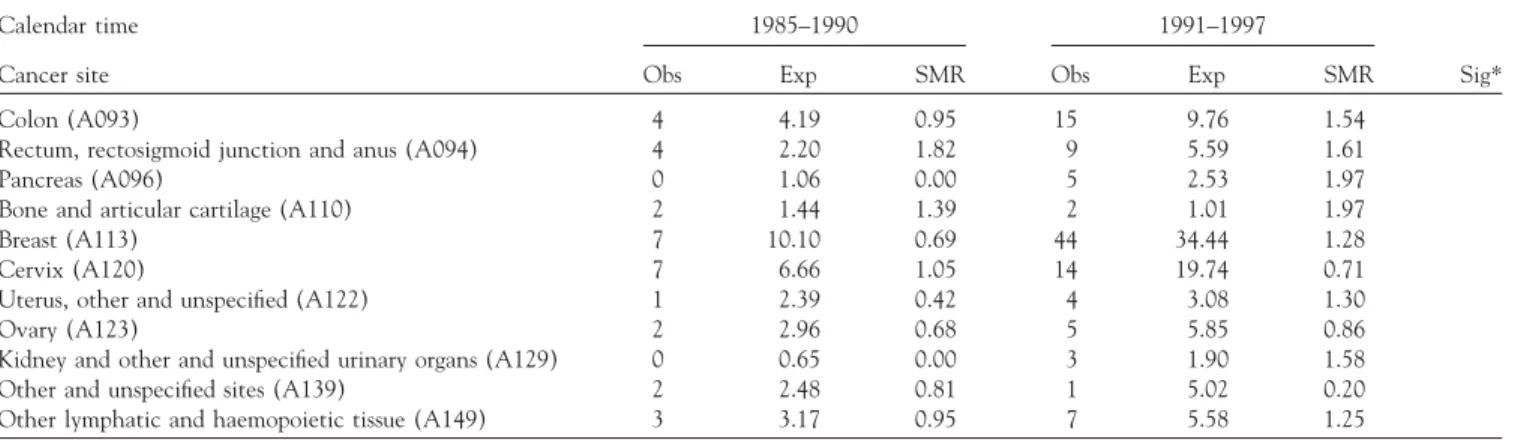
Although SMRs for all types of cancers were found not significantly increased, a further trend analysis was per-formed on the variables of duration of employment (3 in-tervals) and calendar year. Only cancer sites with at least 3 deaths were included in trend analysis. No trend was found for male cancers. Ovarian cancer showed a dose– response relationship with duration of employment (Table 4). None of the other above-mentioned cancers that were non-significantly increased in SMR showed a dose– response relationship with duration of employment. It was also found that no specific cancer showed a significant dose–response relationship in relation to periods by calendar year (Table 5).
DISCUSSION
Epidemiological studies of TCE and PCE exposed workers have shown an excess of several cancers, including liver (6–9), cervical(6, 9, 10), bladder(9–13)and lung cancers(6, 10, 14), as well as leukemia(6, 11)and Hodgkin’s disease (10). The results obtained in the present study do not seem to indicate any increased cancer risk from exposure to TCE and PCE. Hence, these findings do not support a causal link between cancer risk and TCE or PCE exposure. In addition to no significant association, no clear dose– response relationship, and inconsistence between male and female groups also support the non-causal relationship found in the previous PCMR study. In this study, there was no death from primary tumors of the liver, which is the
TABLE 4. Dose-response relationship between SMR and duration of employment
DE⬉ 1 year 1 year⬍ DE ⬉ 5 years 5 years⬍ DE
Cancer site Obs Exp SMR Obs Exp SMR Obs Exp SMR Sig* Colon (A093) 12 9.00 1.33 3 3.53 0.85 4 1.36 2.94 Rectum, rectosigmoid junction and anus (A094) 9 4.98 1.81 2 1.98 1.01 2 0.80 2.50 Pancreas (A096) 2 2.20 0.91 2 0.93 2.15 1 0.45 2.22 Bone and articular cartilage (A110) 2 1.60 1.25 2 0.62 3.23 0 0.21 0.00 Breast (A113) 31 28.58 1.08 14 11.21 1.25 6 4.56 1.32 Cervix (A120) 14 16.60 0.84 6 6.73 0.89 1 2.96 0.34 Uterus, other and unspecified (A122) 3 3.40 0.88 2 1.41 1.42 0 0.62 0.00 Ovary (A123) 1 5.69 0.18 3 2.20 1.36 3 0.87 3.45 *
Kidney and other and unspecified urinary organs (A129) 1 1.61 0.62 2 0.65 3.08 0 0.28 0.00 Other and unspecified sites (A139) 1 4.84 0.21 2 1.89 1.06 0 0.73 0.00 Other lymphatic and haemopoietic tissue (A149) 6 5.77 1.04 2 2.18 0.92 2 0.75 2.67
Abbreviations: DE⫽ duration of employment; Obs ⫽ observed; Exp ⫽ expected; NA ⫽ not applicable. *chi-square test for SMR trend has a probability p⬍ 0.05.
tumor related most clearly to TCE and PCE exposure in the animal studies. This disparity between animals and humans is probably due to the difference between species in the degree of conversion from PCE to trichloroacetic acid, a hepatic carcinogen in animals. Another possibility is due to the difference in the degree of proliferative re-sponses to trichloroacetic acid(18–21).
Although SMRs for all types of cancers were not found significantly increased, ovarian cancer showed a dose– response relationship with duration of employment. The dose–response relationship of ovarian cancer may be due do a biased result. First, our assumption of length of employ-ment may lead to misclassification. Furthermore, because of the small number of deaths, even if only one or two cases were misclassified in relation to length of employment, the trend may disappear entirely.
The role of occupational risk factors in the cause of renal cell carcinoma (RCC) is poorly understood. Although RCC is not commonly considered an occupational cancer, a number of occupational risk factors have been suggested, for example, dry cleaning and laundry workers have been found to have an elevated risk of RCC. Although ex-cesses for cancer of the urinary system has been found in several studies(8, 11, 13,14, 16), these findings were not consistent. Some of these studies suggested that chlorinated aliphatic hydrocarbons may be associated with risk of RCC (22–27). Recently, an epidemiological critical review of the risk of renal-cell cancer among TCE and PCE exposed workers concluded that “the totality of epidemiological evi-dence clearly does not support RCC existing a causal associa-tion with TCE and PCE.”(27–28)In some of the articles, women employed in the dry-cleaning industry showed an excess risk of RCC (9, 22). In general, associations be-tween solvents and renal cancer are more consistent among women than men(27). The gender differences may be a chance finding based on small numbers or may be due to
TABLE 5. Dose–response relationship between SMR and calendar-year intervals
Calendar time 1985–1990 1991–1997
Cancer site Obs Exp SMR Obs Exp SMR Sig*
Colon (A093) 4 4.19 0.95 15 9.76 1.54
Rectum, rectosigmoid junction and anus (A094) 4 2.20 1.82 9 5.59 1.61
Pancreas (A096) 0 1.06 0.00 5 2.53 1.97
Bone and articular cartilage (A110) 2 1.44 1.39 2 1.01 1.97
Breast (A113) 7 10.10 0.69 44 34.44 1.28
Cervix (A120) 7 6.66 1.05 14 19.74 0.71
Uterus, other and unspecified (A122) 1 2.39 0.42 4 3.08 1.30
Ovary (A123) 2 2.96 0.68 5 5.85 0.86
Kidney and other and unspecified urinary organs (A129) 0 0.65 0.00 3 1.90 1.58 Other and unspecified sites (A139) 2 2.48 0.81 1 5.02 0.20 Other lymphatic and haemopoietic tissue (A149) 3 3.17 0.95 7 5.58 1.25
Abbreviations: Obs⫽ observed; Exp ⫽ expected; NA ⫽ not applicable. *All p values of test for trend were⬎ 0.05.
differences between men and women in body fat content, metabolic activity, and rate of elimination from the body (27). In the present study, the non-significant increase SMR for RCC was only found among female employees.
There are a few studies reporting the increase of colo-rectal cancer in TCE or PCE exposed workers. Except for sedentary occupations and exposure to asbestos fibers, there are few detailed studies(29–31). However, a recent review suggested an association between occupational exposures to chlorinated hydrocarbons and colorectal cancer (32). In addition, a US National Cancer Institute mortality and cancer incidence study of aircraft maintenance workers showed a non-significant excess of colon cancer(33). In our study, the SMR for colon cancer and rectum cancer were found to be non-significantly increased. However, the SMR for colorectal cancer (colon + rectum) was found to be significantly increased.
Breast cancer is one of the most common tumors among Chinese women, and the incidence rate is rapidly increas-ing(34). To the best of our knowledge, none of the results of the animal experiments showed an increased incidence of mammary tumor induced by trichloroethylene or tetra-chloroethylene. Studies to evaluate the relationship be-tween occupational exposure to chlorinated organic compounds and breast cancer were mainly focused on aro-matic hydrocarbons, and rarely involved aliphatic hydrocar-bons. Several studies have found an increased risk of breast cancer among women exposed to aromatic hydrocarbons, including benzene, benz (a) pyrene, dibenz (a,h) anthra-cene, as well as organochlorides, including DDT and PCB, due to their estrogenic activities(35–36). Epidemiological studies of the association between trichloroethylene and tetrachloroethylene exposure and breast cancer were incon-clusive. A proportional mortality ratio study of female dry cleaning and laundry workers in Wisconsin found a reduced proportion of deaths due to breast cancer (9). Another
proportional mortality ratio study of laundry and dry clean-ing workers in Oklahoma also found a deficit of breast cancers(14). The United States National Cancer Institute mortality study of dry cleaners union members found no increased death due to breast cancer(10). A National Insti-tute of Occupational Safety and Health (NIOSH) mortality study of women employed in dry cleaning shops, where PCE was the primary solvent, found a slight but not significant increase in the breast cancer death rate and the incre-ment mainly from exposures occurring 20 or more years prior to the study date (13). A United States National Cancer Institute mortality and cancer incidence study of aircraft maintenance workers also revealed no significant excess of breast cancer(33). Another population-based case-control study conducted by Aschengrau(37)showed that women who had used water contaminated with PCE were more likely to develop breast cancer than those who had not used such water.
Ovarian cancer is another leading cause of cancer among females in Taiwan(34). The majority of women with ovar-ian cancer have no identifiable risk factors; therefore the pathogenesis of the disease remains ill-defined. However, some risk factors have become apparent. The most signifi-cant risk factor is genetic predisposition. Other established risk factors for ovarian cancer include early menarche, late first pregnancy, age at first delivery, and late menopause. Data on socioeconomic status, hormone replacement therapy, alcohol use, and smoking are inconclusive(38). A recent review identified women with academic education, hair-dressers, and beauticians potentially at increased risk of ovarian cancer, while available data do not support excess in nurses and dry cleaning employees (38–39). Excess of ovarian cancer(14, 38, 40) and deficits of ovarian cancer (9, 13, 41)have been found for women in dry cleaning and laundry industries. Asbestos and talc have also been seriously considered as possible causes of ovarian cancer. The avail-able data was scanty and often based on linkage studies or
proportional mortality data in which potential confounders have usually not been recorded(38–39). In our study, the SMR of ovarian cancer is 0.80∼3.09 according to different exclusion criteria of minimal exposure period.
Although these results are mainly null, this study may suffer from the limitations of mortality studies based on the registration data: (1) The follow-up time may be too short to observe occupationally-related cancers; (2) The cohort is very young, thus mortality is not an optimal outcome; (3) The data on employment dates (and sometimes age) were incomplete. The estimated person-years and length of em-ployment was based on several assumptions. Our assump-tions may lead to misclassification. The impact of misclassification of person-years on SMR estimates is small, since the misclassification was relatively small in compari-son to large number of percompari-son-years. However, because of the small number of observed deaths, even if only one or two cases were misclassified in relation to length of employment, the trend may be biased; (4) There is no information pro-vided to the reader on exposure levels to TCE and PCE in the plant; (5) Mortality may not be an accurate reflection of incidence for some cancers of interest; (6) Quantification of exposure was not possible because the job titles or personal exposure measurements were not available. It is possible that risks for cancers may exist for sub-cohorts within the exposure group, and might not be apparent in the overall mortality study; and (7) This study did not control for potential confounders, such as smoking, drinking, reproduc-tive history, and dietary habits. Further data collection of personal characteristics may allow for further analysis through a nested case-control study to determine the risk of developing cancer, adjusting for related confounders.
This study was supported by a grant from the Council of Labor Affairs, the Executive Yuan, Republic of China (ISOH89-M302).
REFERENCES
1. ATSDR. Toxicological Profile for Tetrachloroethylene. Atlanta, GA: Agency for Toxic Substances Disease Registry; 1995.
2. National Cancer Institute. Carcinogenesis Bioassay of Trichloroethylene. Technical Support Series No. 2 (DHEW publication no. (NIH) 76-802). Washington, D.C.: US Department of Health, Education, and Welfare; 1976.
3. National Toxicology Program. NTP technical report on the carcinogenesis studies of trichloroethylene (without epichlorohydrin) in F344/N rats and B6C3F1 mice (gavage studies). Research Triangle Park, N.C.: Department of Health and Human Services, 1983 (NIH publication no. 83-1799). 4. Fukuda K, Takemoto K, Tsuruta H. Inhalation carcinogenicity of
tri-chloroethylene in mice and rats. Ind Health. 1983;21:243–254. 5. Maltoni C, Lefemine G, Cotti G. Experimental research on
trichloroethyl-ene carcinogtrichloroethyl-enesis. In: Maltoni C, Mehlman MA, eds. Archives of Re-search on Industrial Carcinogenesis. v. 5. Princeton, NJ: Princeton Sci. Publ. Co. Inc.; 1986:1–393.
6. Blair A, Decoufle P, Grauman DJ. Causes of death among laundry and dry cleaning workers. Am J Public Health. 1979;69:508–511.
7. Stemhagen A, Slade J, Altman R, Bill J. Occupational risk factors and liver cancer. Am J Epidemiol. 1983;117:443–454.
8. Hernberg S, Korkala M, Asikaine U, Riala R. Primary liver cancer and exposure to solvents. Int Arch Occup Environ Health. 1984;54:147–153. 9. Katz RM, Jowett D. Female laundry and dry cleaning workers in
Wisconsin: Mortality analysis. Am J Public Health. 1981;71:305–307. 10. Blair A, Stevens PA, Tolbert PE, Grauman D, Moran FX, Vaugt J, et al. Cancer
and other causes of death among a cohort of dry cleaners. Br J Ind Med. 1990;47:162–168.
11. Norman JE, Robinette CD, Fraumeni JF. The mortality experience of army World War II chemical processing companies. J Occup Med. 1981; 23:818–822.
12. Brown DP, Kaplan SD. Retrospective cohort mortality study of dry clean-ing workers usclean-ing perchloroethylene. J Occup Med. 1987;29:535–541. 13. Ruder AM, Ward EM, Brown DP. Cancer mortality in female and male
dry-cleaning workers. J Occup Med. 1994;36:867–874.
14. Duh R, Asal NR. Mortality among laundry and dry cleaning workers in Oklahoma. Am J Public Health. 1984;74:1278–1280.
15. IARC. IARC Monographs on the Evaluation of Carcinogenic Risks to Humans. v. 63. Dry Cleaning, Some Chlorinated Solvents and Other Industrial Chemicals. Lyon: International Agency for Research in Cancer; 1995.
16. Liddell FDK. Simple exact analysis of the standardized mortality ratio. J Epidemiol Community Health. 1984;38:85–88.
17. Breslow N, Lubin J, Marek P, Langholz B. Multiplicative models and cohort analysis. J Am Stat Assoc. 1983;78:1–12.
18. Weiss NS. Cancer in relation to occupational exposure to perchloro-ethylene. Cancer Causes Control. 1995;6:257–266.
19. Odum J, Green T, Foster JR, Next PM. The role of trichloroacetic acid peroxisome proliferation in the differences in carcinogenicity of perchloro-ethylene in the mouse and rat. Toxicol Appl Pharmacol. 1988;92:103–112. 20. Herren-Freund SL, Pereira MA, Olson G. The carcinogenicity of trichloro-ethylene and its metabolites, trichloroacetic acid and dichloroacetic, in mouse liver. Toxicol Appl Pharmacol. 1987;90:183–189.
21. Elcombe CR. Species differences in carcinogenicity and peroxisome prolif-eration due to trichloroethylene: A biochemical human hazard assessment. Arch Toxicol. 1985(suppl. 8):6–17.
22. McCredie M, Stewart JH. Risk factors for kidney cancer in New South Wales. IV. Occupation. Brit J Ind Med. 1993;50:349–354.
23. Mandel JS, McLaughlin JK, Schlehofer B, Mellemgaard A, Helmert U, Lin-dblad P, et al. International renal cell cancer study. IV. Occupation. Int J Cancer. 1995;61:601–605.
24. Lynge E, Andersen O, Carstensen B. Primary liver cancer and renal cell carcinoma in laundry and dry-cleaning workers in Denmark. Scand J Work Environ Health. 1995;21:293–295.
25. McLaughlin JK, Blot WJ, Devasa SS, Fraumeni JF. Renal cancer. In: Schot-tenfeld D, Fraumeni JF Jr, eds. Cancer Epidemiology and Prevention. 2nd ed. New York: Oxford University Press; 1996:1142–1155.
26. Bruning T, Golka K, Makropoulos V, Bolt HM. Preexistence of chronic tubular damage in cases of renal cell cancer after long and high exposure to trichlorothylene. Arch Toxicol. 1996;70:259–260.
27. Dosemeci M, Cocco P, Chow WH. Gender Differences in risk of renal cell carcinoma and occupational exposures to chlorinated aliphatic hydro-carbons. Am J Ind Med. 1999;36:54–59.
28. McLaughlin JK, Blot WJ. A critical review of epidemiology studies of trichloroethylene and perchloroethylene and risk of renal cell cancer. Int Arch Occup Environ Health. 1997;70:222–231.
29. Colditz GA, Cannuscio CC, Frazier AL. Physical activity and reduced risk of colon cancer: implications for prevention. Cancer Causes Control. 1997;8:649–667.
30. Homa DM, Garabrant DH, Gillespic BW. A meta-analysis of colorectal cancer and asbestos exposure. Am J Epidemiol. 1994;139:1210–1222. 31. Goldberg MS, Parent ME, Siemiatycki J, Desy M, Nadon L, Richardson
L, et al. A case-control study of the relationship between the risk of colon cancer in men and exposure to occupational agents. Am J Ind Med. 2001;39:531–546.
32. Lashner BA, Epstein SS. Industrial risk factors for colorectal cancer. Int J Health Serv. 1990;20:459–483.
33. Blair A, Hartge P, Stewart PA, McAdams M, Lubin J. Mortality and cancer incidence of aircraft maintenance workers exposed to trichloroethylene and other organic solvents and chemicals: extended follow up. Occup Environ Med. 1998;55:161–171.
34. Department of Health. 1997 Cancer Registry Annual Report, Republic of China. Department of Health, the Executive Yuan, R.O.C.; 2000. 35. Morris JJ, Seifter E. The role of aromatic hydrocarbons in the genesis of
breast cancer. Med Hypotheses. 1992;38:177–184.
36. Wolff MS, Toniolo PG. Environmental organochlorine exposure as a poten-tial etiologic factor in breast cancer. Environ Health Perspect. 1995;103(suppl. 7):141–145.
37. Aschengrau A, Paulu C, Ozonoff D. Tetrachloroethylene-contaminated drinking water and the risk of breast cancer. Environ Health Perspect. 1998;106(suppl. 4):946–953.
38. Kaisa VN, Pukkala E, Paakkulainen H, Mutanen P, Weiderpass E, Boffetta P, et al. Ovarian cancer and occupational exposure in Finland. Am J Ind Med. 1999;36:83–89.
39. Shen N, Weiderpass E, Anttila A, Goldberg MS, Vasama-Neuvonen KM, Boffeta P, et al. Epidemiology of occupational risk factors related to ovarian cancer. Scand J Work Environ Health. 1998;24:175–182.
40. Lynge E, Thygesen L. Primary liver cancer among women in laundry and dry-cleaning work in Denmark. Scand J Work Environ Health. 1990;16:108–112.
41. Walker JT, Burnelt CA, Lalich NR, Sestito JP, Halperin WE, et al. Cancer mortality among laundry and dry cleaning workers. Am J Ind Med. 1997;32:614–619.