An intelligent image retrieval system by integrating multiple features with a fuzzy adaptive resonance theory network
11
0
0
全文
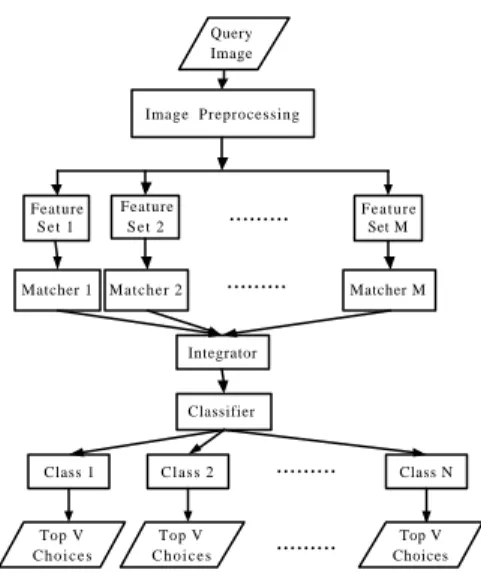
(2) Another is the Photobook system [2] that was made by MIT Media Laboratory. It is a set of interactive tools for users to browse and retrieve images with contents. The main idea of the system is semantics-preserving compression. Users can query similar images based on both text annotations and image features. The system can extract multiple features of an image, which support users to select and combine them. Then the features are compressed into a small set of perceptually important coefficients to represent all the spirit of the image. The third is the Virage system [3] that was developed by Virage, Inc. This system also supports multiple kinds of visual queries, such as color, texture, and object boundary information. Users can arbitrarily combine the above three atomic queries and adjust the weights associated with the atomic features according to their special requirements. The Virage system also provides global or local extraction of image properties with different distance metrics. There are many other content-based image retrieval systems in the world to solve all kinds of demands about managing image databases. The three systems introduced above are the famous beginners in this research area. However, such various feature extraction and image matching techniques are not perfect as human eyes and brains can do. Hence, many scientists still concentrate on the research of feature extraction, for example, the histogram intersection technique [4], reference color table technique [5], and color distance function [6]. On the research of image segmentation and region description, there are the texture discrimination [7], [8], wavelet descriptors [9]-[11], B-spline contour representation [12], and hierarchical spatial region segmentation [13]. On the research of artificial intelligent classification, it includes the hidden Markov mode [14], the neural network [15], and the fuzzy cluster system [16], Bayesian analysis [17], and so on. Additionally, there exist some methods to integrate the above techniques [18]. Using the aforementioned techniques, the abilities of object classification and discrimination cannot compete with human perception yet, especially for deformed objects. In our system, we intend to find the most important part that contains all the subjects in an image. And we record every attributes of this part, such as color, shape, layout, and sketch information. Thus we can use these attributes to represent the original meaning of the input image and cluster similar images by an artificial intelligence technique.. 2. Our Proposed Method To retrieve images, our proposed method is inclusive of three stages. The first stage is query and input images preprocessing. We separate their color information into hue, saturation, and intensity attributes for every pixel. Then we can adopt the intensity value to detect edges. Using these edges we can classify where are noises and remove them. So, we can find the largest useful edge from reserved ones . The basic idea of this stage is that one or many subjects are within an image and only one of them is surrounded with the largest boundary. We assume this part is enough to represent the whole image and can relieve confusions from the background. Following is the second stage to recognize patterns in the main part of the image. At this stage, the major motivation is to digitize the part and transform its color, shape, layout, and sketch information into numerals that act as the indices for our image database. We can further use different weight sums of the original numerals to classify and cluster various types of images. When we give an image to a child, he or she will find whether it has a similar match in his or her brain. If the answer explicitly exists, the child will reply correctly. If the answer does not exist, conversely, the child will learn and generate a new class to categorize the image. And when the child meets an image similar to that again, he or she also can answer correctly. But, if the answer is ambiguous, the child will preprocess the image and find the most similar match to guess what it is. Human bra ins are easily tired and affected by external factors, so boring jobs resorted to computers are appropriate. However, computers do not have the abilities like human being. Therefore , it is very important to develop artificial intelligence techniques. Such methods must be stable and flexible. Moreover, they need efficiency and effectiveness. At the third stage, we adopt an artificial intelligence method to automatically classify and cluster the images in the database. In our system, both query and stored images are processed in the same way. Figure 1 shows a block diagram of our proposed image retrieval scheme.. 3. Feature Extraction and Digitization Our developed system intends to help users classify all kinds of images easily, such as binary images, gray images, and color images. Some useful utilities are contributive to build our system. We will apply these utilities to preprocess the images that people want to retrieve or categorize them in their image databases..
(3) Query Image. Image Preprocessing. Feature Set 1. Feature Set 2. Matcher 1. Matcher 2. ......... .......... Feature Set M. (a). Matcher M. Integrator. Classifier. Class 1. Class 2. .......... Class N. Top V Choices. Top V Choices. .......... Top V Choices. (b). (c). (c). Figure 1 A hierarchical image-retrieval system.. 3.1 Image segmentation When we obtain an image, it may be artificial or natural. We want a fair and justice way to classify it correctly. To accomplish this, we first convert the image from the RGB mode to the HSI mode. In general, we categorize images into five types roughly at the beginning. 1) Binary images These digital images are composed of two discrete numbers like 0 and 1. Figure 2(a) gives an example. 2) Gray artificial vector images Without color information, these images only use intensity to describe objects and have definite backgrounds. Figure 2(b) is an example. 3) Gray complex background images Although 2-D gray images are usually represented by 256 values (0-255) only, human still can discriminate them; for example, Fig. 2(c) shows a flower in a picture. 4) Color artificial vector images Like Fig. 2(d), we can see that it is a blue shirt. If we just apply its contour, we will guess it a shirt. But, when adding color information, we can know it is a blue shirt surely. 5) Color natural scene images Human eyes can discriminate colors, so our life is more colorful. It is impressive that we see a bird feeding its nestlings shown in Fig. 2(e). Of the five types of images, we can know only the color information of 5) plays a significant role. Hence, how to segment regions well from the intensity of an image is very important.. Figure 2. (d) (e) Five types of images: (a) binarization; (b) gray artificial vector; (c) gray complex background; (d) color artificial vector; (e) color natural scene.. 3.1.1 edge detection After separating the intensity from the color information, both hue and saturation are reserved to use later. Then we adopt the Sobel operator [19] to perform edge detection on a 2-D array of the intensity value for every pixel. Taking Fig. 2(c) as an example, we can acquire its energy image consisting of detected edges. But, such an image may not be smooth or have noises in the XY plane. Therefore, we employ a 3 x 3 median filter to reduce noises and yield a smoother image S.. Figure 3 The resulting image S from Fig. 2(c) after edge detection and noise reduction.. As is shown in Fig. 3, the image S already locates edges adequately. However, the energy is distributed non-uniformly in which some places are high and some are low. This causes some edges are evident, and the others are uncertain. Consequently, we need a dynamic threshold G to enhance real edges. Equation (1) depicts the threshold:.
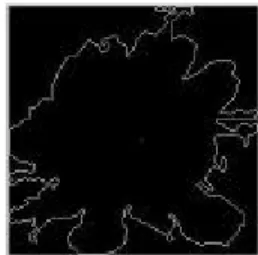
(4) n. Γ =. m. ∑ ∑ S ( x, y ) x= 1 y = 1. nm. ,. (1). where n and m are the height and width of the input image, respectively. Notice that S(x, y) is the energy of the pixel at (x, y). Although the threshold G is the mean of the 2-D array of the energy, it is a useful watershed to discriminate edges when an input image is either too dark or too light or its intensity is distributed over a small region. Nevertheless, there still remain some edges that human can dis tinguish them easily but our system does not. So, we require a wider region to avoid losing edges. It is a good choice of decreasing the threshold G by 1/3. If S(x, y) > 2/3G, we take the corresponding pixel at (x, y) as an edge point denoted 1, or else denoted 0. Then we can obtain a binary image B comprising edges. Equation (2) reveals the above manipulation. 1 if S ( x, y) > 2 / 3Γ B( x , y ) = (2) 0 otherwise. However, an image maybe has heavy variation in intensity at many places. It will make many false edges everywhere such that more than 60% pixels are denoted 1 in B. We need a stricter threshold to diminish false edges, so the original threshold G is again used in order to attain better results of edge detection. 3.1.2 edge recording When recording the positions of edge points and connecting the components of objects, we perform two operations to guarantee their continuity. First, we apply a four-direction (up, down, le ft, and right) dilation operator. Second, a 3 x 3 median filter is well to smooth sharp parts. Then boundary extraction is executed to obtain detailed skeletons of every object. Figure 4 demonstrates the result of Fig. 3 through the operations mentioned above.. recording operation, which comprises a set of boundary rings AP (p = 1, 2, … , m) containing boundary point coordinates without noises and insignificant parts.. Figure 5 The resulting image from Fig. 4 after the edge recording process.. 3.2 Feature extraction In our system, the boundary point coordinates are very useful. They will be employed to achieve many feature digitization tasks. Four sets TP (top), BP (bottom), LP (left), and RP (right) are respectively derived from the border values of the extent of AP . By means of these four sets, we can classify all AP into two classes : set Ci (i=1, 2, … , m1 ) and set Dj ( j=1, 2, … , m2 ), where the former is not contained by other boundary rings, and the latter is surrounded with some others. It is noted that the definition of “contain” is Ti ≤ Tj , Bi ≥ Bj , Li ≤ Lj , and Ri ≥ Rj for i≠j. In other words, the top, bottom, left, and right values of the element in set Ci all satisfy the above definition. After the set Ap is successfully grouped into sets Ci and Dj , we reserve set Dj to use later in the system, because the element in set Ci is more significant for us since it is disconnected with each other. Therefore, we want to find the most important element E in set Ci . The selection rule is that E has the maximum number of boundary points in set Ci . In the normal situation, the element E contains the main part that is composed of the maximum contour in an image. Additionally, the centroid point Ec ( xc , y c ) of the contour can be computed by averaging the coordinates of its constituting boundary points. Figure 6 shows the maximum contour in Fig. 5 and its centroid point.. Figure 4. The resulting image from Fig. 3 after morphological dilation, median filtering, and boundary extraction.. As Fig. 4 shows, we can see there are many boundary rings. The largest ring contains several small ones inside, which almost keeps the whole part of the flower excluding from the background of the original image. Subsequently, we record the meaningful boundary rings in the XY plane to determine which one is required. Figure 5 is the result of Fig. 4 through the edge. Figure 6 The maximum contour E and its centroid point resulting from Fig. 5.. In Fig. 6, the image is divided into two regions. The closed region is the main part of the image, and the other is regarded as the.
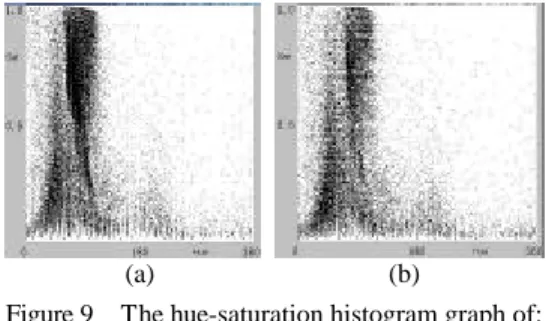
(5) background. As a result, we remove the points that belong to the background to increase the significance of the main part when we perform feature digitization. We can also use this closed region to choose the boundary rings in set Dj that are contained with set E. Then such selected boundary rings constitute set Fl (l=1, 2, … , m3 ).. will not be available if we do not convert them into digital data. In our image database, the digital data are good utility tools for indexing. By appropriate processing, we can use them to retrieve similar images in the database. Following is three kinds of operators employed in our system.. From set Fl , we can know the inner structure of the main part, and number m3 will be served as an index called the inside contours number in our database. Figure 7 shows the boundary rings contained with the maximum contour in Fig. 5.. 3.3.1 moment invariants By use of the equations introduced in [20], we can represent the size, direction, centroid, and some other features of the object in an image with seven moment invariants. 3.3.2 color bins. Figure 7 The boundary rings set Fl together with set E resulting from Figs. 5 and 6.. There are some other features remaining in the original image. So, we need restore the original pixels surrounded with set E to extract other features in this part. Many kinds of techniques are used to restore such a part, but we must confirm that all the desired contents are included and the others are not. Therefore, we adopt a method to appropriately segment the part from the background by using set E. First, we separate the elements of set E into two sets. One contains the first and the last points in every row, and the other includes the first and the last points in every column. Second, we link their first and last points in every row and column of these two sets. Thus, we can acquire two 2-D arrays about the row and column factors of the main part in the image. Finally, we apply the AND operator to combine these two 2-D arrays. According to the outcome, we can segment the main part and the background successfully. Figure 8 is the segmentation result after the above operations performed on Fig. 2(c).. Figure 8 The resulting image of Fig. 2(c) by segmenting the main part and the background.. 3.3 Feature digitization When we obtain the most significant part and all its associated features in an image, they. If the input image has color information, we can obtain a 2-D array that records the histogram of hue and saturation values illustrated by a gray image. In addition, we can use our system to moderate the color information of the background. Figure 9(a) shows the huesaturation histogram graph of Fig. 2(c), while Fig. 9(b) shows the hue-saturation histogram graph of Fig. 8. As we can see, many background points have been deleted. To facilitate the operation of color bins, we need quantify the hue and saturation values into 37 and 5 bins, individually. Then we can apply them to measure the degree of color similarity between two images in the database.. Figure 9. (a) (b) The hue-saturation histogram graph of: (a) Fig. 2(c); (b) Fig. 8.. 3.3.3 Fourier descriptors Fourier descriptors emphasize the shape of the object in an image. By means of Fourier transform, we can convert the sequence of the boundary points in set E into the frequency domain. Consequently, we choose fifty lowfrequency coefficients and compute their spectra. But, Fourier descriptors have some basic properties mentioned in [20]. We need to change the sequence of the boundary points in set E to adapt the properties. By taking the centroid point Ec ( xc , yc ) as the new origin of the coordinates, we can solve the translation problem. We can also find the farthest point in set E from Ec ( xc , yc ) , and rearrange the sequence of the boundary points by using such a point as the starting one. As a result, we can surmount the.
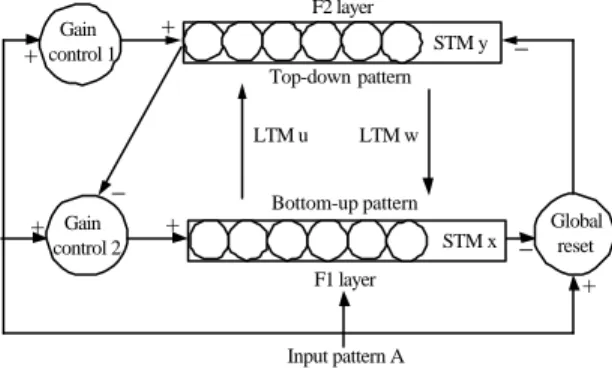
(6) starting point and rotation problems. To overcome the scaling problem, we can adjust the fifty spectra to have identical energy with those of the other images in the database. Figure 10 shows the reconstruction result of Fig. 6 through Fourier descriptors with the same number of the boundary points.. a system that is made up of two subsystems, one being the attention subsystem, and this contains the unit for gain control. The other is an orienting subsystem, and this contains the unit for reset. During the operation of the network modeled, patterns emerge in the attention subsystem, which are called traces of short-term memory (STM x & y). Besides, traces of long-term memory (LTM u & w) are the connection weights between the input layer (F1 layer) and output layer (F2 layer). +. Gain control 1. F2 layer. +. STM y. −. Top-down pattern. Figure 10. The reconstructed image of Fig. 6 by Fourier descriptors.. 4. Artificial Intelligent Classification Scheme When we have the feature data of a query image, we can just adopt the Euclidean distance as a measure standard to retrieve similar images in a large database. Nevertheless, our system produces four kinds of feature data: moment invariants, Fourier descriptors, color bins, and inside contours number. And it is implemented to process and categorize five types of images, such as binarization, gray artificial vector, gray complex background, color artificial vector, and color natural scene. Therefore, we need an efficient and effective method to classify and cluster them when they are inputted and stored into our image database.. 4.1 Adaptive resonance theory In our proposed system, the images inputted and stored into a database are classified and clustered by an unsupervised classification process. It is more convenient to retrieve similar images because the process is coincided with the manner of a person identifying objects. The Adaptive Resonance Theory (ART) [21]-[23], developed further by Grossberg and Carpenter, is for the categorization of patterns using a competitive learning paradigm. And a criterion is realized to facilitate the occurrence of the winner-take-all phenomenon. In the light of its basic working principle, we can know that it could satisfy our demands in the system. The ART is an unsupervised learning paradigm, and it can be applied to the selforganization of a set of fuzzy data. There already exist many kinds of ART models to solve clustering problems . Among of them, the ART 1 model is the most typical one of ART networks, which can be used to cluster and recognize bi-level patterns. In the ART 1 model [24], shown in Fig. 11, the neural network establishes. LTM u. − + Gain. LTM w. Bottom-up pattern. +. Global. STM x. control 2 F1 layer. − reset +. Input pattern A. Figure 11. A simplified diagram of the neural network for an ART 1 model.. 4.2 Fuzzy adaptive resonance theory The fuzzy ART model [25] is an algorithm derived from the ART 1 model by Carpenter, Grossberg, and Rosen developed in 1991. The principle of the fuzzy ART model is similar to that of the ART 1 model. But, the main distinction between fuzzy ART and ART 1 models is that they apply different work operators and handle unlike patterns. The ART 1 model concentrates on processing bi-level information, such as classifying and clustering binary patterns that consist of 0 and 1 values. However, in the fuzzy ART model, it can be enlarged to process the analog information of fuzzy values like classifying and clustering analog patterns that are composed of values between 0 and 1. This is because the ART 1 model uses the AND gate as a working operator, and the MIN (∧) operator is used in the fuzzy ART model. Therefore, if input patterns are bi-level values, the results from ART 1 and fuzzy ART models are equal. The main characteristic of the fuzzy ART model is that a complementary coder is employed to constrain the infinite increment of the class number.. 4.3 The application of the fuzzy ART model in our system Generally speaking, the histogram intersection operator in [4] is also a useful fuzzy method that not only can classify similar color information but can integrate with other three kinds of feature data in our system. Since our system intends to retrieve five different types of.
(7) images, if we just adopt the Euclidean distance to classify similar images, it will be difficult to determine the vigilance parameter for each type of images. This is because some of them have color information but the others not, and some of them may have definite shapes but the others may be blurred. To accomplish this , we require a suitable way to manage them. In our system, the histogram intersection operator is first used for roughly measuring the similarity degrees of the images in different clusters, and the Euclidean distance is then employed to arrange the detailed similarity order of the images in the same cluster. By way of these operations, we can get the most resemble images in our large database from inter to intra clusters. All the five groups of input or query images can be preprocessed to produce four kinds of feature data, each of which can obtain a similarity value by using the histogram intersection operator or the Euclidean distance. The values derived from the histogram intersection operator will be located in [0, 1] where 1 means the feature data of an input or a query image are the same as those of a stored one, while 0 means completely dissimilar to that. And the values derived from the Euclidean distance are always positive and contain zero if the feature data of an input or a query image and a stored one are the same. In consequence, we can know that the histogram intersection operator is suitable to set a vigilance value, and the Euclidean distance is suitable for finding similar images in the same type. The four kinds of feature data of an input or a query image have different characteristics from ~ each other. Seven moment invariants (M i ) can describe all kinds of feature information of an object in the image, such as direction, centroid, size, location, and so on. Fifty Fourier ~ descriptors (Fr ) can interpret the contour of the object in detail. One hundred and eighty five ~ color bins ( Cb ) are composed of hue and saturation information of every color pixel of the ~ object. The inside contours number ( I c ) depicts the basic internal construction of the object. Using these four kinds of feature data, we can constitute a learning weight matrix by the fuzzy ART network. And using the histogram intersection operator, the fuzzy ART network will produce four similarity values: Mih, Frh, Cbh, and Ich. When we adopt the ART 1 or fuzzy ART technique to classify images, we usually apply the intensity of a pixel as a weight factor that has the same power in a learning weight matrix. For natural images, they have high-dimensional vectors that are too complex to the ART. techniques. We must reduce these highdimensional vectors into low-dimensional ones. However, this will arise a problem that every vector may have varied power, because input or query images may be different types. For example, binary and gray images do not have color information. In addition, the contour of an object in a complex background will not be easy to detect clearly. Hence, we need multiply different weights to enhance the superiority of every type of images. Equation (3) expresses the contents of the learning weight matrix of the fuzzy ART network employed in our system. For each cluster j, the corresponding element of the learning weight matrix is updated by: W[ j][k] = β ⋅ Bv[k] + (1− β) ⋅W[ j][k], (3) ~ ~ ~ ~ where Bv[k] = [ Mi [k] Fr [k] C b [k] I c [k]] is the stack vector consisting of the feature data of the kth image and β ∈ [0,1] is a learning parameter. Our match functions are given as follows:. ∑W ∑i W. Mih =. where if. ∑W. Mi. Frh =. ∑W. ∑W. 1 ≤i ≤185. [i ][ j ] ∨ Mi [ i ]. ,. (4). ∑W W ∑ i. Fr. Fr. [ i ][ j ] ∧ Fr [ i ] [ i ][ j ] ∨ Fr [ i ]. (5). ,. 1 ≤ ≤ 50. [i ][ j ] ∨ Fr[i ] = 0, then let Frh = 1;. ∑W W ∑ i. Cb. 1 ≤ i ≤ 185. Cb. [ i ][ j ] ∧ Cb [i ] [ i ][ j ] ∨ Cb [i ]. (6). ,. 1 ≤ ≤ 185. Cb. Ich =. [i ][ j ] ∨ Mi[i ] = 0, then let Mih = 1;. 1 ≤ i ≤ 50. Fr. 1≤i ≤50. Cbh =. where if. Mi. [i ][ j ] ∧ Mi [ i ]. 1≤ ≤ 7. 1≤i ≤7. where if. Mi. 1≤ i ≤ 7. [i ][ j ] ∨ Cb[i ] = 0, then let Cbh = 1;. W Ic [ j ] ∧ Ic , W Ic [ j ] ∨ Ic. (7). where if WIc[ j] ∨ Ic = 0, then let Ich = 1. And our vigilance test function in terms of the four match values resulting from Eqs. (4)-(7) is stated below: V = Max ( w ⋅ Mih + w ⋅ Frh + w ⋅ Cbh + w ⋅ Ich) , (8) j*. j. 1. 2. 3. 4. where wl is the weight of the lth match value and w1 + w2 + w3 + w4 = 1. If V * is greater than or j. equal to the vigilance value ρ, then the kth image is categorized into cluster j * ; otherwise, the image is assigned to a new created cluster. In our system, we can find the cluster of the highest similarity ratio by using the match function. There maybe have some images that are similar to a query image. So, we need apply a similarity measure function to determine which one is most resemble to the query image. In our system, we choose the Euclidean distance to discriminate them, but we make some different.
(8) changes. Equations (9)-(12) depict how the Euclidean distance produces four similarity values Mid, Frd, Cbd, and Icd used in the similarity measure function. Mid =. ∑ (W. 1≤ i≤ 7. [ i][ j * ] − Mi [ i ]) 2. Mi. 1 ≤i ≤ 7. ( ∑ Mi [i ]) 2 = 0, then let Mid = 1≤ i≤ 7. Frd =. (. Fr [i ]) ∑ i. ∑ (W. ∑ (W. Mi. [i ][ j * ] − Mi [i ]) 2 ;. 1≤ i≤ 7. (9) Fr. 1≤ i≤ 50. (. [ i ][ j * ] − Fr [ i]) 2. ∑ Fr[i ]). 1≤ i≤ 50. 1≤ ≤ 50. , where if. 2. ∑ (W. = 0 , then let Frd =. 2. , where if. ( ∑ Mi[ i ]) 2. Fr. [ i][ j * ] − Fr[ i ]) 2 ;. 1≤ i≤ 50. (10). ∑ (WCb [i][ j * ] − Cb [i])2 Cbd = 1≤ i ≤185 , where if ( ∑ Cb[ i] ) 2 (. Cb[ i] ) ∑ i. 1≤ i≤ 185. 2. = 0, then let Cbd =. 1≤ ≤185. ∑ (W. Cb. [ i ][ j * ] − Cb [i ]) 2 ;. 1≤ i ≤185. (11) (W Ic [ j * ] − Ic) 2 Icd = , where if Ic = 0 , Ic 2 then let Icd = W Ic [ j * ] 2 .. (12). For the kth image of cluster j* , the similarity measure function is given as:. S[k] = w12 ⋅ Mid+ w22 ⋅ Frd + w32 ⋅ Cbd+ w42 ⋅ Icd,. (13). where wl is the weight of the lth similarity value and w1 + w2 + w3 + w4 = 1. Then we can further employ a sorting operator to arrange the set S[k] to achieve our goal. Our system can process digital images composed of various data from low to high levels . All of them have superiority factors for some features. So, we need enhance the features to manifest their characteristics. Table 1 shows the degrees of weights of the five types of images related to the four kinds of feature data used in our system. Table 1. The Degrees of Weights of Each Type of Images for Different Kinds of Feature Data. Kinds of Feature Moment Fourier Types Data invariants descriptors of Images. Color bins. Inside contours number. Binarization. High. Medium. N/A. Low. Gray artificial vector. Medium. High. N/A. Low. Gray complex background. High. Medium. N/A. Low. Color artificial vector. Medium. High. Low. Low. Color natural scene. Medium. Medium. High. Low. 5. Experimental Results In this experimental. section, results. we demonstrate the obtained from our. developed approach. Every type of images is processed in the same way whenever they act as the input or query images in our retrieval system. The size of each image is automatically scaled into 256 x 256 pixels for the convenience of computing. The testing program can be executed by the operating system Microsoft Windows 98 or 2000 on a personal computer. Since the processor of the personal computer is faster year-by-year, the execution speed of our system processing a query image and retrieving its similar images from a large database can be tolerated nowadays. Because our system adopts the fuzzy ART technique to cluster similar images, some parameters need to be set, such as the vigilance value and the learning parameter. In our experiments, the best result is obtained from the vigilance value set to be 0.95 and the learning parameter set to be 0.5. A h igh vigilance value is to avoid confusion when an image is stored into a large database. As mentioned in Section 4, our system can process five types of images and produce four kinds of feature data. To find the most resemble images, the query image is required to compare with all the images in the database. For the purpose of correct retrieval, we assign weight values carefully according to different types of images and different kinds of feature data. Table 2 shows such values assigned to the five types of images for each kind of feature data in our system. We can use them to accomplish the retrieval task. Table 2 The Weight Values of Each Type of Images for Different Kinds of Feature Data Kinds of Feature Moment Fourier Data invariants descriptors. Color bins. Inside contours number. Binarization. 0.5. 0.4. 0.0. 0.1. Gray artificial vector Gray complex background Color artificial vector Color natural scene. 0.3. 0.6. 0.0. 0.1. 0.6. 0.3. 0.0. 0.1. 0.3. 0.55. 0.05. 0.1. 0.2. 0.25. 0.5. 0.05. Types of Images. To verify the availability of our approach, a set of images serves as experimental data, including 369 binary images, 84 gray artificial vector images, 17 gray complex background images, 520 color artificial scene images, and 126 color natural scene images. Each of them is collected from scanning, hand drawing, photo books, or Internet homepages. Through the categorization of our system, the images are clustered into 895 classes. We make almost the same images get together to refrain from a too fast change of learning weights by a low vigilance value..
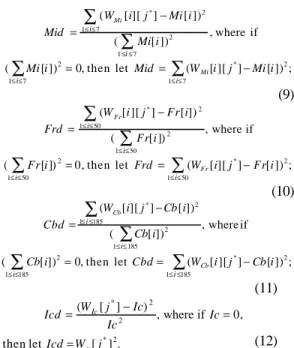
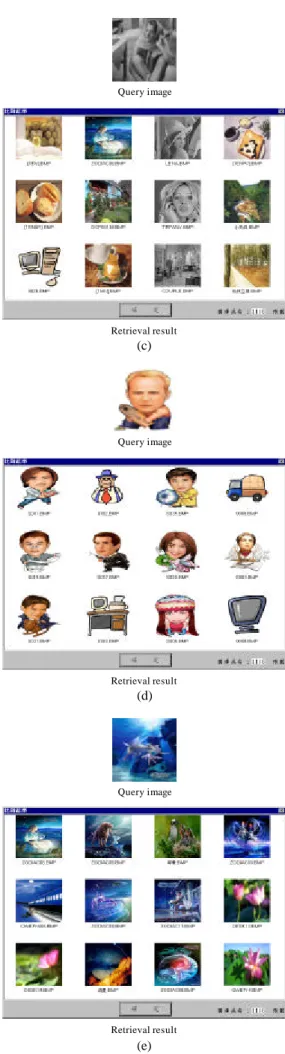
(9) To illustrate experimental results, twelve of the most resemble images are retrieved from the set of images for every query. During the retrieval, if the most similar class does not possess sufficient (12) images inside, we will arrange them in order first. Then we find the second similar class, and arrange the constituting images in order behind the previous class, and so on. Figure 12 shows the retrieval results from querying each type of images. Figure 13 demonstrates the user interface of our system. All the testing programs have been implemented in C++ language by using the Borland C++ Builder 5.0 compiler.. Query image. Query image. Retrieval result. (c). Query image. Retrieval result. (a). Query image. Retrieval result. (d). Query image. Retrieval result. (b). Figure 12. The retrieval result from querying: (a) a binary image; (b) a gray artificial vector image; (c) a gray complex background image; (d) a color artificial vector image; (e) a color natural scene image.. Retrieval result. (e).
(10) type of images for different kinds of feature data. Various weights assignment is conducive to discriminate the five types of images. Then we can complete subsequent tasks well. In the future, we hope the weights can be assigned by the system automatically and the kinds of feature data can be moderated for speeding up the process in our system.. (a). (b). Figure 13 The user interface of our system: (a) a query image displayed on the upper-leftmost corner of the main menu; (b) the retrieval result of (a) displayed in a visual window.. 6. Conclusions and Future Work In this paper, we have presented an intelligent image retrieval system for processing five types of images by integrating multiple features based on a fuzzy ART network. The image retrieval system consists of two processing phases. First, it extracts both color information and geometrical features from an input image. Second, the system applies an artificial intelligence method to classify and cluster similar images by itself. Through this operation on the database, our system can adopt the same path for storing or querying images. Due to such characteristics, we can increase and integrate other useful extraction or retrieval techniques easily. When a new image is inputted into our image retrieval system, we roughly categorize this image into one of five types first. These types include binary images, gray artificial vector images, gray complex background images, color artificial vector images, and color natural scene images. As mentioned in Sections 4 and 5, we empirically assign the best weights to each. Our system can classify and cluster images automatically, which contains 1,116 images grouped into 895 classes. This is the reason why we assign a high vigilance value to avoid error-learning weights that will affect retrieval results for varied images. In the future, if we can acquire some more useful feature data to describe the meaning of an image, we can relax the restriction; that is, a low vigilance value is applied. Then the system can cluster resemble images completely. During the retrieval process, we find the most important part in an image. But, if there are many disconnected parts within an object, we will lose other information. Hence, in the future, we hope we can extract the feature data of all independent parts and link them if they own the same meaning at all. Although our system already can retrieve most of similar images in the database, sometimes it still gives us wrong answers. Therefore, we provide the following viewpoints to improve the ratio of retrieving similar images. First, shape information plays a more significant role than color information does in a content-based image retrieval system. One object may have different colors, but its silhouette is fixed; for example, we have yellow dogs, black dogs, white dogs, and so forth in the world. Moreover, if we just employ color information to analyze image contents, we won’t find what we want correctly. In consequence, we need a color object discriminator to catch the shape of the object accurately, not only use intensity in our system. Second, we just apply a simple edge detector that segments a complex background image to find its most representative part. This is not enough for the content-based image retrieval system. To improve this, we require a segmentation method to automatically separate textures from edges for classifying connected objects. Additionally, the processing time of an image retrieval system is very important, whose performance attains the best if it can execute in real time. Third, we not only discriminate the contour of an object, but also confirm the construction of the object. If we can build the 3-D model of every object and adopt an artificial intelligence method to learn the model, we can correctly find the object in an image with little effort. Using the.
(11) intensity of every pixel in an image, the coarse 3-D model of an object is built to compare with the 3-D models stored in the system. Even if the image is too light or dark, we can use all these 3-D models to restore the edges that have been disappeared. Finally, we intend to store the discriminated images hierarchically, and record all the feature data of the objects in the images. Then some of these feature data can be employed to complete any kind of combinations to retrieve similar images in the database. Building a hierarchical semantic system is helpful for the retrieval operation. The interface of our system is too simple yet, so we want a much more userfriendly one. How to economize the processing time is very important for us. For practical use, we need accelerate the execution speed of the system as fast as we can. Internet has been popular today, so we can develop a distributed system by a network. As a result, we can find the desired images from Internet easily. In a word, our present system is only a prototype and we still need work hard to make this intelligent image retrieval system function as same as a human vision system.. References [1]. M. Flickner et al., “Query by image and video content: the QBIC system,” IEEE Comput., vol. 28, no. 9, pp. 23-32, 1995. [2] A. P. Pentland, R. W. Picard, and S. Sclaroff, “Photobook: tools for content-based manipulation of image databases,” in Proc. of SPIE, vol. 2368, 1995, pp. 37-50. [3] J. R. Bach et al., “Virage image search engine: an open framework for image management,” in Proc. of SPIE, vol. 2670, 1996, pp. 76-87. [4] M. J. Swain and D. H. Ballard, “Color indexing,” Int. J. Comput. Vision, vol. 7, no. 1, pp. 11-32, 1991. [5] B. M. Mehtre et al., “Color matching for image retrieval,” Pattern Recogni. Letters, vol. 16, no. 3, pp. 325-331, 1995. [6] J. Hafner et al., “Efficient color histogram indexing for quadratic form distance functions,” IEEE Trans. Pattern Anal. Machine Intelli., vol. 17, no. 7, pp. 729-736, 1995. [7] B. S. Manjunath and W. Y. Ma, “Texture features for browsing and retrieval of image data,” IEEE Trans. Pattern Anal. Machine Intelli., vol. 18, no. 8, pp. 837-842, 1996. [8] T. Ojala and M. Pietikainen, “Unsupervised texture segmentation using feature distributions,” Pattern Recogni., vol. 32, no. 3, pp. 477-486, 1999. [9] N. Sebe et al., “Color indexing using waveletbased salient points,” in Proc. of IEEE Workshop on Content-based Access of Image and Video Libraries, 2000, pp. 15-19. [10] M. K. Mandal, T. Aboulnasr, and S. Panchanathan, “Fast wavelet histogram techniques for image indexing,” Comput. Vision Image Understand., vol. 75, no. 1, pp. 99-110, 1999.. [11] K. C. Hung, “Generalized uniqueness wavelet descriptor for planar closed curves,” IEEE Trans. Image Process., vol. 9, no. 5, pp. 834-845, 2000. [12] M. A. T. Figueiredo, J. M. N. Leitao, and A. K. Jain, “Unsupervised contour representation and estimation using B-splines and a minimum description length criterion,” IEEE Trans. Image Process., vol. 9, no. 6, pp. 1075-1087, 2000. [13] C. S. Fuh, S. W. Cho, and K. Essig, “Hierarchical color image region segmentation for content-based image retrieval system,” IEEE Trans. Image Process., vol. 9, no. 1, pp. 156-162, 2000. [14] F. S. Chang and S. Y. Chen, “Deformed shape retrieval based on Markov model,” IEE Electr. Letters, vol. 36, no. 2, pp. 126-127, 2000. [15] H. K. Lee and S. I. Yoo, “Neural network-based image retrieval using nonlinear combination of heterogeneous features,” in Proc. of the IEEE Conf. on Evolution. Comput., 2000, pp. 667-674. [16] C. Vertan and N. Boujemaa, “Embedding fuzzy logic in content based image retrieval,” in Proc. of the 19th Int. Conf. of the North American Fuzzy Inform. Process. Soci., 2000, pp. 85-89. [17] I. J. Cox et al., “Bayesian image retrieval system, PicHunter: theory, implementation, and psychophysical experiments,” IEEE Trans. Image Process., vol. 9, no. 1, pp. 20-37, 2000. [18] N. R. Howe and D. P. Huttenlocher, “Integrating color, texture, and geometry for image retrieval,” in Proc. of the IEEE Conf. on Comput. Vision Pattern Recogni., vol. 2, 2000, pp. 239-246. [19] R. Jain, R. Kasturi, and B. G. Schunck, Machine Vision, McGraw-Hill, New York, 1995. [20] R. C. Gonzalez and R. E. Woods, Digital Image Processing, 3rd Ed., Addison-Wesley, Reading, M ass., 1992. [21] S. Grossberg, “Adaptive pattern classification and universal recording, Part I: parallel development and coding of neural feature detectors,” Biol. Cybern., vol. 23, pp. 121-134, 1976. [22] S. Grossberg, “Adaptive pattern classification and universal recording, Part Ⅱ : feedback, expectation, olfaction, and illusions,” Biol. Cybern., vol. 23, pp. 187-202, 1976. [23] G. A. Carpenter and S. Grossberg, “ART3: hierarchical search using chemical transmitters in self-organizing pattern recognition architectures,” Neural Net., vol. 3, no. 2, pp. 129-152, 1990. [24] V. B. Rao and H. V. Rao, C++ Neural Networks and Fuzzy Logic, 2nd Ed., M &T Books, New York, 1995. [25] G. A. Carpenter, S. Grossberg, and D. B. Rosen, “Fuzzy ART: fast stable learning and categorization of analog patterns by an adaptive resonance system,” Neural Net., vol. 4, no. 6, pp. 759-771, 1991..
(12)
數據
+4

相關文件
– Select View Cameras Set Active Object as Active Camera – Load background images. – Set the parameters of
– For each image, use RANSAC to select inlier features from 6 images with most feature matches. •
Example: Image produced by a spherical mirror... 14.5 Spherical
Use images to adapt a generic face model Use images to adapt a generic face model. Creating
• Similar to Façade, use a generic face model and view-dependent texture mapping..
Vetter, Reanimating Faces in Images and Video, EUROGRAPHICS 2003. Seidel, Exchanging Faces in Images,
Retrieval performance of different texture features according to the number of relevant images retrieved at various scopes using Corel Photo galleries. # of top
Examples of thermal image (left) and processed binary images (middle and right) of
