太陽能源應用之美國市場研究 - 政大學術集成
107
0
0
全文
(2) 太陽能源應用之美國市場研究 The Study of Photovoltaic (PV) Solar Energy in the United States 研究生: 貝提畝 指導教授: 黃仁德 教授. Student: Timothy Beal Advisor: Dr. Jen-Te Hwang. 國立政治大學. 政 治 大. 亞太研究英語碩士學位學程. 立. 碩士論文. ‧. ‧ 國. 學 A Thesis. y. Nat. er. io. sit. Submitted to International Master’s Program in Asia-Pacific Studies. n. National Chengchi University a v. i l C n U h e n gofc the h i Requirement In partial fulfillment For the degree of Master in China Studies. 中華民國 102 年 7 月 July, 2013.
(3) Abstract Solar PV energy is one of the fastest growing forms of renewable energy in the world. Since the last decade, the PV market has been expanding rapidly in the United States as a result of government policies, financial incentives, and declines in costs for installed PV systems. PV manufacturers have grown in number in order to meet increasing demand, but global oversupply has made profitability for most PV suppliers in the U.S. challenging. Despite the impressive rate of market growth,. 政 治 大. electricity produced by PV is still not cost-competitive with traditional forms of. 立. electricity generation without government support. An abundant supply of natural. ‧ 國. 學. gas in the U.S. and its growing role as a source of electricity also presents a unique challenge to the development of renewable energies such as solar PV. Nevertheless,. ‧. the PV market continues to expand and is predicted to maintain strong growth over. y. Nat. the next several years in the U.S., even though much uncertainty remains on its. n. al. er. io. sit. long-term prospects.. Ch. engchi. i. i n U. v.
(4) Acknowledgements There are many people I feel a sense of gratitude towards after completing this study. I would like to thank Professor Jen-Te Hwang for his patience and guidance while advising me for my thesis. Thanks to the other committee members, Professor An-Pang Kao and Professor Huey-Lin Lee, for the time they took for my presentations and the advise the offered me. My special friend Enid Wu did much too help me with some of the technical aspects of my thesis format. I would like to thank all of the staff and administrators in the International Master’s Program in. 政 治 大. Asia Pacific Studies and the Office for International Cooperation at National. 立. Chengchi University for all of the assistance they have provided me. I am grateful to. ‧ 國. 學. Emily Shen of the Taipei Economic and Cultural Office in Los Angeles for all that she did to help me with the requirements needed to come to Taiwan for graduate. ‧. study. I would like thank Taiwan’s Ministry of Education for offering me the. y. Nat. generous Taiwan Scholarship. And finally, I would like to give a special thanks to all. n. al. er. io. this wonderful country.. sit. the people of Taiwan for the pleasant experience I have had living and studying in. Ch. engchi. ii. i n U. v.
(5) TABLE OF CONTENTS Abstract ............................................................................................................................................ i Acknowledgements ......................................................................................................................... ii TABLE OF CONTENTS............................................................................................................... iii LIST OF TABLES ......................................................................................................................... vi Chapter 1 Introduction ................................................................................................................. 1 1.1. Motivation and Methodology ............................................................................................. 1. 1.2. Framework ....................................................................................................................... 2. Chapter 2. Fossil Fuels......................................................................................................................... 5. ‧ 國. 學. 2.1. 政 治 大 Energy Use in the United States.................................................................................. 5 立. Petroleum ..................................................................................................................... 5. 2.1.2. Coal.............................................................................................................................. 6. 2.1.3. Natural Gas .................................................................................................................. 6. ‧. 2.1.1. y. Nat. 2.4. Energy Overview.............................................................................................................. 10. 2.5. Summary .......................................................................................................................... 13. n. al. er. sit. Renewable Energy.............................................................................................................. 7. io. 2.2. Ch. engchi. i n U. v. Chapter 3 The Development of Solar Energy around the World .............................................. 15 3.1. Early Developments of Solar PV ..................................................................................... 15. 3.2. Types of Solar PV Technology ........................................................................................ 16. 3.3. Solar Energy Development in Germany .......................................................................... 17. 3.4. Solar Energy Development in Japan ................................................................................ 17. 3.5. Global Growth in Solar Energy ........................................................................................ 18. 3.6. Feed-in Tariffs .................................................................................................................. 20. 3.7. Global Solar PV Manufacturing....................................................................................... 23 iii.
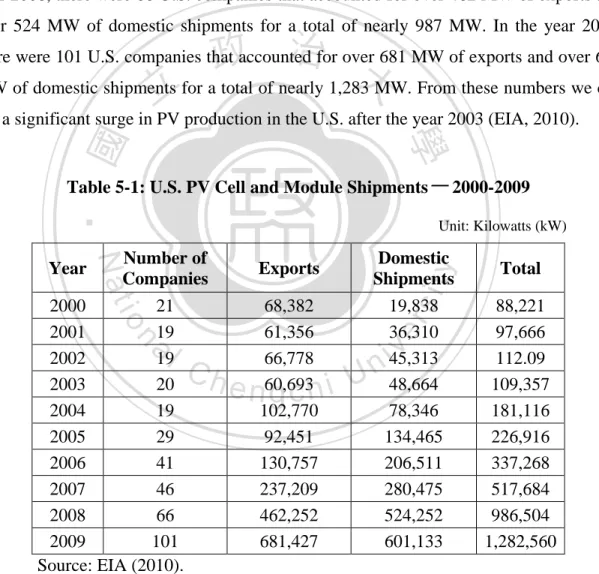
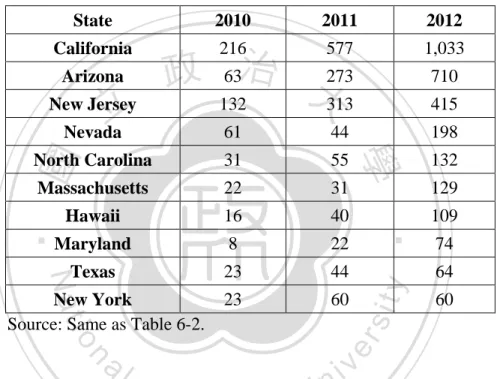
(6) 3.8. Future Outlook for Global Solar PV ................................................................................ 26. Chapter 4 Policies Affecting Solar Energy in the United States ............................................... 31 4.1. Federal Initiatives Supporting Solar PV........................................................................... 31. 4.2. Federal Financial Incentives for Solar PV ....................................................................... 34. 4.4.1. Early Policies That Supported Solar PV in California .............................................. 37. 4.4.2. California Solar Initiative .......................................................................................... 39. 4.5. Summary .......................................................................................................................... 42. Chapter 5 The Supply of Solar PV in the United States ............................................................ 43. 政 治 大. 5.1. The Supply of Solar PV in the 2000s ............................................................................... 43. 5.2. The Supply of Solar PV in 2010 ...................................................................................... 45. 5.3. The Supply of Solar PV in 2011 ...................................................................................... 46. 5.4. The China Factor .............................................................................................................. 51. 5.5. Polysilicon ........................................................................................................................ 54. 5.6. Government Policies for PV Supply ................................................................................ 54. 5.7. Outlook for U.S. PV Suppliers ......................................................................................... 56. 5.8. Summary .......................................................................................................................... 58. 立. ‧. ‧ 國. 學. n. er. io. sit. y. Nat. al. Ch. i n U. v. Chapter 6 The Demand for Solar PV Energy in the United States ............................................ 61. engchi. 6.1. The Decline in Price for Solar PV .................................................................................... 61. 6.2. The Increase in Demand for Solar PV ............................................................................. 66. 6.3. The Leading U.S. States for Solar PV .............................................................................. 70. 6.4. The Outlook and Potential for Future Solar PV Demand ................................................ 72. 6.4.1. Future Decline in Price for Solar PV ......................................................................... 74. 6.4.2. Policy Effects on Future Solar PV Demand .............................................................. 75. 6.4.3. Natural Gas as Potential Competition to Solar PV .................................................... 79. 6.4.4. Smart Meters.............................................................................................................. 81 iv.
(7) 6.4.5 6.5. Other Factors Effecting Demand for Solar PV .......................................................... 82. Summary .......................................................................................................................... 85. Chapter 7 Conclusion and Suggestion ....................................................................................... 87 References ..................................................................................................................................... 93. 立. 政 治 大. ‧. ‧ 國. 學. n. er. io. sit. y. Nat. al. Ch. engchi. v. i n U. v.
(8) LIST OF TABLES Table 2-1: Energy Consumption in the United States-1960-2010 ............................................. 11 Table 2-2: The Distribution of Total U.S. Electricity Generation by Source-2000-2011.......... 12 Table 2-3: The Distribution of U.S. Renewable Electricity Generation-2000-2011 ................. 13 Table 3-1: Global PV Capacity by Country-2010...................................................................... 20 Table 3-2: Global Solar PV Growth Rate ..................................................................................... 21 Table 3-3: Global Solar PV Share of Total Electricity Distribution............................................. 21. 政 治 大. Table 3-4: Top Global PV Cell Manufacturers-2010 ................................................................ 25. 立. Table 4-1: CSI Incentive Types .................................................................................................... 41. ‧ 國. 學. Table 5-1: U.S. PV Cell and Module Shipments-2000-2009..................................................... 44 Table 5-2: U.S. PV Cell and Module Production-2010 ............................................................. 47. ‧. Table 6-1: PV System Installation Prices Per Watt-2010-2012 ................................................. 64. y. Nat. sit. Table 6-2: U.S. PV Annual Increase-2001-2011 ....................................................................... 69. n. al. er. io. Table 6-3: U.S. PV Installations-2000-2012 .............................................................................. 69. i n U. v. Table 6-4: Top U.S. State PV Installations ................................................................................... 73. Ch. engchi. vi.
(9) Chapter 1. Introduction. There are several different types of solar energy technologies. These include: both passive and active solar energy systems, thermal and photovoltaic (PV), and concentrating and non-concentrating energy designs. Passive solar energy makes use of heat and light energy from the sun without converting it into other forms of energy. Active solar energy designs include photovoltaic and solar thermal power. Photovoltaic technology is able to use sun light to stimulate electrons from semiconductor materials to produce electrical current. Heat produced by solar thermal technology can be used for. 治 政 focus my study on solar photovoltaic (PV) technology. 大 立has seen high growth in solar energy utilization in several The last 10 years. heating applications or to produce electricity using other mechanisms. In my thesis I will. ‧ 國. 學. countries in the world. PV solar energy is becoming an emerging new source of energy in these countries for a variety of reasons: the desire to reduce greenhouse gases that cause. ‧. global warming, to offset the negative health effects of air pollution, to develop a more sustainable source of power, to provide increased energy security and limit dependence. sit. y. Nat. on foreign suppliers for energy imports, and in the case of Germany, to provide a safe alternative to nuclear energy, for example. Although Europe has been the leading the. io. er. world in PV power installations for several years, solar power in the United States has. al. n. iv n C Lower PV system priceshover e ntime, h i U with government incentives, has g ccombined. risen sharply over the last few years as well.. encouraged continued growth in the solar PV market in the United States. Although. electricity produced by solar PV is not yet competitive with traditional forms of utility electricity generation without government aid, the outlook for solar PV market growth remains positive despite a reduction in government incentives in some cases. Many factors will influence the economic viability of solar PV electricity generation in the coming years. 1.1 Motivation and Methodology My motivation for this study is a personal interest in the energy dynamics in the United States and how they affect the economy and the way people interact with their 1.
(10) environment. I am interested in the factors that influence the growth of solar PV use in the U.S. and its development as a fast growing sector of the renewable energy market. The purpose of this study is to gain a greater understanding of the PV solar energy market in the United States and its likely developments. I expect the results of my study will demonstrate that the use of solar energy in the United States is likely to increase and become a more important portion of the U.S. energy mix in the future. However, there are still many challenges to PV energy becoming a more mainstream source of electricity, and there are many variables that could affect the PV market either positively or adversely in the future. The methods of my research will consist of evaluating primary data sources and qualitatively analyzing. 政 治 大 conclusions, as well as to touch on current developments in the PV industry. All of the 立. secondary academic sources. I will also use industry reports to supplement my ideas and. dollar amounts given in my thesis will be given in USD.. ‧ 國. 學. 1.2. Framework. ‧. In chapter 2 I will give an overview of energy production and consumption in the United States. I will discuss the main types of power sources used in the U.S. historically,. sit. y. Nat. recently, and what is projected for future use. Fossil fuels have been the primary energy source in the U.S., and coal has been the major source of electricity. Despite the. io. er. prevalence of fossil fuels as a source of energy (electricity in particular), nuclear and. al. n. iv n C U has traditionally been the most h eHydroelectric as a source of electricity generation. n g c h i power. renewable energy use has increased over time. Natural gas has also gained in importance. important source of renewable electricity generation, but wind and solar energy have recently been increasing at a much faster rate. In chapter 3 I will give a brief history of the early developments of the PV solar energy market around the world and how it progressed into a more viable energy source in different regions. Photovoltaic solar cells using silicon were first developed in the United States in the 1950s. PV cells have been an expensive source of electricity since their inception and were not widely used. In the 1960s, Japan started producing the first practical solar modules for some applications, namely for powering lighthouses in remote coastal areas. In the 1970s, solar energy gained new interest during the global energy crisis; this led to more development within the PV industry. The global PV industry 2.
(11) slowly progressed in the 1980s but was still mostly a niche market for off-grid applications. By the year 1999, worldwide production reached 1gigawatt (GW). In the early 2000s, the U.S. was the dominate producer of solar electricity. After 2004, solar electricity in Japan and Germany began to increase substantially, with Germany becoming the world leader in 2006. By the year 2009, Germany was producing more than twice as much electricity from PV cells than any other country. However, due to cuts in government incentives, Germany is projected to command a decreasing share in global PV installations, with China, Japan, and the U.S. increasing their global share of installations. In chapter 4 I will discuss the governmental policies in the United States that. 政 治 大 initiatives I will discuss are the Million Solar Roofs Initiative (MSR), the Solar America 立 encourage the proliferation of PV solar energy. On a federal level, the major PV. Initiative (SAI), and the SunShot Initiative. These federally supported programs have. ‧ 國. 學. been important for encouraging and supporting growth and development in the PV industry. Federal tax credits and cash grants have been vital in supporting the demand. ‧. side of PV energy. After several years of government programs and financial incentives, the United States is developing into one of the larger world markets for PV energy. At the. y. Nat. sit. state level, the California Solar Initiative (CSI) has had a major effect on PV installations.. al. er. io. The financial incentives it offers have done much to make California by far the largest. n. PV market in the nation.. Ch. i n U. v. In chapter 5 I will discuss the factors of the supply of PV solar energy in the. engchi. United States. In the late 1990s, PV shipments by U.S. suppliers started to rise. In 2003, the rate increased and again rose sharply in 2005. The total shipments of both solar cells and modules continued to rise even faster in subsequent years. However, in 2007 imports began to exceed exports and outpaced exports greatly in 2009. The price of both solar cells and modules started to fall substantially due to oversupply in the market. The manufacturing capacity of solar cell and module producers continues to exceed global demand. This has resulted in low spot prices for cells and modules, with prices lower than most suppliers can produce them. The problem of oversupply and excess production capacity will likely continue to plague suppliers for the next couple of years or even longer. 3.
(12) In chapter 6 I will discuss factors of the demand for PV solar energy in the United States. Solar energy consumption in the U.S. remained fairly constant from 1991 to 2006. It began to rise noticeably in 2007 and increased more each year, more than doubling from 2007 to 2011. Federal and state incentives have proven effective in launching solar energy as a high growth market. In the year 2006, California had the third largest solar energy capacity in the world, behind Japan and Germany. Although California is by far the nation’s leading state in solar power installations, several other states have begun to provide their own incentives to encourage growth in solar power use. Solar leasing contracts are becoming popular, and its market is expanding quickly. Solar leasing companies provide another option for customers to purchase solar. 政 治 大 helped to create new demand for residential solar installations. Historically volatile 立 electricity without having to purchase the solar power system themselves. This has. energy prices and predictions of higher energy prices in the future make PV systems an. ‧ 國. 學. appealing investment. Falling PV module prices, combined with greater cell conversion efficiency, has made the price of solar electricity per watt more affordable than ever. ‧. before.. In chapter 7 I will give my conclusion and suggestion for the solar PV market in. y. Nat. sit. the United States. When the cost of producing electricity with PV systems becomes. al. er. io. comparable to utility retail electricity prices, solar power is poised become a more. n. mainstream source of power for consumers. For the meantime, government policies will. Ch. i n U. v. still be important for ensuring the demand for PV energy systems. Because solar modules. engchi. are designed to retain most of their productivity for 25 or 30 years, solar energy is also an attractive option for hedging against not only rising energy prices, but against future inflation of the U.S. dollar as well. PV component manufactures will remain challenged to make profits for the time being, and additional bankruptcies and plant closers are likely. Nevertheless, those that are able to survive the solar shakeout will likely emerge as profitable and competitive enterprises and will be in good position to prosper in a future PV market with higher demand.. 4.
(13) Chapter 2. Energy Use in the United States. This chapter will give a general overview of the types of energy used in the United States. Fossil fuels, nuclear power, and renewable energy are the three main types of energy. Fossil fuels and renewable energy include several different types of energy sources, while nuclear power only consists of nuclear power plants. 2.1 Fossil Fuels Fossil fuels have long been the primary source of energy in the United States. Of. 政 治 大 gas. Petroleum is most important 立 for the transportation sector. Coal is primarily used for. these types of fuels, the main fossil fuels are petroleum-based products, coal, and natural. has become more important for electricity generation.. ‧. 2.1.1 Petroleum. 學. ‧ 國. electricity generation. Natural gas is often used for heating homes, but more recently it. Petroleum products have been the most important source of energy in the United. Nat. sit. y. States. Since 1960, petroleum has accounted for close to 40% of the total energy. io. er. consumption. Annual petroleum consumption nearly doubled from 1960 to 2000, from nearly 20,000 trillion British thermal units (Btus) to over 38,000 trillion Btus. As a power. al. n. iv n C rose to about 40,000 trillion Btushbefore about 37,000 trillion at the end of the e n gdipping c h ito U. source it has increased consistently during this time. Between the years 2004 and 2007, it. decade (U.S. Energy Information Administration (EIA), 2012a). In 2006, petroleum comprised 40 percent of all energy sources consumed (EIA, 2007). In 2010, this number dropped to 37 percent (EIA, 2012b). Petroleum is a major energy source for transportation, accounting for 93% of the energy consumed by that sector (EIA, 2012c). Petroleum as a fuel source for electricity as varied since 1960 but has never been a major source of electricity. It peaked at more than 3,000 trillion Btus in 1975, but never reached close to 2,000 trillion units after the early 1980s. It last reached above 1,000 trillion units in the year 2005 (EIA, 2012a). In the year 2011, it only accounted less than 1 percent of all the energy used to produce electricity in the U.S. (EIA, 2012c). 5.
(14) Domestic crude oil production had been decreasing since the mid-1980s but has been increasing over the last several years. In 2008, the U.S. was producing 5 million barrels of crude oil a day. In 2010, this number rose to 6.5 million barrels a day. Advances in technology combined with tight formations and increased natural gas production have made oil extraction more economically viable. Domestic oil production is expected to continue its strong growth the remainder of this decade before declining gradually after 2020 in anticipation of increased fuel efficiency (EIA, 2013a). In correspondence with decreased domestic oil production in the mid-1980s, net imports of petroleum products increased steadily from that point until the mid-2000s. Since 2005, net imports of petroleum have decreased every year. The downward trend of. 政 治 大 about a third of the total supply of petroleum products in the U.S. (EIA, 2013a). 立. petroleum imports is expected to continue over the next 6 years, but will still account for. ‧ 國. 學. 2.1.2 Coal. Coal has been the largest source of electricity generation in the United States.. ‧. Coal rose steadily as a fuel source for electricity in the 1960s, 70s and 80s. In 1960, it accounted for over 4,000 trillion Btus of electrical power and reached over 16,000 trillion. sit. y. Nat. units by the year 1990. From the mid to late-1990s, its growth as a source of electricity leveled off and had maintained at around 19,000 to 20,000 trillion Btus to 2010 (EIA,. io. er. 2012a). Ninety-one percent of the coal consumed in the year 2011 was used to generate. al. n. iv n C h e n ggenerated emissions, the percentage of electricity c h i Uby coal in the U.S. is predicted to electricity (EIA, 2012c). Due to tougher environmental regulations on greenhouse gas. decline. Some projections predict natural gas could surpass coal as a source of electricity (EIA, 2013a). 2.1.3 Natural Gas 1. The second largest source of energy in the United States has been natural gas. It increased rapidly as an energy source in the 1960s, rising in use by 75 percent, from over 12,000 trillion Btus in 1960 to over 21,000 trillion by 1970. From 1970 to 1990 it fluctuated between over 16,000 trillion Btus to over 22,000 trillion annually. Since 1990,. 1. Information in this section sourced from EIA (2013a). 6.
(15) its rate of consumption has remained stable, never dipping below 20,000 trillion Btus. It peaked in the year 2010 at over 24,000 trillion Btus. Natural gas has also been the second leading source of electricity as a fossil fuel and the third largest source of electricity overall. It grew steadily in use for electricity production 1960-2010. In 1960, it accounted for 1,785 trillion Btus of electric power and reached over 5,000 trillion by the year 2000. It has shown considerable growth, increasing from 6,000 trillion units in 2005 to over 7,000 in 2007. In the year 2006, it surpassed nuclear power to become the second leading source of electricity generation in the U.S. Natural gas production is expected to increase by an average of 1.3 percent a year. 政 治 大 which could result in the U.S. becoming a net exporter of natural gas. This could also 立 through 2040. Production supply is poised to exceed domestic demand by the year 2019,. result in natural gas replacing coal as the primary fuel used for electricity generation.. ‧ 國. 學. Since natural gas is a cleaner burning fossil fuel, increasing concerns about greenhouse gas emissions could lead to policies that encourage natural gas to further replace coal as a. ‧. source of electricity generation.. Nat. sit. y. 2.2 Renewable Energy. Renewable energy has had modest beginnings but has increased in its share of the. io. er. amount of energy produced in the United States. There are many different types of. al. n. iv n C biomass, geothermal, solar, and h wind types of renewable energy have been e npower. hi U g c Some renewable energies used in the U.S. Most notably, these include; hydroelectric power,. growing quickly the last several years. In 2011, renewable energy accounted for almost. 13 percent of the total electricity generation capacity and over 12 percent of the total electricity generated. In the year 2011, total installed renewable electricity in the U.S. reached over 146 gigawatts (GW). 2. In the same year, renewable energy accounted for. over a third of all newly installed electricity generation capacity (Office of Energy Efficiency and Renewable Energy (EERE), 2013a). Hydroelectric and biomass combined have accounted for the bulk of renewable energy consumption in the last 50 years. Each accounted for over 1,000 trillion Btus of. 2. This is a substantial increase from 2010, which had 59 GW worth of installed capacity (EERE, 2011). 7.
(16) all types of energy consumption in 1960, and both totaled about 2,500 trillion Btus in 2010. Hydroelectric power reached over 3,000 trillion Btus in 1974 and has fluctuated between over 2,000 to over 3,000 trillion since then. Biomass has also fluctuated, reaching over 3,000 trillion Btus in 1989 and 1996. However, it has only contributed over 300 to less than 500 trillion Btus to the electric power sector 1990-2010. In the years 1960-1990, it consisted of a much slighter proportion (EIA, 2012b). Since the year 2006, corn ethanol has also been an important source of renewable energy for the transportation sector. The amount of ethanol used in gasoline has tripled from the year 2005 to 2011. The amount of ethanol produced in 2011 was 8 times greater than the amount produced in the year 2000 (EERE, 2013a).. 政 治 大 contribution to total energy consumption has been minimal. In reached over 100 trillion 立 Geothermal energy had started by 1960 and has slowly grown in use, although its. Btus in 1986 and 200 trillion in 2009. As a source of electricity to the power sector, it. ‧ 國. 學. provided nearly 100 trillion Btus in 1985 and has provided at or near 150 trillion units of electrical power since 1990 (EIA, 2012a).. ‧. Nuclear electric power is in a class of its own. It does not use fossil fuels and has been coined as a clean source of energy. But the uranium that it is fueled by is not. y. Nat. sit. considered a renewable fuel source, since it is a natural element found in the earth that is. al. er. io. limited in quantity. Nevertheless, it has developed into a significant source of power in. n. the United States and has been the second leading source of electricity generation. It had. Ch. i n U. v. very meager beginnings in 1960, producing only 6 trillion Btus. However, by the. engchi. mid-1970s it reached over 1,000 trillion Btus and increased to over 6,000 trillion by 1990. In comparison to natural gas as source of electricity production, it lagged far behind in the 1960s and 70s before surpassing natural gas in the mid-1980s. Its use as a power supply continued to increase in the 1990s and remained near or above 8,000 trillion Btus throughout the last decade (EIA, 2012a). Although it has recently been surpassed by natural gas as a source of electricity, it still remains an important source of electricity for the U.S. and accounts for close to 20 percent of electricity generation. Wind power and solar PV are two of the fastest growing sources of new electricity generating installations in the nation. “In 2011, cumulative installed wind capacity increased by nearly 17% and cumulative installed solar photovoltaic capacity 8.
(17) grew more than 86% from the previous year” (EERE, 2013a). Wind power started to mark its place as an electrical energy source in the early 1980s and grew more substantially in the late 1980s. It grew from 22 trillion Btus in 1989 to over 900 trillion units in 2010. Solar energy also began to make headway in the early 1980s and grew to nearly 60 trillion Btus by 1990. It reached 70 trillion units in 1996 and 1997, but after that it accounted for less than 70 trillion Btus until 2007. It stood at 63 trillion Btus in 2005, however, that figure doubled by 2010 to 126 trillion Btus. As a source of electricity to electric utilities, it consisted of a modest amount. It hovered between 5 and 6 trillion Btus from the mid-1990s to the mid-2000s, but has increased quickly since then, doubling by 2010 (EIA, 2012a).. 政 治 大 year it had increased in capacity by 40 percent from 2008 and increased in electricity 立 In 2009, the U.S. led the world in installed wind capacity at over 35 GW. In that. generation by more than 33 percent. At that time it accounted for just under 2 percent of. ‧ 國. 學. all power generation in the U.S. (Walsh, 2012; EERE, 2013a). Since then wind power has continued to grow substantially. The amount of wind power capacity in the year 2011. ‧. was 18 times greater than the amount in the year 2000. In the last for 4 years of the last decade, wind accounted for more than third of all forms of new electricity generation. y. Nat. sit. capacity in the United States. “Wind energy accounted for about 75% of newly installed. al. er. io. U.S. renewable electricity capacity in 2011.” New wind power capacity installations in. n. the year 2011 totaled almost 7 GW, led by California with over 921 MW (EERE, 2013a).. Ch. i n U. v. Of all the renewable energy sources, wind and solar power increased the most.. engchi. The use of solar power doubled to 2 percent of all renewable energy, and wind nearly tripled from 4 to 11 percent. Hydroelectric and geothermal declined as a percentage while biomass increased somewhat. The increased use in biomass can be attributed to the increased use of corn ethanol mixed with petroleum. As a result, the transportation sector consumed 13 percent of all renewable energy produced in 2010. In 2006, the transportation sector only consumed 7 percent (EIA, 2007; EIA, 2012b). The growth in use of renewable energy in the U.S. could vary greatly depending on changes in technology, the use of natural gas, and policies aimed at reducing greenhouse gas emissions. Conservative predictions cite an increase in renewable energy for electricity production from 13 percent in 2011 to 16 percent in 2040. If natural gas 9.
(18) prices become lower than predicted, combined with a lack of policy incentives catering to investments in renewable energy, it is expected that the impetus towards renewable energy propagation would be adversely affected. However, technology improvements could make renewable energy more affordable than predicted. Wind and solar power are expected to experience declines in costs, and of the two sources, solar PV is thought to have more potential for future cost declines than wind energy. This, combined with the potential for more stringent emission policies, could raise the percentage of renewable energy for electricity generation to as high as 31 percent by 2040 (EIA, 2013a). 2.4 Energy Overview. 治 政 fuels (petroleum, coal, and natural nearly 100 quadrillion Btus in the year 2011. Fossil大 立the majority of energy used in the U.S., totaling about 81 gas) together account for. The total amount of energy used by all sectors in the United States amounted to 3. ‧ 國. 學. percent of all energy consumed in 2011. Thirty-six percent of the energy came from petroleum, 25 percent came from natural gas, 20 percent came from coal, 8 percent came. ‧. from nuclear power, and 9 percent came from all forms of renewable energy combined (EIA, 2012c). Renewable energy as a whole accounted for over 8 percent of all the. sit. y. Nat. electricity consumed in 2010, and fossil fuels accounted for 83 percent of all electricity consumed in the same year (Walsh, 2012).. io. er. As a comparison to overall energy consumption in the U.S. in the years. al. n. iv n C in 1960 to over 97,000 trillion h in e 2010. Energyiconsumption rose sharply in the 1960s ngch U. 1960-2010, energy consumption more than doubled, from more than 45,000 trillion Btus. and early 1970s, reaching over 72,000 trillion Btus in 1972. Energy consumption increased steadily from that point to the year 2000, reaching nearly 99,000 trillion Btus. Energy consumption rose above 100,000 trillion Btus in 2004, 2005, and 2007 but dropped below 98,000 trillion in 2010. Electrical power consumption by the electric power sector also rose sharply in the 1960s and early 1970s. The rate of electricity consumption grew even faster than overall energy consumption, slowing in growth in the mid-1990s. In the last decade, the electric power sector consumption leveled off, ranging from over 38,000 to over 40,000 trillion Btus (EIA, 2012a). 3. One quadrillion Btus is roughly equal to the energy stored by 172 million barrels of oil, 50 million tons of coal, or 1 trillion cubic feet of natural gas (EIA, 2012c). 10.
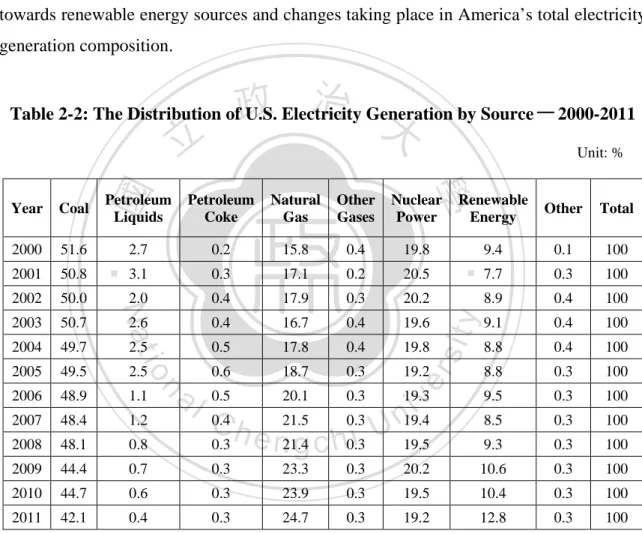
(19) Between the year 1960 and 1995 consumption of electricity quadrupled. Data for retail electricity sales show electricity use rising from over 2,300 trillion Btus to nearly 13,000 trillion in 2010. In the 2000s, electricity sales leveled off from over 11,000 to over 12,000 trillion Btus. In 2010, there was about 5.5 times the electricity sales as in 1960, and more than double than in 1975. Interestingly, the amount of power lost by the power sector while generating, transmitting, and distributing, as well as unaccounted for loses, is much greater than the about of electricity consumed by the customers. In 1960, the amount of power lost by utilities was about 2.5 times the amount sold to costumers. Efficiency slowly improved in the following decades, but only slightly. In 2010, the amount of power lost by the power sector was still more than double the amount used by consumers (EIA, 2012a).. 立. 政 治 大. io. n. al. 19,919 23,246 29,522 32,732 34,205 30,925 33,552 34,441 38,265 40,397 36,020. Ch. engchi. Nuclear Power 6 43 239 1,900 2,739 4,076 6,104 7,075 7,862 8,161 8,434. Renewable Energy 2,928 3,396 4,070 4,687 5,425 6,084 6,043 6,560 6,106 6,229 8,056. y. Nat. 1960 9,831 1965 11,582 1970 12,269 1975 12,656 1980 15,461 1985 17,540 1990 19,168 1995 20,099 2000 22,576 2005 22,795 2010 20,869 Source: EIA (2012a).. Natural Gas 12,385 15,779 21,693 19,977 20,227 17,714 19,628 22,721 22,295 22,567 24,249. sit. Petroleum. er. ‧ 國. Coal. Unit: Trillion Btu. ‧. Year. 學. Table 2-1: Energy Consumption in the United States-1960-2010. i n U. v. Total Energy 45,079 54,028 67,742 71,987 78,093 76,464 84,507 91,092 98,806 100,277 97,711. From 2010 to 2011, although the total amount of electricity consumed in the U.S. decreased by -.6 percent, electricity generated by solar energy sources increased by 50 percent. Wind accounted for the second largest increase in energy use, rising by 27 percent. In third place was conventional hydroelectricity at 22 percent. Natural gas was the only fossil fuel that increased that year with a modest 2.6 percent gain. Coal 11.
(20) consumption decreased by over 6 percent and petroleum liquids decreased 31 percent. This demonstrates significant growth in renewable energies despite a decrease in overall electricity demand. It also reveals a notable decrease in coal consumption and a significant decline in petroleum as a fuel used to produce electricity. Nuclear power also decreased by over 2 percent (EIA, 2013b). Although it is just a one year comparison, it is difficult to explain such large increases in renewable electricity generation during a time of reduced electricity consumption without concluding there was a shift in investment towards renewable energy sources and changes taking place in America’s total electricity generation composition.. 政 治 大. Table 2-2: The Distribution of U.S. Electricity Generation by Source-2000-2011 Unit: %. 學. ‧ 國. 立. Natural Gas. Other Gases. Nuclear Power. Renewable Energy. Other. Total. 2.7. 0.2. 15.8. 0.4. 19.8. 9.4. 0.1. 100. 3.1. 0.3. 17.1. 0.2. 20.5. 7.7. 0.3. 100. 2.0. 0.4. 17.9. 0.3. 20.2. 8.9. 0.4. 100. 2.6. 0.4. 16.7. 0.4. 19.6. 9.1. 0.4. 100. 2.5. 0.5. 17.8. 0.4. 19.8. 8.8. 0.4. 100. 0.6. 18.7. 0.3. 19.2. 8.8. 0.3. 100. 0.5. 20.1. 0.3. 9.5. 0.3. 100. 8.5. 0.3. 100. 19.5. 9.3. 0.3. 100. 0.3. 20.2. 10.6. 0.3. 100. 23.9. 0.3. 19.5. 10.4. 0.3. 100. 24.7. 0.3. 19.2. 12.8. 0.3. 100. 2002. 50.0. 2003. 50.7. 2004. 49.7. 2005. 49.5. 2.5. 2006. 48.9. 1.1. 2007. 48.4. 1.2. 2008. 48.1. 0.8. 0.4 C h. 2009. 44.4. 0.7. 0.3. 23.3. 2010. 44.7. 0.6. 0.3. 2011. 42.1. 0.4. 0.3. n. al. 0.3. e n21.4 g c h0.3i U 21.5. 0.3. Source: EERE (2013a).. 12. y. 50.8. sit. 2001. er. 51.6. io. 2000. ‧. Petroleum Coke. Coal. Nat. Petroleum Liquids. Year. iv n19.4 19.3.
(21) Table 2-3: The Distribution of U.S. Renewable Electricity Generation-2000-2011 Unit: %. Year. Hydro. Solar. 2000 7.2 0.0 2001 5.8 0.0 2002 6.8 0.0 2003 7.1 0.0 2004 6.7 0.0 2005 6.7 0.0 2006 7.1 0.0 2007 5.9 0.0 2008 6.2 0.1 2009 6.9 0.1 2010 6.3 0.1 2011 7.9 0.2 Source: Same as Table 2-2.. 立. Wind. Geothermal. Biomass. 0.1 0.2 0.3 0.3 0.4 0.4 0.7 0.8 1.3 1.9 2.3 2.9. 0.4 0.4 0.4 0.4 0.4 0.4 0.4 0.4 0.4 0.4 0.4 0.4. 1.6 1.3 1.4 1.4 1.3 1.3 1.3 1.3 1.3 1.4 1.4 1.4. 政 治 大. All Renewables 9.4 7.7 8.9 9.1 8.8 8.8 9.5 8.5 9.3 10.6 10.4 12.8. ‧ 國. 學. 2.5 Summary. ‧. In summary, there has been a lot of growth in energy use in the United States from. y. Nat. the 1960s through the 1990s. This is to be expected with economic and population. sit. expansion. In the last decade energy use has leveled off, and has even reduced by a Fossil fuels, such as petroleum, coal, and. er. io. modest amount at the end of the 2000s. 4. al. n. iv n C Petroleum will continue to be an important fuel U h e n g c h i for transportation in the foreseeable future. Increased domestic production of oil and increased fuel efficiency of automobiles natural gas are the primary fuel sources for transportation and electricity in the U.S.. should help limit U.S. dependence on foreign oil suppliers in the future. Coal has been the primary fuel used to generate electricity. Increased emission standards on coal plants will make coal less economically viable as a source of electricity as it is currently. Coal will likely account for a smaller percentage of electricity generation in the future, but will still be one of the leading sources of electricity. Natural gas is already the second leading source of electricity and is projected to increase its share of the total electricity generated. Due to its abundant supply in the U.S. and advances in technology to produce it, natural gas is becoming an increasingly important 4. This can be expected considering the economic recession in the U.S. starting in the year 2008. 13.
(22) energy source. In the next decade the United States could become an important regional exporter of natural gas. Nuclear power accounts for a significant share of the electricity produced, but its share has leveled off and will not continue to grow in importance as a source of electricity. Renewable energy sources do not have a large share of the total electricity produced in the United States, although not insignificant. Government policies and concerns about greenhouse gas emissions will lead to renewable energy increasing its share of the total U.S. energy composition. Solar and wind power installations have been growing at a tremendous rate the last several years. This is likely to continue considering the current political climate for clean energy.. 立. 政 治 大. ‧. ‧ 國. 學. n. er. io. sit. y. Nat. al. Ch. engchi. 14. i n U. v.
(23) Chapter 3 The Development of Solar Energy around the World In this chapter I will discuss about the global development of solar PV energy. Silicon-based solar PV technology has existed for nearly 60 years. For the first few decades of its existence it had served mostly small niche markets, such as powering space equipment and remote off-grid locations. In the 1990s, the technology and costs to install PV systems improved, and grid-connected PV systems began to gain traction. In the 2000s, the solar PV market grew rapidly in a number of countries as a result of. 政 治 大 continues to grow globally, 立 although recently there have been some regional changes in. government incentives and continued reductions in the cost of PV components. Solar PV. market growth.. ‧ 國. 學. 3.1 Early Developments of Solar PV. ‧. Solar photovoltaic cells were first developed in the year 1954 by the Bell Laboratories in the United States. In the 1950s and 60s, the United States and the former. Nat. sit. y. Soviet Union used PV technology primarily for space craft applications. “The first. io. er. generation of photovoltaic manufacturing firms included such names as Hoffman Electronics, Heliotek, RCA, International Rectifier, and Texas Instruments.” The. al. n. iv n C 1960s Japan started producing h theefirst solar modules, mostly for powering n gpractical chi U Japanese company Sharp was the first to pioneer PV applications for other uses. In the. lighthouses in remote coastal areas. The second generation of PV producers were spurred by the oil crisis of the 1970s and a renewed interest in alternative energy sources. Major oil companies also invested in solar PV development at the time (Platzer, 2012; Timilsina et al., 2011). 5 In the year 1980, one of the PV manufacturing companies started by a major oil company, Arco Solar, was the first company in the world to produce over a megawatt (MW) of PV modules in a single year. In the year 1983, 21.3 MW were produced worldwide at a value of $250 million. By 1999 worldwide production reached 1 gigawatt 5. The Energy Policy Act (ETA) of 1978 created residential solar credits of up to $2,000 for devices installed on homes, which in turn spurred investment for the industry. 15.
(24) (GW) (EERE, 2004). In the following decade the solar energy market began to change rapidly. The cost of solar modules has decreased substantially in the last 3 decades. In the year 1982 the installed cost of solar was about $27,000 per kilowatt (kW). In the year 1992 the cost had gone down to $16,000 per installed kW. By the year 2008 the cost dropped to $6000 per kW. The total installed capacity of all global PV stood at 1.4 GW in the year 2000. This would increase to 40 GW in 2010 with an annual increase in growth of about 50 percent per year. In the year 2010, 85 percent of PV installations were connected to utility grids and 15 percent were independent of any grid (Timilsina et al., 2011). 3.2. 治 政 Types of Solar PV Technology 大 立of PV cell technologies used today can be classified as either The two main types ‧ 國. 學. crystalline silicon PV cells or thin-film PV cells. Crystalline cells is the dominate PV technology used for PV systems across the globe. Thin-film cells are constructed with a. ‧. variety of materials; including, amorphous silicon (a-Si), copper indium diselenide (CIS), copper indium gallium diselenide (CIGS), and cadmium telluride (CdTe). Thin-film PV. sit. y. Nat. is cheaper and less complicated to produce, but also less efficient than crystalline cells in producing electricity. “On average, thin-film cells convert 5%-13% of incoming sunlight. io. er. into electricity, compared to 11%-20% for crystalline silicon cells” (Platzer, 2012).. al. n. iv n C h e n gtechnology. compared to 95 percent from crystalline c h i U Thin-film PV modules have since In the year 2003, only 5 percent of PV systems were built with thin-film modules. then gained in market share, although the PV market is still dominated by crystalline modules. Higher efficiency concentrating photovoltaics (CPV) PV modules have also increased in popularity and recently entered larger-scale production. 6 “By the end of 2010, thin-film technology accounted for 13% of global PV shipments (3% a-Si, 8% CdTe, and 2% CIGS). The United States was responsible for 18% of global CdTe and 20% of global a-Si shipments in 2010.” (U.S. Department of Energy (DOE), 2012a).. 6. Concentrating photovoltaic (CPV) systems consist of crystalline PV modules arranged to receive a greater concentration of sunlight, which in turn increases the conversion efficiency of the modules. 16.
(25) 3.3 Solar Energy Development in Germany 7 Germany is the global leader in installing solar PV systems. Due to generous FiTs (feed-in tariffs), 8 the growth of solar PV installations in Germany has been very impressive, starting in the mid-part of the last decade and picking up impressive momentum in the latter part of the decade. In the year 2004, solar PV installations totaled 660 MW, more than 4 times the amount installed in the year 2003. In the year 2005, the amount of PV installed increased to over 900 MW before dropping down to 850 MW in the year 2006. In the year 2007, installed PV reached over 1.2 GW and jumped to nearly 2 GW in the year 2008. The amount of solar PV installed in Germany rose impressively after that. In the year 2009, 3.8 GW of PV was installed. In the year 2010 and 2011, 7.4. 政 治 大. and 7.5 GW of PV was installed respectively for total of nearly 25 GW installed in the. 立. country.. As a result of the increase in PV installations, the amount of PV power produced. ‧ 國. 學. in Germany increased as well. From the year 2004 to the year 2011, electricity produced by solar PV increased at a rapid pace, from 556 million kilowatt hours (kWh) in the year. ‧. 2004 to 18 and a half billion kWh in the year 2011. In the year 2011 alone, there was about a 60 percent increase in electricity produced by solar PV than in the year 2010. The. y. Nat. sit. system cost to install solar PV also has steadily declined in Germany. This, in. al. er. io. combination with policy incentives, helped to make solar PV systems a more attractive. n. investment. In Q2 of 2006, the average price per kW for installed PV was 5,000 Euros.. Ch. i n U. v. This price fell nearly every quarter and reached 1,776 Euros per kW during Q2 of the. engchi. year 2012. The total drop in the price to have PV installed in Germany from Q2 of the year 2006 to Q2 of the year 2012 was about 65 percent. 3.4 Solar Energy Development in Japan 9 In the 1960s and 70s, Japan’s early production and use of solar PV was mostly restricted to special commercial applications; including space vessels, communications, and lighthouses. In the early 1990s, the Japanese government introduced policies to encourage PV installations, such as net metering and subsidies. These policies laid the 7. Information in this section sourced from the German Solar Industry Association (GSIA) (2012). Solar feed-in tariffs (FiT) refers to long-term contracts that guarantee payments for the amount of kWh of electricity produced by a qualifying PV system. 9 Information in this section sourced from Kimura and Suzuki ( 2006). 8. 17.
(26) foundation for the growth of the solar PV market in Japan in the second half of the 1990s into the 2000s. Several major Japanese appliance companies were able to use government subsidies for solar PV R&D and manufacturing development. Also, “the strong commitment by the government to introduce PV very much stimulated private investments, which rose well over governmental subsidies.” Consistent, predictable, and adequate support by Japan’s government for PV R&D in the 1980s and 90s was important for long-term PV technological development by Japanese companies. Stable funding and support for PV initiatives also provided a secure investment environment for private firms and investors. Subsidizing customers also provided a ‘demand-pull’ effect by encouraging Japanese PV producers to develop. 政 治 大 funds solely for the support of the solar industry also provided secure and lasting funding, 立. production abilities to meet the induced demand. Using especially designed taxes to raise. which also helped the subsidy program to last more than 10 years. This in turn effectively. ‧ 國. 學. created a niche market for solar PV systems in Japan.. The 700 Roofs Program introduced subsidies at the end of the year 1993, and. ‧. Japanese PV producers increased production capacity to meet demand for residential PV systems. The program lasted from the year 1994 to 2005 and offered regressive subsidies. y. Nat. sit. over time. “The subsidy rate for individual installation was gradually decreased from. al. er. io. 50% of the investment cost in 1994 to only 20,000 JPY per kW or 3% of the investment. n. cost in 2005.” While subsidies decreased over time, so did the costs of PV systems,. Ch. i n U. v. offsetting the effects of lower subsidy rates somewhat. Nevertheless, despite the subsidies. engchi. offered by the government, the cost of electricity generated from PV systems during that time still cost more than utility-provided retail electricity rates. But demand for solar PV existed from people who earned a higher than average income, were concerned for the environment, and indifferent towards the higher rates for electricity from PV systems. 3.5 Global Growth in Solar Energy Global solar PV capacity fluctuated between 22 percent and 38 percent annual increases between the year 2000 and 2006. The year 2007 marked an unusual year for that decade with only a 5 percent growth from the year 2006. Nevertheless, PV capacity grew rapidly after that year to 71 percent growth in the year 2008. The year 2009 still showed strong growth with a 62 percent increase in capacity from 2008. The year 2010 18.
(27) had remarkable growth, nearly doubling from the year 2009 with a 90 percent increase. The year 2011 also showed strong growth with nearly an 80 percent increase over 2010 (EERE, 2013a). After the steady gains in global solar PV capacity in the first half of the 2000s, the overall percentage of solar PV electricity as a percentage of the total global electricity capacity increased from 0.1 percent between the years 2000 to 2005 to 0.2 percent in the years 2006 and 2007. The percentage began to increase faster after the year 2007. In the year 2008 solar PV accounted for 0.3 percent of the global electrical capacity, and in the year 2009 it rose to 0.4 percent. That amount doubled in the year 2010 to 0.8 percent of the global share. In the year 2011, it rose even more to 1.4 percent. When calculating. 政 治 大 solar PV capacity averaged 43 percent a year between the year 2000 and 2011 (EERE, 立 solar PV as an electrical power source tied to power grids, the annual global growth of. 2013a).. ‧ 國. 學. As a source of global electricity generation, solar PV accounted for less than 0.0 percent of all global electricity generation until the year 2006. In that year it finally broke. ‧. the 0.1 percent milestone. Solar PV retained its 0.1 percent global share until the year 2010, when it accounted for 0.3 percent of global electricity. In the year 2011 it increased. y. Nat. sit. further to a half percent of global electricity generation (EERE, 2013a).. al. er. io. In the 1970s off-grid PV applications were the norm. Grid-connected systems. n. have led the recent boom in solar PV growth, but in places like India and China off-grid. Ch. i n U. v. installations have still been popular. “This trend could be a reflection of their large rural. engchi. populations, with developing countries adopting an approach to solar PV that emphasizes PV to fulfill basic demands for electricity that are unmet by the conventional grid.” Off-grid solar PV installations nearly doubled grid-connected solar panel in the early 1990s. However, grid-connected PV systems surpassed off-grid systems in the second half of the 1990s and have continued to quickly outpace off-grid solar installations since then. In the years 2006 and 2007 grid-connected solar grew 50 percent annually and in 2008 grew 70 percent (Timilsina et al., 2011). In 2011, the top 5 countries with the most cumulative solar PV installed included Germany, Italy, Japan, Spain, and the United States, in that order. Germany had over 24 and a half GW installed, nearly twice as much as the second leading country in the world, 19.
(28) Italy. Italy had over 12.7 GW installed, well over twice the amount as third place Spain, which had over 5.3 GW. Japan had nearly 5 GW, and the United States had over 4 and a half GW. Rounding off the top ten countries with installed PV in 2011 include China, France, the Czech Republic, Belgium, and Austria. China had nearly 3 GW of installed PV. France had about 2.7 GW installed, and the Czech Republic had nearly 2 GW. Belgium had 1.6 GW, and Austria had about 1.3 GW of installed capacity (EERE, 2013a).. Table 3-1: Global PV Capacity by Country-2010. 政 治 大Global Share. n. er. io. sit. y. Nat. al. 3.6 Feed-in Tariffs 10. Ch. 44 10 9 9 6 5 2 7 8 100. ‧. ‧ 國. 立. 學. Country Germany Spain Italy Japan United States Czech Republic China Rest of EU Rest of World Total Source: Timilsina et al. (2011).. Unit: %. engchi. i n U. v. Feed-in tariffs (FiTs) have also been very important for the development of solar PV demand in other countries. As of the year 2012, 61 countries and 26 regional jurisdictions had FiT laws in place. The majority of the growth in PV solar installations has taken place in these countries. Between the years 2005 and 2010, all of the growth in solar PV capacity in Europe took place in countries with FiT policies. They give investors incentive to invest in PV systems because of the guaranteed rate of return from fixed prices. The certainty also reduces investment costs.. 10. Unless otherwise noted, information in this section sourced from Prest (2012). 20.
(29) Table 3-2: Global Solar PV Growth Rate Unit: %. Year 2000 2001 2002 2003 2004 2005 2006 2007 2008 2009 2010 2011 Source: EERE (2013a).. 政 治 大. 學. ‧ 國. 立. PV Growth Rate 22 29 33 25 33 38 32 5 71 62 90 79. ‧. Table 3-3: Global Solar PV Share of Total Electricity Distribution. n. al. Ch. 0.0 0.1 0.1 0.1 0.1 0.1 0.2 0.2 0.3 0.4 0.8 1.4. engchi. y. sit. io. 2000 2001 2002 2003 2004 2005 2006 2007 2008 2009 2010 2011 Source: Same as Table 3-2.. PV Electricity Generation. er. Nat. PV Electricity Capacity. Year. Unit: %. i n U. v. 0.0 0.0 0.0 0.0 0.0 0.0 0.1 0.1 0.1 0.1 0.3 0.5. Feed-in tariffs have “… been implemented in more than 75 jurisdictions around the world as of early 2010, including in Australia, EU countries, Brazil, Canada, China, Iran, 21.
(30) Israel, the Republic of Korea, Singapore, South Africa, Switzerland, the Canadian Province of Ontario and some states in the United States” (Timilsina et al., 2011). They are important for the development of PV markets in that they provide a return on investment for investors in PV power generation. They have been monumental for creating huge new solar PV markets in countries leading the world in PV installations, especially Germany and Italy. Most importantly, feed-in tariffs have been the single most effective policy in promoting the rapid growth in global solar PV installations. The downside to feed-in-tariffs is that the cost of solar electricity generation is shared by all consumers of electricity, including those who do not benefit from owning a solar PV system and receiving the FiT. This causes increases in the overall cost of. 政 治 大 technology, and sometimes because of political atmosphere or concerns over high 立 electricity. FiTs also change over time as a result of changes to system costs and. electricity rates. This causes future uncertainty and can negatively affect the investment. ‧ 國. 學. climate for PV systems.. The explosive growth in solar PV in some European markets also created pressure. ‧. to place caps on FiT rates quicker than anticipated, due to unsustainable support costs. Germany has imposed substantial reductions in FiT guarantees, and France and Spain. y. Nat. sit. have placed drastic sudden limits on installed capacity. Places such as Spain and New. al. er. io. South Wales in Australia have even stopped all FiTs for new installations.. n. By the year 2011, solar PV had become the world’s fastest growing form of. Ch. i n U. v. power generation. Pressure to amend FiT laws has come from the need to reduce the. engchi. impact of residential electricity rates, and in some cases, the need reduce the impact on a country’s budget. Reports had been made in New South Wales, Australia about the effects FiT had caused on increases in electricity rates. However, data later revealed that utility infrastructure upgrades were more responsible for higher energy prices than their FiT. The Australian Energy Market Commission “predicted that NSW retail electricity prices will rise by a cumulative total of 39.3 % between 2009–2010 and 2012–2013. Of this increase, 59.12 % will be due to distribution costs, only 6.17 % due to the NSW FIT, and 6.47 % due to the federal small-scale renewable energy scheme.” In Australia, the Czech Republic, the United Kingdom, France and Spain, FiTs have been capped on the basis of installation limits with little notice, causing investment 22.
(31) uncertainty and instability in their solar PV markets. When Spain capped its FiTs in the year 2008, it was followed by a loss of 30,000 jobs in the renewable energy sector between the year 2009 and 2010. Spain went from having robust solar PV growth under the FiT laws to having a stagnant PV market after the FiT was capped. A similar effect could be witnessed in the Czech Republic. In the year 2011, only 10 MW of solar PV was installed following major cuts to the FiT scheme there compared to 1.5 GW of installed PV in the year 2010. 3.7 Global Solar PV Manufacturing Although the market for solar PV has expanded rapidly in the United States over. 治 政 decade. In the year 2000, the United States accounted 大for 30 percent of the global PV 立 to lose its position as the dominant supplier of solar PV shipments, but soon began. the last several years, its percentage share of the global market declined over the last. ‧ 國. 學. modules. Manufacturing by Japanese and German producers increased accordingly to meet local demand. The U.S. market share first shifted to Japan, which held the top. ‧. position for a short while. Germany emerged as the largest supplier of solar PV, surpassing Japan, but then gave up the top spot to China in the later part of the decade.. sit. y. Nat. “During 2006–2010, China and Taiwan invested heavily in PV manufacturing and demonstrated an ability to scale-up production rapidly while reducing manufacturing cost. io. er. substantially.” In the year 2010, China and Taiwan together accounted for more than half. al. n. iv n C h e2010, Between the year 2000 and h i Ushipments of PV modules around the n gthecglobal. of all global PV shipments (DOE, 2012a). 11. world averaged an annual growth of 53 percent and reached a total of 17 GW in 2010. This brought the total amount of PV shipments to a total of about 40 GW. “In 2010, the United States accounted for 8% or about 1,400 megawatts (MW) of PV market demand and 6% or about 1,000 MW of supply” (DOE, 2012a). The total amount of global solar PV module production in 2011 totaled nearly 35 GW. China was by large the biggest global supplier of solar PV modules. China produced 61 percent of the global share for a total of over 21 GW worth of modules.. The rest of. Asia combined (excluding Japan) was the second leading producer of solar modules with. 11. Production was primarily driven by the high-demand markets in Europe at the time. 23.
(32) 16 percent of the global share for a total of about 5.4 GW. Europe as a whole was the third largest supplier with 14 percent of the global share for a total of about 4.8 GW. Japan came in at fourth place, producing over one and a half GW accounting for 5 percent of the global supply. The United States was the fifth largest producer of solar PV modules, producing over 1.3 GW for 4 percent of the global supply. All other countries combined only produced less than 0.4 GW, or 1 percent of the global supply (EERE, 2013a). The major solar PV module manufactures have been China, Germany, Japan, Taiwan, and the United States. Between the year 2008 and 2010, China emerged as the major center for solar PV cell and module production. A huge increase in global PV. 政 治 大 about 40 GW of capacity from less than 23 GW in 2009. Leaders in crystalline module 立. installed capacity took place during this time, nearly doubling in the year 2010, with. production included Suntech, Yingli, Trina Solar, and Sharp, all of whom produced over. ‧ 國. 學. 1 GW of solar modules in the year 2010. Suntech led all producers that year with over 1.5 GW. The major global thin-film module producer is First Solar, which produced over 1.4. ‧. GW of modules in 2010. China produced 45 percent of the global crystalline modules and 12 percent of the global thin-film modules in 2010 (Globaldata, 2011).. y. Nat. sit. In the year 2010, Germany accounted for over 14 percent of the global crystalline. al. er. io. module production and over 19 percent of the global thin-film module production.. n. Japanese production provided over 12 percent of the global supply of crystalline modules. Ch. i n U. v. and 12 percent of the global thin-film modules in 2010. Taiwan accounted for 6 and a. engchi. half percent of global crystalline module production and nearly 10 percent of thin-film modules in 2010. The United States produced 5 percent of the global crystalline modules and 16 percent of the global thin-film modules, due mostly to thin-film module producer First Solar, which accounted for 97 percent of the thin-film modules produced in the United States (Globaldata, 2011). The top three companies for global crystalline modules in the year 2010 were all Chinese. Chinese companies Suntech, Yingli, and Trina Solar were the top producers with a global share of 17.6 percent, 11.9 percent, and 11.7 percent respectively. While global crystalline modules accounted for 17.5 GW of total production, thin-film modules only accounted for 3.6 GW of solar PV in the year 2010. United States company First 24.
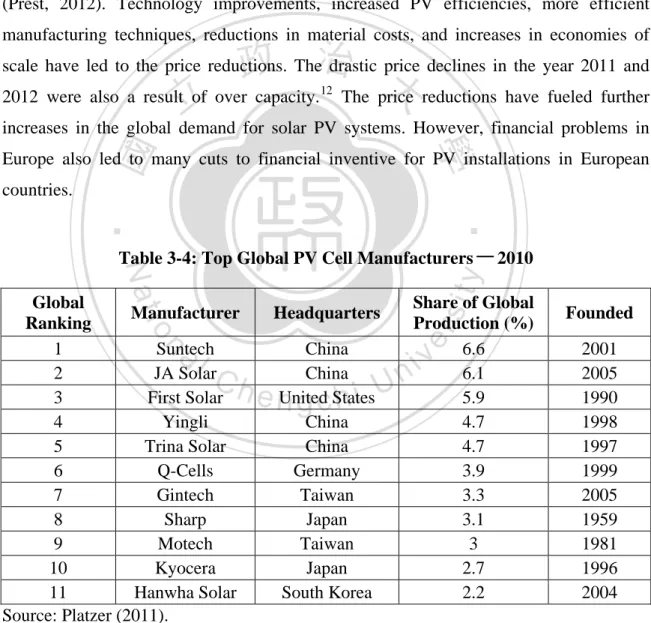
(33) Solar produced over 60 percent of the total global supply, followed by Japanese company Sharp with 8.5 percent in the year 2010. From the beginning of the year 2010 until the end of 2011, the price for crystalline modules fell from $2.52 per watt to $1.71 per watt. In the same time the price for thin-film modules fell from $2.07 per watt to $1.36 per watt (Globaldata, 2011). In the past two decades, every time a given volume of PV modules sold had doubled the price for PV modules decreased by over 20 percent, and the cost of modules per watt has decreased by 22 percent every time the global utilization capacity doubles (Prest, 2012). Technology improvements, increased PV efficiencies, more efficient manufacturing techniques, reductions in material costs, and increases in economies of. 政 治 大 2012 were also a result of over capacity. The price reductions have fueled further 立 scale have led to the price reductions. The drastic price declines in the year 2011 and 12. increases in the global demand for solar PV systems. However, financial problems in. ‧ 國. 學. Europe also led to many cuts to financial inventive for PV installations in European countries.. ‧. n. al. 12. Ch. Headquarters China China United States China China Germany Taiwan Japan Taiwan Japan South Korea. engchi U. Share of Global Production (%) 6.6 6.1 5.9 4.7 4.7 3.9 3.3 3.1 3 2.7 2.2. er. io. Global Manufacturer Ranking 1 Suntech 2 JA Solar 3 First Solar 4 Yingli 5 Trina Solar 6 Q-Cells 7 Gintech 8 Sharp 9 Motech 10 Kyocera 11 Hanwha Solar Source: Platzer (2011).. sit. y. Nat. Table 3-4: Top Global PV Cell Manufacturers-2010. v ni. Founded 2001 2005 1990 1998 1997 1999 2005 1959 1981 1996 2004. PV module prices fell by nearly 50 percent in 2011, 75 percent lower than in mid-2008 (Prest, 2012). 25.
(34) The top ten PV solar module suppliers in the year 2012 included (Lian, 2013): 1.. Yingli Green Energy (up one spot from the year 2011);. 2.. First Solar (up 2 spots from 2011);. 3.. Suntech (dropping 2 places from number 1 in 2011);. 4.. Tina Solar (dropping from number 3 in 2011);. 5.. Canadian Solar (keeping the same spot from 2011);. 6.. Sharp Solar (also keeping the same spot from 2011);. 7.. Jinko Solar (up 2 spots from 2011);. 8.. JA Solar (up 7 spots from number 15 in 2011);. 9.. SunPower (down 1 spot from 2011); and. 政 治 大 Of the top ten solar PV producers in 2012, seven of these companies were based in 立 10.. Hanhwa Solar (down 3 spots from 2011).. China, two were based in the United States, and one was based in Japan. The top global. ‧ 國. 學. producer, Yingli, supplied more than 2.2 GW of solar PV modules in the year 2012. The top ten global PV suppliers still accounted for less than 50 percent of the global demand. ‧. (Lian, 2013). 13. By the end of 2012, there was over 100 GW of cumulatively installed PV capacity. y. Nat. sit. worldwide. In the year 2012, years of excessive global production of PV supplies. al. er. io. continued the problem of chronic oversupply, which brought PV module prices well. n. below $1.00 U.S. per watt (Colville, 2013a). The oversupply led to negative margins for. Ch. i n U. v. PV producers and caused many bankruptcies, especially for European and American. engchi. suppliers. The oversupply and low margins also resulted in PV producers lobbying their governments for protection from foreign suppliers, particularly those from China. 3.8 Future Outlook for Global Solar PV The cost of electricity produced by solar PV systems has continued to fall by impressive amounts; however, it is still a rather expensive source of electricity in many areas in the world compared to traditional utility electricity generation. “In the year 2011, the average minimal cost for solar PV electricity was $192 per MW hour, making it four 13. Many Tier 1 Chinese producers have accumulated vast amounts of debt. Recently, Suntech’s manufacturing subsidiary, Suntech Wuxi, entered bankruptcy proceedings, despite being one of China’s largest PV module suppliers. 26.
(35) times more expensive than coal without carbon reduction technology or carbon tax” (Timilsina et al., 2011). Other types of alternative energy have been more cost competitive for electricity generation, including hydropower, wind energy, and nuclear energy. Demand for solar PV in the Asia Pacific region is forecast to have strong growth in the year 2013 and increase by 50 percent. The four largest PV markets in the Asia Pacific, China, Japan, India, and Australia, should account for 90 percent of the demand for new solar PV installations in the region. However, incentive reductions in Australia will slow PV growth there in 2013, and PV policies there remain uncertain (NPD Solarbuzz, 2013).. 政 治 大 “By the end of 2011, cumulative installed and connected capacity in China had risen 立. Solar incentives in China and India have made them fast growing PV markets.. substantially to 2.9 GW.” India’s National Solar Mission is also likely to bring substantial. ‧ 國. 學. growth to its PV demand. Its policy targets 20 GW of its electricity generation to come from solar energy by the year 2020 (Platzer, 2012). India could see solar PV installations. ‧. grow by over 5 GW to 9 GW of total installed capacity this year, and off-grid and rooftop installations will be major drivers of PV growth. Risk factors to solar PV growth in China. y. Nat. sit. and India include financing and grid access (NPD Solarbuzz, 2013).. al. er. io. The solar shakeout that has been taking place is likely to continue in the year. n. 2013, and perhaps even longer. However, the five-year forecast for the demand for solar. Ch. i n U. v. PV products remains positive. According to an NPD Group report, it is likely that 230. engchi. GW of solar PV capacity will be added globally between the year 2013 and 2017. Almost half of the new global capacity will come from utility-scale installations. China will surpass Germany as the world’s largest solar PV market in the year 2013. China will then have a global lead in both the supply and demand segments of the PV industry. While the share of global demand for new PV capacity will decline in Europe, many new emerging PV markets will support solid overall PV growth the next several years. Latin America, the Middle-East, Africa, and SE Asia only accounted for 2 percent of global PV demand in the year 2012 but will experience 50 percent annual growth from 2013 to 2017, which will amount to 10 percent of the global cumulative PV capacity (Colville, 2013a).. 27.
(36) Residential PV systems are forecast to decline in the share of the global PV demand during this time, and both utility-scale and non-residential PV markets are set to increase in market share. As grid parity is realized in several PV markets by the year 2017, commercial businesses will be help drive PV demand as they seek to secure energy cost (Colville, 2013a). There is a recent trend in the global PV market that involves distinct local markets with their own policies, product specification requirements, and consumer preferences, as opposed to the single market approach to solar development previously capitalized on by global PV suppliers. Customized supply channels have forced global companies to make adjustments to the products they offer, whereas before the same product would be. 政 治 大 application-specific markets that vary between countries (NPD Solarbuzz, 2013). 立. suitable for different markets. Trade wars and import restrictions is creating. ‧ 國. 學. 3.9 Summary. In Summary, solar PV energy technology had modest beginnings and was not a. ‧. widely-used technology. However, over the last decade it has experienced impressive global growth, especially in key European countries and Japan, as well as the United. y. Nat. sit. States. Government policies have been paramount in stimulating high market growth for. al. n. transformed it into the world’s premier PV market.. Ch. er. io. solar PV energy. In particular, Germany’s government policies for solar PV have. i n U. v. Although Germany and other European countries have been the center stage for. engchi. much of the rapid increase in PV installations over the last several years, the percentage of Europe’s global share of newly installed PV systems is showing signs of waning. Nevertheless, global growth in PV installations is set to continue its increase with emerging markets in the Asia Pacific and North America increasing in share. Over the next several years there will be many different barriers and challenges to entering PV markets that have their own particular set of qualities and requirements. Individual PV markets may contain a preference for domestic products and require specific local technical requirements. Also, the recent wave of protectionism being sought by regional suppliers seeking shelter from China’s huge production capacity has. 28.
(37) brought new challenges to China’s traditional markets. Solar PV suppliers will need to focus on particular target markets in order to achieve adequate market share.. 立. 政 治 大. ‧. ‧ 國. 學. n. er. io. sit. y. Nat. al. Ch. engchi. 29. i n U. v.
(38) 立. 政 治 大. ‧. ‧ 國. 學. n. er. io. sit. y. Nat. al. Ch. engchi. 30. i n U. v.
數據
+2
相關文件
The first row shows the eyespot with white inner ring, black middle ring, and yellow outer ring in Bicyclus anynana.. The second row provides the eyespot with black inner ring
In particular, we present a linear-time algorithm for the k-tuple total domination problem for graphs in which each block is a clique, a cycle or a complete bipartite graph,
You are given the wavelength and total energy of a light pulse and asked to find the number of photons it
好了既然 Z[x] 中的 ideal 不一定是 principle ideal 那麼我們就不能學 Proposition 7.2.11 的方法得到 Z[x] 中的 irreducible element 就是 prime element 了..
volume suppressed mass: (TeV) 2 /M P ∼ 10 −4 eV → mm range can be experimentally tested for any number of extra dimensions - Light U(1) gauge bosons: no derivative couplings. =>
For pedagogical purposes, let us start consideration from a simple one-dimensional (1D) system, where electrons are confined to a chain parallel to the x axis. As it is well known
incapable to extract any quantities from QCD, nor to tackle the most interesting physics, namely, the spontaneously chiral symmetry breaking and the color confinement..
• Formation of massive primordial stars as origin of objects in the early universe. • Supernova explosions might be visible to the most
