A Predictive Scoring System for the Seroclearance of Hepatitis B Surface Antigen in HBeAg-seronegative Chronic Hepatitis B Patients with Genotype B or C Infection
Jessica Liu, M.P.H.1,2, Mei-Hsuan Lee, Ph.D.2,3, Richard Batrla-Utermann, M.D4, Chin-Lan Jen, M.Sc.2, Uchenna H. Iloeje, M.D.5, Sheng-Nan Lu, M.D.6, Li-Yu Wang, Ph.D.7, San-Lin You, Ph.D.2, Chuhsing K. Hsiao, Ph.D.1, Hwai-I Yang, Ph.D.2,8,9, Chien-Jen Chen, Sc.D.1,2, for the R.E.V.E.A.L.-HBV Study Group
1. Graduate Institute of Epidemiology and Preventative Medicine, College of Public Health, National Taiwan University, Taipei, Taiwan
2. The Genomics Research Center, Academia Sinica, Taipei, Taiwan
3. Institute of Clinical Medicine, National Yang Ming University, Taipei, Taiwan 4. Roche Diagnostics, Ltd., Switzerland
5. Global Health Economics and Outcomes Research, Bristol-Myers Squibb Co., USA 6. Department of Gastroenterology, Chang-Gung Memorial Hospital, Kaohsiung, Taiwan 7. MacKay College of Medicine, Taipei, Taiwan
8. Molecular and Genomic Epidemiology Center, China Medical University Hospital 9. Graduate Institute of Clinical Medical Science, China Medical University, Taichung, Taiwan
Reprint requests should be addressed to Dr. Chien-Jen Chen at the Genomics Research Center, Academia Sinica, 128 Academia Road, Section 2, Taipei 115, Taiwan, or through e-mail at chencj@gate.sinica.edu.tw.
Word Count: 4998
Financial Disclosures
Dr. Batrla-Utermann is an employee of Roche Diagnostics, and Dr. Iloeje is an employee of Bristol-Myers Squibb. The other authors report no potential conflict of interest.
Funding: The Department of Health, Taiwan; Bristol-Myers Squibb Co., USA; Academia Sinica, Taiwan; and the National Health Research Institutes (NHRI-EX98-9806PI), Taiwan
Role of the Funding Source
The sponsors of this study had no role in study design, data collection, data analysis, data interpretation, or writing of this report. Moreover, the corresponding author of this
manuscript had full access to all data in the study and had final responsibility for the decision to submit the results of this study for publication.
Abstract
Background: Seroclearance of hepatitis B surface antigen (HBsAg) is the most ideal
endpoint in the treatment of chronic hepatitis B. This study develops a predictive scoring system to assess whether the addition of serum levels HBsAg may improve the predictability of HBsAg loss. Methods: This study included 2491 untreated participants with genotype B or C HBV infection, who were HBsAg-seropositive, HBeAg-seronegative, anti-HCV-seronegative, and cirrhosis free at study entry. Regression coefficients of predictors in Cox Regression models were converted into integer scores for predicting HBsAg seroclearance. Predictive accuracy was assessed with area under the receiver operating characteristic curves (AUROC), and predictive accuracies of models with and without serum HBsAg levels were compared. Results: Low serum levels of both HBsAg and HBV DNA were the strongest predictors of spontaneous HBsAg seroclearance. Compared to baseline serum HBsAg levels ≥1000 IU/mL, the multivariate adjusted rate ratio of spontaneous HBsAg seroclearance was 10.96 (7.92-15.16) for those with baseline serum HBsAg levels <100 IU/mL. The predictive ability of HBsAg levels was modified by HBV viral load, showing a weaker effect in those with higher viral loads, and the strongest effect among those with undetectable viral loads. The inclusion of serum HBsAg levels greatly improved the AUROC for predicting HBsAg seroclearance at the fifth (from 0.79 [0.787-0.792] to 0.89 [0.889-0.891]) and tenth year (from 0.73 [0.728-0.732] to 0.84 [0.839-0.841]) after study entry. Conclusion: Incorporated into an easy-to-use scoring system, HBV viral load and quantitative serum HBsAg levels can accurately predict HBsAg seroclearance.
Chronic hepatitis B is a global public health threat due to its widespread distribution and potential to cause adverse clinical outcomes such as cirrhosis, hepatocellular carcinoma (HCC) and even death.[1-3] The natural history of chronic hepatitis B is typically defined by several phases, which are characterized by changes and interactions among several key seromarkers including alanine aminotransferase (ALT), hepatitis B surface antigen (HBsAg), hepatitis B e antigen (HBeAg), anti-HBe, and hepatitis B virus (HBV) DNA.[4, 5]
Previous studies have shown that HBeAg-seropositive patients are at increased risk for hepatocellular carcinoma, and HBeAg seroconversion is an important milestone for clinical management of these patients.[6] For HBeAg-seronegative patients, HBsAg seroclearance has been well-documented as the most important clinical and treatment endpoint, as it signals immunity to HBV, leads to an improved prognosis, and confers lower rates of HCC.[7, 8] Our previous study from the R.E.V.E.A.L.-HBV cohort found that lowering HBV DNA levels was the most significant predictor of spontaneous HBsAg seroclearance, with 95.8% of individuals reaching undetectable HBV DNA levels prior to spontaneous HBsAg
seroclearance.[9]
Recent technological advances enabled the rapid and inexpensive quantification of HBsAg levels in serum, stimulating interest in the role of quantitative HBsAg in the natural history of chronic hepatitis B.[10] Quantitative HBsAg has been suggested as a promising new
seromarker for the immunological response to therapy for chronic hepatitis B as well as a potential predictor of liver disease progression.[10-14] Recently, the rapid on-treatment decline in serum HBsAg levels, as well as combination of HBsAg and HBV DNA decline has been found to predict sustained virological response to interferon therapy, as well as
been shown to successfully distinguish inactive from active carriers in genotype D patients. [18]
A few recent studies examined the predictability of quantitative HBsAg levels for HBsAg seroclearance, and showed a strong reverse association between serum HBsAg levels and HBsAg seroclearance in clinical patients.[19-22] However, these studies emphasized HBsAg levels as the most important predictor of HBsAg seroclearance without placing enough emphasis on the role of HBV DNA levels, which has been established as an important long-term predictor of HBsAg seroclearance.[19-22] These studies were limited by small sample sizes, clinic-based enrollment of treated patients, and no direct comparison between models with and without the inclusion of serum HBsAg levels. Furthermore, they did not develop a prediction scoring system for HBsAg seroclearance.
Therefore, this study aims to develop a predictive scoring system for spontaneous HBsAg seroclearance in a natural history cohort of treatment naïve HBeAg-seronegative patients affected with genotype B or C chronic hepatitis B, to assess whether the addition of serum HBsAg levels into currently available models may improve the predictability of spontaneous HBsAg seroclearance.
METHODS Study Cohort
From 1991 to 1992, 23,820 individuals aged 30 to 65 years were enrolled from seven townships in Taiwan in the R.E.V.E.A.L.-HBV Study. Participants consented to a
questionnaire interview, physical examination, and blood collection for testing at study entry and follow-up examinations. Consent included follow-up through physical exams, medical
record review, and computerized data linkage with national health insurance, cancer registry, and death certification databases until June 30, 2004. A total of 4155 HBsAg-seropositive and HDV-seronegative participants were included. Participants were excluded if they had no adequate baseline serum samples for HBV DNA and quantitative HBsAg testing (n=572), were seropositive for antibodies against hepatitis C virus (anti-HCV, n=172) or HBeAg (n=521), had cirrhosis detected by abdominal ultrasonography at study entry (n=41), or lacked information on HBsAg seroclearance (n=358). A total of 2491 individuals were included in this analysis. This study was approved by the Institutional Review Board of the College of Public Health, National Taiwan University, Taipei, Taiwan.
Treatment History
Although anti-viral treatment was available during the study period, treatment was not reimbursed by the national health insurance system until October 2003, and was still only available under stringent inclusion criteria. Therefore, we considered the participants in this study as having no previous history of treatment for the follow-up period, and define them as representing a natural history cohort.
Data Collection and Laboratory Methods
Interviews at baseline collected sociodemographic characteristics, family history of major diseases, and dietary and lifestyle habits. Blood collection and health examinations were performed at study entry and every six to twelve months at follow-ups. Serostatus of HBsAg, HBeAg, anti-HCV, and serum levels of HBV DNA and ALT were tested using commercial kits: HBsAg and HBeAg by radioimmunoassay (Abbott Laboratories, North Chicago, IL), anti-HCV by enzyme immunoassay using second-generation test kits (Abbott Laboratories), ALT by serum chemistry autoanalyzer (model 736; Hitachi Co., Tokyo, Japan) using
commercial reagents, and serum HBV DNA levels by polymerase chain reaction (COBAS Amplicor, Roche Diagnostics, Indianapolis, IN) for baseline samples and by real-time polymerase chain reaction (COBAS TaqMan, Roche Diagnostics, Indianapolis, IN) for follow-up samples. These laboratory procedures have been previously described.[23] Serum HBsAg levels at study entry were retrospectively quantified using the Elecsys HBsAg II Quant assay (Roche Diagnostics GmbH, Mannheim, Germany), which has a lower limit of detection of 0.05 IU/ml.
Ascertainment of Spontaneous HBsAg Seroclearance
HBsAg serostatus was tested at follow-up examinations every six to twelve months using an automated chemiluminescent microparticle immunoassay (Architect HBsAg, Abbott
Laboratories). The first instance when a participant tested seronegative for HBsAg, and stayed persistently seronegative at each test afterwards, was determined to be the date of spontaneous HBsAg seroclearance.
Statistical Analysis
Person-years of follow-up began from enrollment to the date of spontaneous HBsAg
seroclearance, death, last-follow-up, or June 30, 2004, whichever came first. Serum levels of HBV DNA and HBsAg were logarithmically transformed for analysis. The Kaplan-Meier method was used to examine the cumulative incidence of spontaneous HBsAg seroclearance according to follow-up time, as well as age, which was done with the late-entry method. The possible non-linear relationship between quantitative serum HBsAg levels and rate ratios of HBsAg seroclearance were examined non-parametrically with restricted cubic splines.[24] Cox proportional hazards models were used to analyze the univariate and multivariate-adjusted rate ratios (with 95% confidence intervals [CI]) of spontaneous HBsAg
seroclearance. Factors that were significant in univariate analyses were included in
multivariate models, and only factors that were also significant in multivariate models were included in the development of prediction models.
Development of Prediction Models
Prediction models for spontaneous HBsAg seroclearance were done using a well-known score-based method.[25] This method was recently successfully applied to the R.E.V.E.A.L.-HBV cohort for accurate prediction of the long-term risk of hepatocellular carcinoma.[26, 27] Cox proportional hazards models were used to estimate regression coefficients for predictors included in the models. Coefficients were converted into integer scores by dividing each regression coefficient by the corresponding coefficient for a 10-year increase in age, then rounding each quotient to the nearest integer.
Measurement of Prediction Accuracy
Predictive accuracy of the prediction models was assessed using time dependent receiver operating characteristic (ROC) curves, and by examining sensitivity, specificity, and the area under the ROC (AUROC) for the five-year and ten-year prediction of spontaneous HBsAg seroclearance.[28] Calibration of the prediction model was assessed by calculating the correlation between the mean predicted 5- and 10-year probability of seroclearance and the actual observed probability of HBsAg seroclearance using a bootstrap method. Statistical significance was determined by two-tailed tests (P < 0.05). Analyses were performed with SAS software (version 9.2; SAS Institute, Cary, NC).
RESULTS
Among 2491 individuals and 19,997 person-years of follow-up, 523 cases of HBsAg seroclearance occurred, giving an incidence rate of 26.15 per 1,000 person-years. The average age of study participants was 46.4 years, and most were male (63.9%). Most had serum ALT levels less than the ULN (86%), body mass index (BMI) less than 30 kg/m2 (95.7%), were genotype B (58.9%), had serum HBV DNA <2000 IU/mL (66.4%), and serum HBsAg levels less than 1,000 IU/mL (62.5%) (Table 1).
Cumulative Lifetime Incidence of HBsAg Seroclearance
The cumulative lifetime incidence of HBsAg seroclearance at ages 40, 50, 60, 70 and 77 among those with detectable serum HBV DNA (≥57 IU/mL) was 3.0%, 14.4%, 26.5%, 42.6%, and 62.1%, respectively. On the other hand, the cumulative lifetime incidence of HBsAg seroclearance at ages 40, 50, 60, 70 and 77 among those with undetectable (<57 IU/mL) HBV DNA was 31.5%, 56.7%, 74.2%, 89.1%, and 98.8%, respectively (Figure 1A).
Determinants of Spontaneous HBsAg seroclearance
In univariate analyses, older age, cigarette smoking, higher BMI, and serum levels of HBV DNA and HBsAg were associated with HBsAg seroclearance (Table 1). Genotype was not associated with HBsAg seroclearance. A significant reverse biological gradient was observed between serum levels of HBV DNA and HBsAg and incidence rates of HBsAg
seroclearance; compared to HBV DNA ≥200,000 IU/mL or HBsAg ≥1000 IU/mL, those with undetectable HBV DNA or HBsAg <100 IU/mL had higher rates of HBsAg seroclearance. The 13-year cumulative incidence of HBsAg seroclearance for serum HBsAg levels of ≥1,000, 100-999, and <100 IU/ml was 16.8%, 53.6%, and 75.4%, respectively.
Using multivariate-adjusted restricted cubic spline curves, there was a significant relationship between decreasing serum levels of HBV DNA and HBsAg and increasing rate ratios of spontaneous HBsAg seroclearance. A decrease from 4 log10 IU/mL to 1 IU/mL of serum HBsAg showed a rate ratio increase from 1.66 to 21.3, while a decrease from 5 log10 IU/mL to undetectable HBV DNA showed a rate ratio increase from 1.47 to 5.00 (Figures 1B and 1C).
Predictors of HBsAg Seroclearance Stratified by Baseline HBV DNA Levels
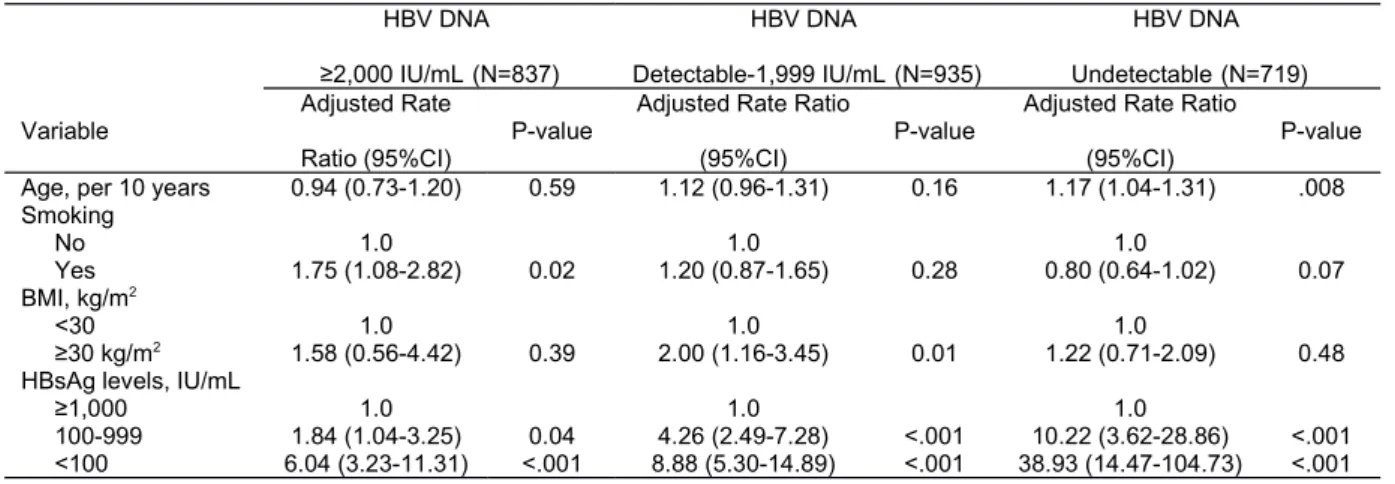
In multivariate analyses, the associations between spontaneous HBsAg seroclearance and serum HBsAg levels were stronger among those with lower baseline serum HBV DNA levels (Table 2). Among those with baseline serum HBV DNA levels ≥2,000 IU/mL, compared to individuals with baseline serum HBsAg levels ≥1000 IU/mL, the multivariate-adjusted rate ratio (95% CI) of spontaneous HBsAg seroclearance was 1.84 (1.04-3.25) and 6.04 (3.23-11.31) for serum HBsAg levels of 100-999 and <100 IU/mL, respectively. In contrast, among those with undetectable baseline serum HBV DNA levels, the corresponding multivariate-adjusted rate ratios (95% CI) were 10.22 (3.62-28.86)and 38.93 (14.47-104.73), respectively.
Long-Term Tracking of Serum HBsAg Levels
Among those with undetectable HBV DNA levels, serum HBsAg levels prior to
seroclearance showed a steady decrease until HBsAg seroclearance (Figure 2A). However, among those with detectable HBV DNA levels, serum HBsAg levels remained relatively stable, until a sharp decrease approximately two years prior to HBsAg seroclearance (Figure 2B).
Predictors significantly associated with spontaneous HBsAg seroclearance in multivariate analyses were included in two prediction models for HBsAg seroclearance (Table 3). The first model included age, BMI, and baseline serum HBV DNA levels. While smoking habit was statistically significant, adding it into the model did not change the predictability of HBsAg and thus it was not included. Model 2 included age, BMI, and baseline serum HBV DNA and HBsAg levels. In Model 1, lower serum HBV DNA levels were the most
significant predictor of increasing rates of HBsAg seroclearance, and those with undetectable baseline serum HBV DNA levels had a multivariate-adjusted rate ratio (95% CI) of
spontaneous HBsAg seroclearance of 5.60 (4.30-7.28). In Model 2, serum HBsAg levels were the strongest predictor of HBsAg seroclearance. While serum HBV DNA level was still significant, its rate ratios decreased after adjustment for serum HBsAg levels. Compared to participants with baseline serum HBsAg levels ≥1,000 IU/mL, the multivariate-adjusted rate ratio (95% CI) of spontaneous HBsAg seroclearance was 3.55 (2.51-5.02) and 10.96 (7.92-15.16),respectively, for those with serum HBsAg levels of 100-999 and <100 IU/mL. The integer predictive scores derived from the regression coefficients of each predictor in the two prediction models are also shown in Table 3. Total scores ranged between 0-12 and 0-30 for Models 1 and 2, respectively.
Discrimination and Calibration of Prediction Model
To compare the predictability of the two models, the five- and ten-year predictive accuracy was assessed using time-dependent ROC curves (Figures 3A and 3B). The predictive
accuracy of the new prediction model including serum HBsAg levels was significantly better than the previous Model 1 (P<.001). The AUROC significantly increased from 0.79 (0.787-0.792) to 0.89 (0.889-0.891) for predicting the five-year probability of spontaneous HBsAg seroclearance, and from 0.73 (0.728-0.732) to 0.84 (0.839-0.841) for ten-year prediction. The
calibration of the new prediction model including HBsAg levels showed correlation coefficients of 0.961 and 0.975 (P<.001), respectively, for five and ten-year prediction.
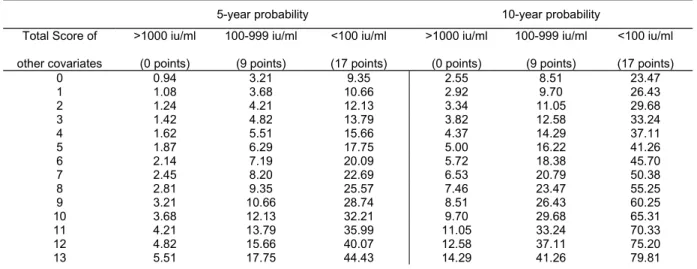
A list of 5-year and 10-year probabilities of spontaneous HBsAg seroclearance by serum HBsAg level and the total score of other predictors is shown in Table 4. In order to
emphasize the difference in spontaneous HBsAg seroclearance probabilities among different serum HBsAg levels, the listed probabilities are stratified, using serum HBsAg levels as a base score. Scores of age, BMI, and serum levels of HBV DNA in Model 2 of Table 3 were summed to derive the total score of other predictors. For example, a 45-year-old male with BMI <30 kg/m2 and undetectable serum HBV DNA has a total score of the other predictors of 8 (1+0+7). If he has a serum HBsAg level of 100-999 IU/mL, his 5-year and 10-year probability of spontaneous HBV seroclearance are 9.35% and 23.47%, respectively.
DISCUSSION
The spontaneous seroclearance of HBsAg is the most important endpoint in chronic hepatitis B infection because it confers a good prognosis.[8, 29, 30] Fully elucidating its determinants and predicting its occurrence is important for the prevention of liver disease progression. Our previous study found that decreasing serum HBV DNA level was the most important
predictor of HBsAg seroclearance.[9] However, recent studies have shown an association between serum HBsAg levels and HBsAg seroclearance.[18, 19] This study is the first to examine whether the addition of quantitative serum HBsAg levels into current models may increase the predictability of spontaneous HBsAg seroclearance in a large community-based natural history study of previously untreated individuals.
In accordance with recent studies which reported serum HBsAg levels as the most important predictor of HBsAg seroclearance among HBeAg-seronegative individuals and those with low HBV viral loads,[19-22] our study also found the importance of serum HBsAg levels in predicting HBsAg seroclearance. Previous studies emphasized serum HBsAg levels alone as an independent predictor.[19-22] However, our study further emphasizes the important role of HBV viral loads in predicting HBsAg seroclearance in addition to serum HBsAg levels.
We found a significant biological gradient between decreasing serum HBsAg levels and increasing rates of HBsAg seroclearance, even after adjustment for serum HBV DNA level. The cumulative lifetime incidence of HBsAg seroclearance was significantly higher among individuals with undetectable HBV DNA levels. Moreover, although the effect of serum HBsAg levels was extremely high for those with undetectable serum HBV DNA levels, its effect decreased strikingly, among those with baseline serum HBV DNA levels ≥2,000 IU/mL.
The predictive ability of serum HBsAg levels varies according to different phases of disease and is, most importantly, HBV DNA dependent. In other words, serum HBV DNA levels continue to play a crucial role in spontaneous HBsAg seroclearance. It is also important to lower serum levels of HBsAg in order to maximize the probability of HBsAg seroclearance, especially in those with undetectable HBV DNA levels.
Based on results from the R.E.V.E.A.L.-HBV study, in Asian chronic hepatitis B patients with genotypes B or C infection who were HBeAg- seropositive, serum HBV DNA levels were the most significant predictor of HBsAg seroclearance, while serum HBsAg levels did not play a significant role.[31] In this study, among HBeAg-seronegative Asian patients
infected with genotypes B or C with predominantly normal ALT levels and viral loads ≥2,000 IU/mL, serum HBV DNA and HBsAg levels were equivalently important for the prediction of HBsAg seroclearance. Among those who were HBeAg-seronegative with viral loads <2,000 IU/mL, serum HBsAg levels became the most important predictor, while HBV DNA levels were less important (Table 2). Thus, the study by Tseng et al. may not have found HBV DNA levels to predict HBsAg seroclearance because the study was limited to individuals with low viral loads.[19] While ALT levels were previously found to predict HBsAg seroclearance, in the present cohort they did not play a role, perhaps due to the low frequency of ALT elevation.
Current treatment guidelines use HBV DNA levels as the main tool for monitoring chronic hepatitis B, but have slowly begun to incorporate serum HBsAg levels,[8] and strongly suggest that the use of serum HBsAg levels in addition to serum HBV DNA levels may further refine clinical management of patients with chronic hepatitis B. Studies have shown a positive correlation between serum HBsAg and liver cccDNA levels, although this positive correlation was not always found in HBeAg-seronegative patients. [7, 12, 13, 32] Serum HBsAg levels may reflect the translation of mRNA’s produced from cccDNA, although the association between HBsAg and HBV replication seems to break down in HBeAg-negative disease.[10, 13, 32] Although its exact role still needs to be elucidated, serum HBsAg may reflect the balance between the virus and host immune response rather than viral replication alone.
Previous studies have proposed cutoff points of serum HBsAg levels for the prediction of HBsAg seroclearance. However, it is important to note that probability of HBsAg
instead of being defined by HBsAg levels alone. In this cohort study, two separate score-based prediction models were developed that were able to accurately estimate the probability of HBsAg seroclearance for different clinical profiles. While the first model containing only serum HBV DNA levels provided moderate predictive accuracy of the 5-year and 10-year probability of HBsAg seroclearance, the addition of serum HBsAg levels provided a significant improvement in both 5-year and 10-year predictive accuracy. The model containing both HBV DNA and serum HBsAg levels showed excellent calibration. Correlation coefficients between predicted and observed risks were all greater than 0.95.
The score-based prediction model has been widely used by the Framingham Heart Study to estimate the risk of coronary heart disease.[25] In the case of chronic hepatitis B, this methodology has been successfully applied in predicting the long-term risk of HCC.[26, 27] The predictive score system in this study not only incorporates other well-known predictors of HBsAg seroclearance, but captures a profile-based probability distribution for spontaneous HBsAg seroclearance that can be used to further stratify risk groups and refine clinical management of patients with chronic hepatitis B. A simple score-based prediction model can potentially eliminate the need for complicated calculations in clinical settings, allowing clinicians to easily make clinical decisions in patient treatment while helping clinicians to provide a personalized consultation to each patient.
There are some limitations to be noted. This study only included baseline serum HBsAg levels, thus the long-term change in serum HBsAg levels must be further elucidated. An ongoing study from the R.E.V.E.A.L. group will perform long-term repeated measurements of HBsAg levels to examine HBsAg kinetics and its association with seroclearance and clinical outcomes. In addition, participants in this study were treatment naïve chronic HBV
carriers. Therefore, the applicability of these results to patients undergoing treatment needs to be explored. Lastly, this study was limited to participants between 30 and 65 years old mostly infected at birth through perinatal infection with HBV genotype B and/or C. Therefore, rates of seroclearance in this study may differ from other genotypes. In addition, the predictive score needs to be clarified in younger carriers, those infected in adulthood, or in individuals infected with other HBV genotypes.
CONCLUSION
The addition of serum HBsAg levels to current HBV DNA-based models significantly improves the predictability of HBsAg seroclearance among genotype B and C HBeAg-seronegative individuals. Both serum HBsAg and HBV DNA levels should be considered in the future monitoring of chronic hepatitis B, as they provide complementary information. Additional studies exploring HBsAg kinetics among different populations are still needed.
Acknowledgements
Other members of R.E.V.E.A.L.-HBV Study Group are as follows: National Taiwan
University Hospital: C. Y. Hsieh, H.S. Lee, P. M. Yang, C. H. Chen, J. D. Chen, S. P. Huang, C. F. Jan. National Taiwan University: T. H. H. Chen. National Defense Medical Center: C. A. Sun. Taipei City Psychiatric Center: M. H. Wu. Tzu Chi University: S. Y. Chen. Shin Kong Wu Ho-Su Memorial Hospital: K. E. Chu. Huhsi Health Center,
Penghu County: S. C. Ho, T. G. Lu. Provincial Penghu Hospital:W. P.Wu, T. Y. Ou. Sanchi Health Center, Taipei County: C. G. Lin. Provincial Chutung Hospital: K. C. Shih. Provincial Potzu Hospital: W. S. Chung, C. Li. Kaohsu Health Center, Pingtung County:
C. C. Chen. Paihsa Health Center, Penghu County: W. C. How.
Author Contributions:
Dr. Chien-Jen Chen had full access to all of the data in the study and takes responsibility for the integrity of the data as well as the accuracy of the data analysis.
Study concept and design: C.-J.C., J.L., M.-H.L., H.-I.Y.
Acquisition of data: J.L., M.-H.L., C.-L.J., S.-N.L., L.-Y.W., S.-L.Y., H.-I.Y., C.-J.C. Analysis and interpretation of data: J.L., M.-H.L., H.-I.Y., C.-J.C.
Drafting of the manuscript: J.L.
Critical revision of the manuscript for important intellectual content: J.L., M.-H.L., R.B.-U., C.-L.J., U.H.I., S.-N.L., L.-Y.W., S.-L.Y., K.C.H., H.-I.Y., C.-J.C.
Obtained funding: C.-J.C.
Administrative, technical, or material support: J.L., M.-H.L., R.B.-U., C.-L.J., U.H.I., S.-N.L., L.-Y.W., S.-L.Y., K.C.H., H.-I.Y., C.-J.C.
References
[1] Yuen MF, Lai CL. Natural history of chronic hepatitis B virus infection. J Gastroenterol Hepatol 2000;15 Suppl:E20-24.
[2] Lavanchy D. Hepatitis B virus epidemiology, disease burden, treatment, and current and emerging prevention and control measures. J Viral Hepat 2004;11:97-107.
[3] Lee WM. Hepatitis B virus infection. N Engl J Med 1997;337:1733-1745. [4] Liaw YF, Chu CM. Hepatitis B virus infection. Lancet 2009;373:582-592.
[5] Yang HI, Hung HL, Lee MH, Liu J, Jen CL, Su J, et al. Incidence and Determinants of Spontaneous Seroclearance of HB e Antigen and DNA in Patients with Chronic Hepatitis B. Clinical Gastroenterology and Hepatology 2011.
[6] Yang HI, Lu SN, Liaw YF, You SL, Sun CA, Wang LY, et al. Hepatitis B e antigen and the risk of hepatocellular carcinoma. N Engl J Med 2002;347:168-174.
[7] Chu CM, Liaw YF. Hepatitis B surface antigen seroclearance during chronic HBV infection. Antivir Ther 2010;15:133-143.
[8] EASL clinical practice guidelines: Management of chronic hepatitis B virus infection. J Hepatol 2012;57:167-185.
[9] Liu J, Yang HI, Lee MH, Lu SN, Jen CL, Wang LY, et al. Incidence and determinants of spontaneous hepatitis B surface antigen seroclearance: a community-based follow-up study. Gastroenterology 2010;139:474-482.
[10] Liaw YF. Clinical utility of hepatitis B surface antigen quantitation in patients with chronic hepatitis B: A review. Hepatology 2011;53:2121-2129.
[11] Nguyen T, Desmond P, Locarnini S. The role of quantitative hepatitis B serology in the natural history and management of chronic hepatitis B. Hepatol Int 2009.
[12] Chan HL, Wong VW, Tse AM, Tse CH, Chim AM, Chan HY, et al. Serum hepatitis B surface antigen quantitation can reflect hepatitis B virus in the liver and predict treatment response. Clin Gastroenterol Hepatol 2007;5:1462-1468.
[13] Thompson AJ, Nguyen T, Iser D, Ayres A, Jackson K, Littlejohn M, et al. Serum hepatitis B surface antigen and hepatitis B e antigen titers: disease phase influences correlation with viral load and intrahepatic hepatitis B virus markers. Hepatology 2010;51:1933-1944.
[14] Jaroszewicz J, Calle Serrano B, Wursthorn K, Deterding K, Schlue J, Raupach R, et al. Hepatitis B surface antigen (HBsAg) levels in the natural history of hepatitis B virus (HBV)-infection: a European perspective. J Hepatol 2010;52:514-522.
[15] Rijckborst V, Hansen BE, Cakaloglu Y, Ferenci P, Tabak F, Akdogan M, et al. Early on-treatment prediction of response to peginterferon alfa-2a for HBeAg-negative chronic hepatitis B using HBsAg and HBV DNA levels. Hepatology 2010;52:454-461.
[16] Sonneveld MJ, Rijckborst V, Boucher CA, Hansen BE, Janssen HL. Prediction of sustained response to peginterferon alfa-2b for hepatitis B e antigen-positive chronic hepatitis B using on-treatment hepatitis B surface antigen decline. Hepatology 2010;52:1251-1257. [17] Rijckborst V, Hansen BE, Ferenci P, Brunetto MR, Tabak F, Cakaloglu Y, et al. Validation of a stopping rule at week 12 using HBsAg and HBV DNA for HBeAg-negative patients treated with peginterferon alfa-2a. J Hepatol 2012;56:1006-1011.
[18] Brunetto MR, Oliveri F, Colombatto P, Moriconi F, Ciccorossi P, Coco B, et al. Hepatitis B surface antigen serum levels help to distinguish active from inactive hepatitis B virus genotype D carriers. Gastroenterology 2010;139:483-490.
[19] Tseng TC, Liu CJ, Yang HC, Su TH, Wang CC, Chen CL, et al. Determinants of spontaneous surface antigen loss in hepatitis B e antigen-negative patients with a low viral load. Hepatology 2012;55:68-76.
[20] Chan HL, Wong GL, Tse CH, Chan HY, Wong VW. Viral determinants of hepatitis B surface antigen seroclearance in hepatitis B e antigen-negative chronic hepatitis B patients. J Infect Dis 2011;204:408-414.
[21] Tseng TC, Liu CJ, Su TH, Wang CC, Chen CL, Chen PJ, et al. Serum hepatitis B surface antigen levels predict surface antigen loss in hepatitis B e antigen seroconverters. Gastroenterology 2011;141:517-525, 525 e511-512.
[22] Seto WK, Wong DK, Fung J, Hung IF, Fong DY, Yuen JC, et al. A large case-control study on the predictability of hepatitis B surface antigen levels three years before hepatitis B surface antigen seroclearance. Hepatology 2012;56:812-819.
[23] Chen CJ, Iloeje UH, Yang HI. Long-term outcomes in hepatitis B: the REVEAL-HBV study. Clin Liver Dis 2007;11:797-816, viii.
[24] Durrleman S, Simon R. Flexible regression models with cubic splines. Statistics in Medicine 1989;8:551-561.
[25] Sullivan LM, Massaro JM, D'Agostino RB, Sr. Presentation of multivariate data for clinical use: The Framingham Study risk score functions. Stat Med 2004;23:1631-1660. [26] Yang HI, Sherman M, Su J, Chen PJ, Liaw YF, Iloeje UH, et al. Nomograms for risk of hepatocellular carcinoma in patients with chronic hepatitis B virus infection. J Clin Oncol 2010;28:2437-2444.
[27] Yang HI, Yuen MF, Chan HL, Han KH, Chen PJ, Kim DY, et al. Risk estimation for hepatocellular carcinoma in chronic hepatitis B (REACH-B): development and validation of a predictive score. Lancet Oncol 2011;12:568-574.
[28] Heagerty PJ, Lumley T, Pepe MS. Time-dependent ROC curves for censored survival data and a diagnostic marker. Biometrics 2000;56:337-344.
[29] Ahn SH, Chan HL, Chen PJ, Cheng J, Goenka MK, Hou J, et al. Chronic hepatitis B: whom to treat and for how long? Propositions, challenges, and future directions. Hepatol Int 2010;4:386-395.
[30] Simonetti J, Bulkow L, McMahon BJ, Homan C, Snowball M, Negus S, et al. Clearance of hepatitis B surface antigen and risk of hepatocellular carcinoma in a cohort chronically infected with hepatitis B virus. Hepatology 2010;51:1531-1537.
[31] Liu J, Lee MH, Batrla R, Jen CL, Iloeje UH, Lu SN, et al. Differences in the Role of Quantitative Hepatitis B Surface Antigen between HBeAg Seropositive and Seronegative Individuals with Chronic Hepatitis B. Journal of Hepatology 2012;56:S187.
[32] Volz T, Lutgehetmann M, Wachtler P, Jacob A, Quaas A, Murray JM, et al. Impaired intrahepatic hepatitis B virus productivity contributes to low viremia in most
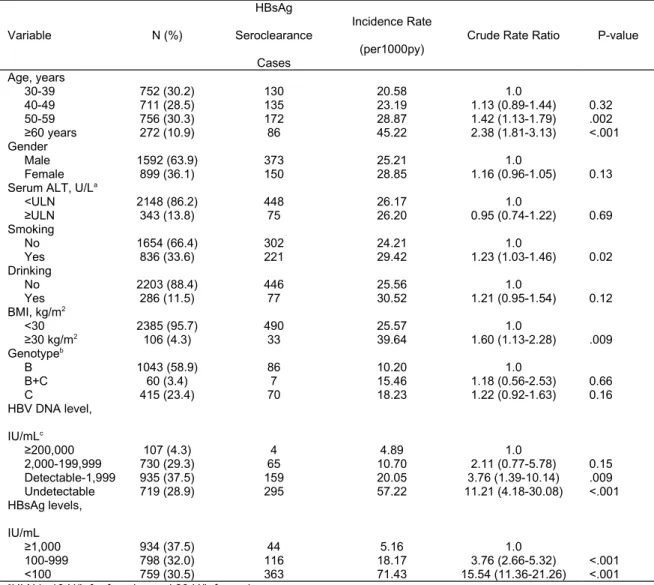
Table 1: Incidence Rates and Crude Rate Ratios of HBsAg Seroclearance Variable N (%) HBsAg Seroclearance Cases Incidence Rate (per1000py)
Crude Rate Ratio P-value
Age, years 30-39 752 (30.2) 130 20.58 1.0 40-49 711 (28.5) 135 23.19 1.13 (0.89-1.44) 0.32 50-59 756 (30.3) 172 28.87 1.42 (1.13-1.79) .002 ≥60 years 272 (10.9) 86 45.22 2.38 (1.81-3.13) <.001 Gender Male 1592 (63.9) 373 25.21 1.0 Female 899 (36.1) 150 28.85 1.16 (0.96-1.05) 0.13
Serum ALT, U/La
<ULN 2148 (86.2) 448 26.17 1.0 ≥ULN 343 (13.8) 75 26.20 0.95 (0.74-1.22) 0.69 Smoking No 1654 (66.4) 302 24.21 1.0 Yes 836 (33.6) 221 29.42 1.23 (1.03-1.46) 0.02 Drinking No 2203 (88.4) 446 25.56 1.0 Yes 286 (11.5) 77 30.52 1.21 (0.95-1.54) 0.12 BMI, kg/m2 <30 2385 (95.7) 490 25.57 1.0 ≥30 kg/m2 106 (4.3) 33 39.64 1.60 (1.13-2.28) .009 Genotypeb B 1043 (58.9) 86 10.20 1.0 B+C 60 (3.4) 7 15.46 1.18 (0.56-2.53) 0.66 C 415 (23.4) 70 18.23 1.22 (0.92-1.63) 0.16 HBV DNA level, IU/mLc ≥200,000 107 (4.3) 4 4.89 1.0 2,000-199,999 730 (29.3) 65 10.70 2.11 (0.77-5.78) 0.15 Detectable-1,999 935 (37.5) 159 20.05 3.76 (1.39-10.14) .009 Undetectable 719 (28.9) 295 57.22 11.21 (4.18-30.08) <.001 HBsAg levels, IU/mL ≥1,000 934 (37.5) 44 5.16 1.0 100-999 798 (32.0) 116 18.17 3.76 (2.66-5.32) <.001 <100 759 (30.5) 363 71.43 15.54 (11.36-21.26) <.001
aULN is 19 U/L for females and 30 U/L for males bOnly available among those with detectable HBV DNA c The HBV DNA detection limit was 57 IU/mL
Table 2: Multivariate Analyses of HBsAg Seroclearance Stratified by HBV DNA Level HBV DNA ≥2,000 IU/mL(N=837) HBV DNA Detectable-1,999 IU/mL(N=935) HBV DNA Undetectable(N=719)
Variable Adjusted Rate
Ratio (95%CI)
P-value Adjusted Rate Ratio
(95%CI)
P-value Adjusted Rate Ratio
(95%CI)
P-value
Age, per 10 years 0.94 (0.73-1.20) 0.59 1.12 (0.96-1.31) 0.16 1.17 (1.04-1.31) .008
Smoking No 1.0 1.0 1.0 Yes 1.75 (1.08-2.82) 0.02 1.20 (0.87-1.65) 0.28 0.80 (0.64-1.02) 0.07 BMI, kg/m2 <30 1.0 1.0 1.0 ≥30 kg/m2 1.58 (0.56-4.42) 0.39 2.00 (1.16-3.45) 0.01 1.22 (0.71-2.09) 0.48
HBsAg levels, IU/mL
≥1,000 1.0 1.0 1.0
100-999 1.84 (1.04-3.25) 0.04 4.26 (2.49-7.28) <.001 10.22 (3.62-28.86) <.001
Table 3: Two Prediction Models for HBsAg Seroclearance with Associated Prediction Scores
MODEL 1: HBV DNA only MODEL 2: HBV DNA + qHBsAg
Variable
Adjusted Rate Ratio (95%CI)
Regression
Coefficient P-value Score
Adjusted Rate Ratio (95% CI)
Regression
Coefficient P-value Score
Age, (per year) 1.03 (1.02-1.04) 0.2659a <.001 1.01 (1.01-1.02) 0.1376* .002
30-39 0 0 40-49 1 1 50-59 2 2 ≥60 3 3 BMI, kg/m2 <30 1.0 Reference 0 1.0 Reference 0 ≥30 kg/m2 1.46 (1.03-2.08) 0.37821 0.03 2 1.46 (1.02-2.08) 0.37602 0.04 3 HBV DNA level, IU/mLb ≥2,000 1.0 Reference 0 1.0 Reference 0 Detectable-1,999 1.92 (1.44-2.55) 0.65074 <.001 3 1.31 (0.98-1.74) 0.26618 0.07 2 Undetectable 5.60 (4.30-7.28) 1.72222 <.001 7 2.57 (1.95-3.40) 0.94490 <.001 7 HBsAg levels, IU/mL
≥1,000 Not included 1.0 Reference 0
100-999 3.55 (2.51-5.02) 1.26650 <.001 9
<100 10.96 (7.92-15.16) 2.39402 <.001 17
aCoefficient is for each 10-year increase in age bThe HBV DNA detection limit is 57 IU/mL
Table 4: Predicted 5- and 10-year Probabilities of HBsAg Seroclearance
5-year probability 10-year probability
Total Score of other covariates >1000 iu/ml (0 points) 100-999 iu/ml (9 points) <100 iu/ml (17 points) >1000 iu/ml (0 points) 100-999 iu/ml (9 points) <100 iu/ml (17 points) 0 0.94 3.21 9.35 2.55 8.51 23.47 1 1.08 3.68 10.66 2.92 9.70 26.43 2 1.24 4.21 12.13 3.34 11.05 29.68 3 1.42 4.82 13.79 3.82 12.58 33.24 4 1.62 5.51 15.66 4.37 14.29 37.11 5 1.87 6.29 17.75 5.00 16.22 41.26 6 2.14 7.19 20.09 5.72 18.38 45.70 7 2.45 8.20 22.69 6.53 20.79 50.38 8 2.81 9.35 25.57 7.46 23.47 55.25 9 3.21 10.66 28.74 8.51 26.43 60.25 10 3.68 12.13 32.21 9.70 29.68 65.31 11 4.21 13.79 35.99 11.05 33.24 70.33 12 4.82 15.66 40.07 12.58 37.11 75.20 13 5.51 17.75 44.43 14.29 41.26 79.81
Figure Legends
Figure 1: Cumulative Lifetime Incidence and Cubic Spline Regression Curves of Spontaneous HBsAg Seroclearance.
(A) Cumulative Lifetime Incidence of Spontaneous HBsAg Seroclearance
(B) Rate Ratio with 95% CI of Spontaneous HBsAg Seroclearance In Relation to Continuous HBsAg levels
(C) Rate Ratio with 95% CI of Spontaneous HBsAg Seroclearance In Relation to Continuous HBV DNA levels.
Figure 2: Changes in Serum HBsAg Levels Prior to HBsAg Seroclearance
(A) Changes among Those with Undetectable Serum HBV DNA Levels (B) Changes among Those with Detectable Serum HBV DNA Levels
Figure 3: Receiver Operating Characteristic Curves (ROC) and Areas under ROC’s (AUROC) for Predicting Spontaneous HBsAg Seroclearance
(A) ROC Curve for Prediction at the Fifth Year (B) ROC Curve for Prediction at the Tenth Year