The prebiotic arabinogalactan of Anoectochilus formosanus prevents
ovariectomy-induced osteoporosis in mice
Li-Chan Yanga, Ting-Jang Lua, Wen-Chuan Linb,*
aInstitute of Food Science and Technology, National Taiwan University, Taipei, Taiwan.
bSchool of Medicine, Graduate Institute of Basic Medical Science and Tsuzuki Institute for Traditional Medicine, China Medical University, Taichung, Taiwan
*Corresponding author: Department of Pharmacology, China Medical University, No. 91 Hsueh Shih Road, Taichung, Taiwan, R.O.C. Tel +886 4 22053366; fax +886 4 22053764
e-mail address: [email protected] (W.C. Lin)
Keywords: Prebiotic; Arabinogalactan; Osteoporosis; Short chain fatty acids 1 2 3 4 5 6 7 8 9 10 11 12 13 14 15 16 17 18 19 20 21 22 23
ABSTRACT: Anoectochilus formosanus (Orchidaceae) has exhibited anti-osteoporosis and prebiotic properties in previous studies. In this study, these bioactivities were verified and associated with an isolated type II arabinogalactan (AGAF) in ovariectomized (OVX) mice model. Female ICR mice were OVX and administrated AGAF (5 and 15 mg/kg) or inulin (400 mg/kg) orally for 3 weeks. Streptomycin was used for blocking the bioactivities of AGAF. In results, AGAF increased the level of fecal bifidobacteria, cecal soluble Ca and short chain fatty acids. Comparing to OVX control group, AGAF improved bone mineral content, trabecular bone volume, and the number of trabecular significantly. In RT-PCR analysis, AGAF reduced the expression of tartrate-resistant acid phosphatase, cathepsin K, and osteocalcin. Streptomycin inhibited both anti-osteoporosis and prebiotic effects of AGAF. In vitro experiments revealed butyrate, not AGAF could activate osteoblasts and inhibit osteoclasts differentiation. In conclusion, this study showed AGAF prevented bone loss in OVX mice through prebiotic effects in vivo and in vitro. 24 25 26 27 28 29 30 31 32 33 34 35 36 37 38
1. Introduction
Osteoporosis is the most common skeletal problem caused by aging, especially in postmenopausal women (Pietschmann, et al., 2009). The deficiency of ovarian hormones is a major factor in postmenopausal osteoporosis. Bone loss may lead to related fractures and high medical costs. Hormone supplements and bisphosphonate are common therapies for osteoporosis; however, these therapies have several side effects. For example, hormone supplements increase the risk of cardiovascular disease and breast cancer; the risk of bisphosphate includes osteonecrosis of the jaw and atypical femur fractures (de Villiers & Stevenson, 2012; Khosla, et al., 2012). The lack of reliable and effective therapies to cure osteoporosis-related fragility fractures remains an important global issue (Datta, 2011). Previous studies have indicated that certain nutritional factors, such as fruit, prebiotics, and minerals, can increase bone mineral density in people diagnosed with osteoporosis (Devareddy, et al. 2008; Chen, et al., 2006; Stransky & Rysava, 2009). Nutrition could prevent and treat osteoporosis with fewer side effects than medicine therapies (Stransky & Rysava, 2009). Prebiotics are food component not absorbed or digested in the small intestine but are fermented by microbiota in the large intestine (Roberfroid, 2005). Several prebiotics, such as inulin, galactooligosaccharides, and fructooligosaccharides, are thought to improve bone health (Roberfroid, 2005;Weaver, 2005). The microbial fermentation products of prebiotics, such as short chain fatty acids (SCFA), are responsible for the increase of calcium (Ca) absorption in the large intestine. The high concentration of SCFA in the cecum leads to a decrease of cecal pH, which increases the concentrations of soluble Ca (Coxam, 2007).In addition, butyrate, one of the SCFA, belongs to a new class of 39 40 41 42 43 44 45 46 47 48 49 50 51 52 53 54 55 56 57 58 59 60 61 62 63
antiosteoporotic agents that may be useful in the treatment of bone loss (Katono, et al., 2008; Rahman, et al., 2003; Schroeder & Westendorf, 2005). Furthermore, numerous reports have indicated that the ingestion of prebiotics or fermentable dietary fibers might be helpful in preventing osteoporosis (Coxam, 2007; Mitamura, et al., 2004).
Anoectochilus formosanus (Orchidaceae) is an important ethnomedicinal plant in Taiwan. It has been popularly used as a nutraceutical herbal tea in Taiwan and other Asian countries (Du, et al., 2008). In Taiwan, the aqueous extracts of A. formosanus have been certified as health food for hepatoprotection bioactivity
and showed safety in the 13 week oral toxicity study in rats. In additional, Chang, et al. have indicated that A. formosamus plants cultivated by artificial are safe for use as an herbal medicine (Chang, et al., 2007). Several reports have shown that crude extracts of A. formosanus could ameliorate osteoporosis in the ovariectomized(OVX) rat model (Shih, et al.,2001; Masuda, et al., 2008; Yang, et al., in press).Masuda et al. shows that aqueous extracts of A. formosanus suppress bone loss caused by estrogen deficiency by inhibiting osteoclast formation (Masuda, et al., 2008). Our previous study also shows that water extracts of A. formosanus prevent bone loss in rats caused by OVX (Yang, et al., in press). In our previous studies, an indigestible polysaccharide isolated from A. formosanus was shown to be a potent prebiotic (Yang, et al., 2012). the indigestible polysaccharide of A. formosanus was mainly composed of type II arabinogalactan (AGAF). Water extracts of A. formosanus could enhance the level of cecal SCFAs and increase the number of fecal bifidobacteria in rats (Yang, et al., 2012).Therefore, it was suggested that the anti-osteoporosis activity of A. formosanus may be regulated by its prebiotic effect. This study examines the anti-osteoporosis effects of AGAF in OVX mice, and investigates 64 65 66 67 68 69 70 71 72 73 74 75 76 77 78 79 80 81 82 83 84 85 86 87 88
the relationship of prebiotic properties and anti-osteoporosis activity.
2. Materials and methods
2.1. Arabinogalactan preparation
Cultured A. formosanus was purchased from Yu-Jung Farm (Pu-Li, Taiwan). Fresh plants were homogenized with distilled water, and then partitioned with ethyl acetate (Tedia Company, OH, USA). The aqueous extracts of A. formosanus were added with a 4-fold volume of 95% ethanol to precipitate crude polysaccharides, and then the crude polysaccharide was treated with α-amylase, protease and protease (Megazyme, Wicklow, Ireland) to remove starches and proteins. After enzymic treatment, AGAF was preserved in ethanol until use.
The identity and content of type II arabinogalactan in AGAF (> 80%) were analyzed by precipitation with β-glucosyl yariv reagent according to a previous study (Yang et al., 2012). For an in vivo experiment, AGAF was dissolved in distilled water, and concentrations of 0.5 and 1.5 mg/mL were prepared.
The yield rate of AGAF was 0.15% from fresh plants. Chemical analyses showed that AGAF contained 95.5% carbohydrates and 1.0% protein. AGAF is mainly composed of a (1→3)-β-D-galactan backbone with a (1→6)-β-D-galactan side chain, and is a type II arabinogalactan with an average molecular weight of 29 kDa. The monosaccharide composition of AGAF was arabinose, galactose, glucose, and mannose with a ratio of 22.4:56.5:15.4:5.4 (Yang, et al., 2012).
2.2. Animals
Eight-week-old female ICR mice were purchased from BioLASCO Co., Ltd.
(Yi-89 90 91 92 93 94 95 96 97 98 99 100 101 102 103 104 105 106 107 108 109 110 111 112 113
Lan, Taiwan). The experimental animals received humane care, and the study protocols complied with the institutional guidelines of China Medical University for the use of laboratory animals. The animals were housed in an air-conditioned room (21–24 °C) under 12 h of light (8:00 a.m. – 8:00 p.m.), and were allowed free access to food pellets and water throughout the study.
2.3. Anti-osteoporosis effects of AGAF on OVX mice.
The experiments were performed on 40 female ICR mice. Bilateral OVX operation was performed under pentobarbital anesthesia (50 mg/kg) on the mice according to the procedure described before (Idris, 2012). Briefly, the mice were laparotomized to excise both ovaries clearly. The mice in the sham-operated group received anesthesia and a laparotomy as OVX operation, and were then sutured without removing their ovaries (Idris, 2012). After 3 days of adaptation after the surgery, the OVX mice were randomly divided into four groups, and were orally administered H2O, AGAF (5, 15 mg/kg), or inulin (Alfa Aesar, Heysham, UK) for the positive control for 3 weeks. The sham-operated group was orally treated with H2O. Each group contained 8 mice. The body weight of each animal was measured once a week until the final day of administration.
2.4. Assessment of prebiotic effect of AGAF
On day 7 after AGAF treatment, fresh feces were collected for analysis for bifidobacteria. Fresh feces were homogenized with 0.1% peptone diluent, followed by serial decimal dilutions. The number of bifidobacteria was counted on Bifidobacteria iodoacetate medium-25 agar after incubation at 37 ℃ for 48 h under anaerobic conditions (95% N2, 3% CO2, and 2% H2) (Munoa & Pares, 1988). After incubation, a 114 115 116 117 118 119 120 121 122 123 124 125 126 127 128 129 130 131 132 133 134 135 136 137 138
single colony was counted, and the results were expressed as the log values of the CFUs per gram of wet weight of feces.
2.5. Ca concentrations andSCFA
After the mice were sacrificed, the ceca were removed and weighed immediately. The cecal contents were collected. The cecal walls were then flushed with 0.9% saline, blotted dry with filter paper, and weighed, and were then stored at -80 ℃ for reverse transcription-polymerase chain reaction (RT-PCR) analysis. The cecal contents were stored at -80 ℃ until SCFA determination using HPLC analysis (Niven, et al., 2004). For SCFA analysis, the cecal content samples were defrosted on ice, and were diluted with 0.0085N sulfuric acid. The cecum samples were shaken and centrifuged at 12000 × g for 20 min. The supernatant was diluted to proper concentrations for HPLC analysis. The SCFAs were analyzed by a Transgenomic ICSep Transgenomic (300 × 7.8 mm, Omaha, NE, USA) at 65 °C, and eluted with 0.0085N sulfuric acid at a flow rate of 0.4 mL min-1. The peaks were detected by a Shodex RI-71 detector (Showa Denko, Tokyo, Japan).
2.6. Bone Ca content
Soft tissues were removed from the lumbar vertebra, and were immersed in a mixed solvent (chloroform: methanol = 2:1, Showa, Tokyo, Japan) to remove bone lipids subcutaneously (Honda, 2001). De-fatty lumbar vertebrae were incinerated at 1000 °C for 12 h for ashing. Bone ash was weighed and solved in 6N HCl (Wako, Osaka, Japan) for determination of Ca with the o-cresolphthalein complexone method with commercial kits (Randox, Crumlin, UK). Values were expressed as milligrams of Ca of bone dry weight.
139 140 141 142 143 144 145 146 147 148 149 150 151 152 153 154 155 156 157 158 159 160 161 162 163
2.7. Microcomputed tomography (microCT) analyses
The right femurs of the mice were preserved in 75% alcohol until scanning. The bone microarchitecture of the distal right femoral metaphysis was measured using a microtomography scanner (SkyScan 1076, Kontizh, Belgium), with an isotropic resolution of 17 m in all 3 spatial dimensions. To analyze the interest volume of trabecular, 100 slices were selected from the edge of distant direction to the proximal direction. The region of interest volume was analyzed without the cortical bone. The bone and tissue volumes were measured directly from the original 3-dimensional images, and the trabecular volume fraction (bone volume/tissue volume, %) was normalized to compare samples of different sizes. The other examined parameters of the trabecular structure were trabecular thickness, trabecular number, and trabecular separation, which were calculated directly from the 3-dimensional images.
2.8. RT-PCR analysis
Total RNA was extracted with Trizol (Invitrogen, CA, USA) from the tibia and cecal walls, followed by acid guanidinium thiocyanate-phenol-chloroform extraction, as described by Chomczynski and Sacchi (1987). A 3 g sample of
total RNA was subjected to reverse transcription with moloney murine leukemia virus reverse transcriptase in a 50 L reaction volume. The cDNA was amplified
by PCR. The primers used for cecal wall RNA extract were CaBP and glyceraldehyde-3-phosphate dehydrogenase (GAPDH) as internal standard and
were 5’- CAGAACCGAAGACTAGCGCA-3’ and
GCACAAAACAAAGTGGGTGC -3’(product size, 283 bp),and 5’-TGTGTCCGTCGTGGATCTGA-3’ and 5’-CCTGCTTCACCACCTTCTTGA-3’(product size, 76 bp), respectively. The primers for mice tibia RNA extract
164 165 166 167 168 169 170 171 172 173 174 175 176 177 178 179 180 181 182 183 184 185 186 187 188
were TRAP, CCAATGCCAAAGAGATCGCC -3’ and TCTGTGCAGAGACGTTGCCAAG-3’(product size, 216 bp), Cathepsin K , 5’-CTGCCCATAACCTGGAGG-3’ and 5’- GCCCTGGTTCTTGACTGG-3’(product size, 230 bp), OCN, AGACCGCCTACAAACGCATC-‘3’ and ACAGGGAGGATCAAGTCCCG -3’(product size, 113 bp), Runx2,
5’-CCGAGAAGTGGTTCCCGGTCCTG-3’ and
5’-CGACAGATCTGGAGCCTGCGGA-3’(product size, 173 bp), and GAPDH as internal standard. . Electrophoresis was performed on 2% agarose gels in a 0.5X TBE buffer (Amersco, OH, USA) for PCR products, and each lane was loaded with a fixed volume of the sample. PCR products were visualized using ethidium bromide staining.
2.9. Plasma bone markers
At the end of the experiment, the mice were sacrified, and their blood was drawn with heparin. The plasma was separated from the blood samples by centrifugation at 2000 × g for 10 min. The plasma was stored at -30 °C until assay. The plasma osteocalcin (OCN) were measured by commercial enzyme-linked immunosorbent assay (ELISA) kits (Biomedical Technologies Inc., Stoughton, MA, USA), and the plasma carboxy-terminal collagen cross-links (CTx) were analyzed using ELISA kits (Immunegiagnostic Systems, AZ, USA).
2.10. Effects of AGAF on OVX mice with streptomycin supplement
40 female ICR mice were treated with sham operations or OVX, and OVX mice were allocated into groups that were H2O, AGAF (15 mg/kg po. daily) with or without streptomycin sulfate (SM; Sigma Aldrich, MO, USA) treatment for 3 weeks. Each 189 190 191 192 193 194 195 196 197 198 199 200 201 202 203 204 205 206 207 208 209 210 211 212 213
group contained eight mice. SM was dissolved in the drinking water at a concentration of 2 mg/mL (Asahara, 2001). The sham-operated group was orally administrated H2O. The body weight of each mouse was recorded every week until the end of the experiment. The mice were assessed for prebiotic activity in vivo. At the end of the experiment, mice femurs were removed for microCT analyses.
2.11. In vitro assay of alkaline phosphatase activity on murine osteoblast MC3T3-E1 cells
The cells of murine osteoblast MC3T3-E1 were grown in Dulbecco’s modified Eagle’s medium (DMEM, Hyclone, UT, USA) supplemented with 10% (v/v) FBS (Hyclone, USA), 100 U/mL penicillin, and 100 mg/mL streptomycin. Incubation was conducted in a CO2 incubator (5% CO2, 95% air) at 37 °C. The cells were subcultured every 2 or 3 days by 0.25% (w/v) trypsin plus a 0.02% (w/v) ethylenediaminetetraacetic acid tetrasodium salt solution (Gibco, NY, USA).
For the alkaline phosphatase (ALP) activity assay, the MC3T3-E1 cells were seeded in 48-well plates (104 cells/well) containing DMEM in addition to 10% FBS (Iwami & Moriyama, 1993). After the cells attached to the bottom of the wells, the culture medium was changed to DMEM + 10% FBS medium containing 10 mM disodium β-glycerophosphate (Sigma Aldrich), 0.15 mM ascorbic acid (Sigma Aldrich), and 10-8 M dexamethasone (Sigma Aldrich) (Isama & Tsuchiya, 2003).
Simultaneously, different concentrations of sodium butyrate or AGAF were added to the culture medium in the well. On day 6 after cultivation, the cells were washed twice withphosphate buffered saline and harvested in a 200 μL/well of a lysis buffer (pH 8.2, 10 mM Tris-HCl, 2 mM MgCl2, and 0.05% Triton X-100). Cells were lysed through an ultrasonic processor (Vibra-Cell, Sonics & Materials, CT, USA) with 30 J 214 215 216 217 218 219 220 221 222 223 224 225 226 227 228 229 230 231 232 233 234 235 236 237 238
in energy. Aliquots were reserved for protein analysis. A total of 300 μL of 8 mM p-nitrophenyl phosphate (Sigma Aldrich) in a 0.1 M sodium carbonate buffer (pH 10) containing 1 mM MgCl2 were added to the reaction mixture, which was incubated at 37 °C for 30 min. The reaction was stopped by adding 50 μL of 1.0 N NaOH/well.26 The yellow sample solutions containing p-nitrophenol for the reaction product were measured at 405 nm using a microplate reader. A standard curve was prepared using p-nitrophenol phosphate. The total protein contents of cell lysates was measured by a Bradford reagent (Sigma Aldrich) using albumin for the standard (Bradford, 1976).
2.12. In vitro Osteoclasts differentiation from murine macrophage RAW264.7 cell line RAW264.7 cells were maintained in an α-modified Eagle’s medium (Hyclone), supplemented with 10% FBS (Gibco, CA, USA), 100 U/mL penicillin, and 100 mg/mL streptomycin and L-glutamine (Biological industry, Kibbutz Beit-Haemek, Israel). Cells were cultured at a density of 2 × 10³ cells/mL in a 24-well plate in the presence of a receptor activator of nuclear factor kappa B ligand (RANKL) for 5 days (Rahman, et al., 2003). RAW264.7 cells were incubated with different concentrations of sodium butyrate or AGAF to examine their effects on osteoclast differentiation. On day 5, cells were treated with 4% formaldehyde solution for 10 min, and then stained to obtain the tartrate-resistant acid phosphatase (TRAP) of the osteoclasts. TRAP staining was applied to measure the presence of osteoclasts, and stained with a standard kit (387A-1 kit, Sigma-Aldrich). The TRAP-positive multinucleated osteoclasts (least 3 nuclei) were counted (Parfitt, et al. 1987).
2.13. Statistical analysis
The results were expressed as mean SD. All experimental data were analyzed using 239 240 241 242 243 244 245 246 247 248 249 250 251 252 253 254 255 256 257 258 259 260 261 262 263
one-way analysis of variance (ANOVA) with the Duncan multiple-range test. Values of p < 0.05 were considered statistically significant.
3. Results
3.1. Assessment of prebiotic effect of AGAF
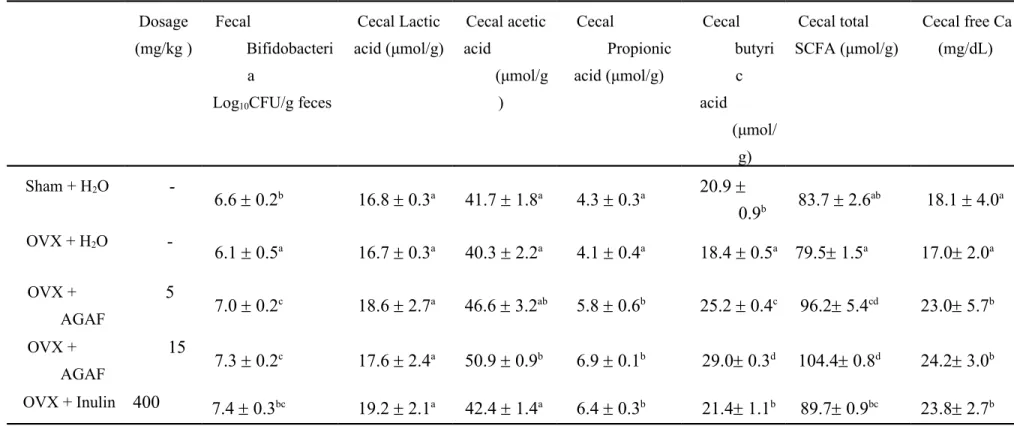
The number of fecal bifidobacteria was different between the sham and OVX-H2O group. The OVX treatment caused a 9.1% decrease in the number of
bifidobacteria for the OVX mice than in the sham group. Administration of AGAF for 7 days led to a 20.7% (5 mg/kg) and 21.2% (15 mg/kg) increase in bifidobacteria in the stool compared to the OVX-H2O group (Table 1). In
addition, inulin treatment also led to a 15.2% increase in the number of fecal bifidobacteria over the OVX-H2O group.
3.2. Cecal Ca concentrations and SCFA
The cecal Ca concentrations in the OVX-H2O group and sham group were equal.
For the level of cecal Ca concentration, the AGAF administrated groups had 35.1% (5 mg/kg) and 42.7% (15 mg/kg) greater levels than the OVX-H2O group;
administrated with inulin were 39.8% greater than OVX-H2O group
significantly (Table 1).
The results of SCFA analyses are shown in Table 1. Concentrations of butyric acid in the sham group and OVX-H2O group have significant differences.
The OVX-H2O group had a decrease in the level of butyric acid of 12.1%
compared to the sham group. In addition, no differences in lactic acid, acetic acid, and propionic acid were observed between the sham group and the
OVX-264 265 266 267 268 269 270 271 272 273 274 275 276 277 278 279 280 281 282 283 284 285 286 287 288
H2O group. The analysis showed significantly higher concentrations of acetic
acid, propionic acid, and butyric acid in the OVX-AGAF group (15 mg/kg) compared to the OVX-H2O group (26.3%, 66.0%, and 57.7% increases,
respectively). The OVX-inulin group showed increases in propionic acid and butyric acid of 53.6% and 16.4% compared to the OVX-H2O group. In this study, total SCFA is the amount of lactic acid, acetic acid, propionic acid, and butyric acid; no differences were observed between the sham and OVX-H2O groups. Moreover, the OVX mice administered AGAF led to a 21.0% (5 mg/kg) and 31.25% (15mg/kg) increase; inulin led to a significant 12.8% increase in the total SCFAs in the ceca of the OVX mice, compared to the OVX-H2O group.
3.3. Bone Ca content
The amount of Ca in the lumbar vertebrae was determined using o-cresophthalein complexone. The total Ca content and Ca ratio of lumbar vertebrae was calculated. The results were showed that OVX treatment reduced the Ca content by 11.4% (14.0 ± 1.3 mg) and the Ca ratio by 16.9% (12.3 ± 0.6%) in the lumbar vertebrae compared to sham group (15.8 ± 1.0 mg in Ca content; 14.8 ± 0.8% in Ca ratio). The results of AGAF treatment (5 mg/kg) were 13.3 ± 0.9 mg in Ca content and 13.1 ± 0.1% in the Ca ratio, and shown no significant difference compared to OVX-H2O group. Administration of AGAF (15 mg/kg)
caused a significant 13.6% increase in the Ca content (15.9 ± 0.4 mg), and a 14.6% increase in the Ca ratio (14.1± 0.1%); however, administration of inulin increased the Ca ratio (13.8 ± 0.5%) only, compared to the OVX-H2O group.
Bone Ca content of inulin treatment group was 14.9 ± 1.9 mg and displayed a minor increase to OVX-H2O group.
289 290 291 292 293 294 295 296 297 298 299 300 301 302 303 304 305 306 307 308 309 310 311 312 313
3.4. MicroCT analyses
The OVX procedure caused significant decreases in the trabecular bone volume ratio (12.6%), trabecular number (11.1%), and trabecular thickness (30.6%) in the OVX group compared to the sham group (Figs. 1B, 1C). Although the trabecular separation was 107.0% in the OVX-H2O group compared to the sham
group, the data showed no significant difference (Fig. 1C). These results show that OVX induced a loss of trabecular bone in the femurs of the mice (Fig. 1A). Treatment of AGAF (15 mg/kg) and inulin led to a significant 10.9% and 3.5% increase in the loss in trabecular bone volume, respectively. OVX mice administered AGAF had a 24.5% (5 mg/kg) and 30.0% (15 mg/kg) increase in trabecular thickness, respectively. Treatment with inulin caused an increase of 12.2% in trabecular thickness. The trabecular number and separation was unaffected in the AGAF or inulin groups.
3.5. RT-PCR analysis
The expression of Ca-binding protein (CaBP) in cecal mucosal cells is shown in Fig. 2. The gene expression of CaBP was significantly decreased in the OVX-H2O
group compared to the sham-H2O group (31.6% decrease). The expression of
CaBP were 1.6- and 2.0-fold increased by the administration of AGAF (5, 15 mg/kg), and rose 1.8-fold in the inulin group compared to the OVX-H2O group.
Figure 2B showed that all data were presented as relative expressions compared to GAPDH, which was used as the internal control. For mRNA expression of the tibia, the relative expression of osteoclast-related genes involving TRAP, cathepsin K, and osteoblast-associated genes, including OCN,
314 315 316 317 318 319 320 321 322 323 324 325 326 327 328 329 330 331 332 333 334 335 336 337 338
was significantly upregulated by the OVX operation compared to in the sham operation. The expression of TRAP, cathepsin K, and OCN were 4.4-fold, 3.0-fold, and 1.8-fold higher than in the sham group, respectively (Fig. 2). Administration of AGAF (5, 15 mg/kg) and inulin could significantly inhibit the expression of TRAP and cathepsin K compared to the OVX-H2O group. Both
AGAF and inulin treatments could prevent the increased expression of OCN. The expression of OCN in the AGAF administrated groups were 83.1% (5 mg/kg) and 67.6% (15 mg/kg), and 70.4% in the inulin administrated group compared to the OVX-H2O group. There was no significant difference in the
expression of Runx2 between the OVX-H2O and sham groups (Fig. 2). However, only AGAF treatment (15 mg/kg) could significantly suppress the expression of Runx2 (72.1%) compared to the OVX-H2O group.
3.6. Plasma bone markers
The results of the plasma CTx assay are shown in Fig. 3A. The concentration of CTx was significantly increased in the OVX-H2O group over the sham group. Treatments of AGAF (15 mg/kg) and inulin in the OVX mice caused decreases of 31.0% and 25.3% of the plasma CTx level, respectively. In the OCN assay, the OCN concentration in the OVX-H2O group was 25% higher than in the sham group (Fig. 2B). The AGAF treatment (15 mg/kg) significantly lowered the level of OCN by 9.3% compared to the OVX-H2O group.
3.7. Effects of AGAF on OVX mice with streptomycin supplement
The assay for prebiotic effects was determinate by fecal number of bifidobacteria on day 7 and day 21 during the experimental period. After 7 days treatment, the
339 340 341 342 343 344 345 346 347 348 349 350 351 352 353 354 355 356 357 358 359 360 361 362 363
number of bifidobacteria (log10CFU/g) showed no difference in sham and
OVX-H2O group and was 6.7 ± 0.7 and 6.2 ± 0.1, respectively. The mice administrated
AGAF (15 mg/kg) has 24.0% increase in the number of bifidobacteria (7.6 ± 0.3 log10CFU/g) compared to OVX-H2O group significantly. However, continuous
treatment of mice with SM in the drinking water (2 mg/mL) for 7 days resulted in the fecal bifidobacteria decreasing to an undetectable level. The fecal bifidobacteria counts in OVX-H2O-SM and OVX-AGAF-SM group was < 2.0
and 4.1 ± 2.5 log10CFU/g, respectively.
The results of prebiotic assay on day 21 were similar to the results of day 7. The bifidobacteria count of sham, OVX-H2O, OVX-AGAF groups was 6.7 ± 0.1,
6.3 ± 0.2 and 7.8 ± 0.4 log10CFU/g feces, respectively. The administration of
AGAF promoted the number of bifidobacteria in 24.1% increase than OVX-H2O
significantly. In additional, SM also blocked the prebiotic effects of AGAF on day 21. The results of fecal bifidobacteria in OVX-H2O-SM and OVX-AGAF-SM
group were showed as undetectable and 3.7 ± 1.6 log10CFU/g, respectively.
Though the bifidobacteria number of OVX-AGAF-SM group on day 21 was minor than on day 7, but the data was not significant difference.
The levels of plasma bone markers, including CTx and OCN, were shown in Fig. 3B. CTx and OCN in the OVX-H2O group increased 2.5-fold and 1.25-fold compared to the sham group, respectively. No differences were noted between the OVX-H2O group and the OVX-H2O+SM group. Administration of AGAF (15 mg/kg) could prevent the increase of CTx and OCN. However, AGAF administration combined with SM did not affect the levels of CTx or OCN.
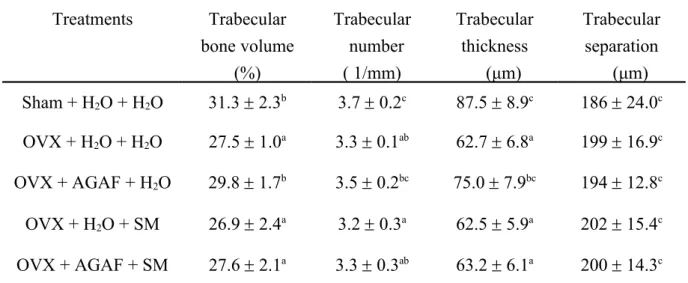
Mice femurs were assessed for microCT. The OVX operation caused significant reductions in trabecular bone volume, trabecular number, and the trabecular thickness
364 365 366 367 368 369 370 371 372 373 374 375 376 377 378 379 380 381 382 383 384 385 386 387 388
of the femur compared to the sham group. Trabecular separation showed no difference among the groups. Adding SM to the drinking water of the OVX mice did not affect the trabecular parameters, compared to the OVX-H2O group without SM. The results showed that administration of AGAF (15 mg/kg) could improve the trabecular bone volume and trabecular thickness of the femur in OVX mice. Treatment of AGAF with SM caused no difference in trabecular bone volume, trabecular number, trabecular thickness, or trabecular separation, compared to the OVX-H2O group (Table 2).
3.8. In vitro assay of ALP activity on murine osteoblast MC3T3-E1 cells
The ALP activity assay was used to evaluate the differentiation of MC3T3-E1. ALP is a representative enzyme that can indicate osteoblast differentiation (Isama & Tsuchiya, 2003). Butyric acid is the most changeable SCFA in the cecum in the in vivo prebiotic experiment. In the presence of different concentrations of butyric acid, MC3T3-E1 cells produced increasing ALP activity at concentrations from 0.5 mM to 1.0 mM sodium butyrate after 6 days of treatment (Fig. 4A). No obvious differences were observed in the sodium butyrate concentration of 0.1 mM and for all concentrations of AGAF (Fig. 4A). It appears that sodium butyrate can effectively enhance the ALP activity of MC3T3-E1, but AGAF cannot. The ALP activity results strongly suggest that osteoblastic differentiation could be efficiently stimulated in the presence of sodium butyrate.
3.9. In vitro osteoclasts differentiation from murine macrophage RAW264.7 cell line
The effects of sodium butyrate and AGAF on the osteoclast formation in the murine macrophage cell line RAW264.7 cells were examined. On day 5, the
389 390 391 392 393 394 395 396 397 398 399 400 401 402 403 404 405 406 407 408 409 410 411 412 413
number of TRAP-positive cells with more than 3 nuclei was counted (Fig. 4B & 4C). TRAP-positive cells with 3 or more nuclei are counted as osteoclasts after 5 days cultivation. For the TRAP-positive cells, the presence of sodium butyrate (0.1, 0.5, and 1 mM) in the culture medium caused a significant decrease. The presence of AGAF (100 and 150 μg/mL) in the culture medium could also show decreases in the number of TRAP-positive cells by 13.8% and 37.2%, respectively. The osteoclast inhibition was 37.5%, 67.6%, and 86.9% under the treatment of sodium butyrate at concentrations of 0.1, 0.5, and 1 mM, respectively. However, the suppression of osteoclast differentiation of AGAF was not as remarkable as that of sodium butyrate.
4. Discussion
In this study, we showed that AGAF could prevent osteoporosis through its prebiotic effects in OVX mice. Our results showed that AGAF could enhance the number of probiotics and increase cecal SCFA and bone mass density in OVX mice. We observed that the anti-osteoporosis effects of AGAF could be inhibited by SM, a broad-spectrum antibiotic. The results suggested that the prevention effects of AGAF on osteoporosis might cause by its prebiotic effects. Numerous prebiotic isolated from botanic and found as polysaccharides, like inulin, larch wood arabinogalactan, kiwifruit pectin, konjac glucomannan and resistant dextrin (Roberfroid, 2005; Degnan & Macfarlane, 1995; Parkar, et al., 2010; Connolly, et al., 2010; Barczynska, et al., 2012). Those prebiotic carbohydrates are regarded to be hydrolyzed and utilized by probiotics only (Tomasik & Tomasik, 2003). AGAF is a type II arabinogalactan and has been reported as a potent prebiotic polysaccharide in our previous study (Yang, et al., 2012). The previous study reported that AGAF promote the number of bifidobacteria of feces
414 415 416 417 418 419 420 421 422 423 424 425 426 427 428 429 430 431 432 433 434 435 436 437 438
especially and the prebiotic mechanism of AGAF may due to up-regulate the expression of ATP binding cassette transporter, a part of nutrient uptake system.
OVX mice mimicked middle-aged postmenopausal women. In this study, no differences were observed in the fecal number of bifidobacteria between OVX-H2O mice and the sham group (Chen, et al.,2009). The results of fecal bifidobacteria were similar to those of our previous study (Chen, et al.,2009). However, AGAF could increase the number of fecal bifidobacteria in OVX mice. A prebiotic is a selectively fermented ingredient that allows specific changes, both in composition and/or activity in gastrointestinal micoflora. Thus, AGAF possesses prebiotic characteristics, as previous reported (Yang, et al. 2012).
SCFA are the products of prebiotic fermentation, and have been shown to enhance bone health (Scholz-Ahrens, et al. 2007). Butyric acid, an SCFA and a histone deacetylase inhibitor, can influence osteoblasts and osteoclasts and provide protection from bone density loss (Rahman, et al., 2003; Iwami & Moriyama, 1993). In addition, high concentrations of SCFA in the cecum lead to increases in the concentration of soluble Ca (Lopez, et al., 2000). In our study, AGAF treatment increased the cecal SCFA, especially butyric acid, and increased the cecal soluble-Ca concentration. Cholecalciferol-induced CaBP is a key factor in the intestinal transcellular Ca transport system (Bouillon, et al., 2003). A direct correlation exists between the mucosal amounts of CaBP and the efficiency of Ca absorption (Bronner, 2003). Hence, an increase in mucosal CaBP indicates an increase in Ca absorption in this intestinal segment. A previous study reported that the high level of soluble Ca in the cecum induces the expression of CaBP (Yang, et al., in press). In our study, the soluble Ca level was higher in the cecum after AGAF treatment. Moreover, the expression cecal CaBP was enhanced by AGAF administration in OVX mice. These 439 440 441 442 443 444 445 446 447 448 449 450 451 452 453 454 455 456 457 458 459 460 461 462 463
results showed that AGAF could promote intestinal Ca absorption in OVX mice through prebiotic fermentation.
Other studies have also shown that increasing Ca absorption affects bone characteristics, such as bone Ca content and bone strength, in OVX rats (Mitamura, et al. 2004). In our study, an enhancement of Ca absorption caused by administration of AGAF may also cause an increase in the Ca content in the lumbar vertebrae of OVX mice.
In microCT analysis, trabecular bone volume, trabecular number, trabecular thickness, and trabecular separation of the distal femur were analyzed. AGAF could cause increases in femur trabecular bone volume and trabecular thickness compared to OVX-H2O mice. Trabecular bone volume and trabecular thickness are important factors in bone strength (Yao, et al., 2005). These results implied that AGAF could decrease bone loss and bone structural fractures induced by OVX operation.
In plasma bone markers, CTx is part of the composition of bone. Plasma CTx levels are markedly increased in postmenopausal women with osteoporosis, and their values decrease markedly and rapidly with anti-resorption therapy (Qvist, et al., 2002). Although the concentration of OCN is a sensitive marker of bone formation, the plasma concentration of OCN is a feedback control mechanism during active bone resorption (Swaminathan, 2001). Because a high turnover may lead to bone loss, a downregulation of bone turnover may be beneficial to bone metabolism. Treatment by AGAF and inulin could reduce the plasma levels of both CTx and OCN, which were induced by OVX operations.
In RT-PCR analysis, the expression of osteoclast-associated genes, TRAP, and cathepsin K was induced by OVX. TRAP is a di-iron-containing metalloenzyme that is expressed in osteoclasts and in subsets of tissue macrophages and dendritic cells 464 465 466 467 468 469 470 471 472 473 474 475 476 477 478 479 480 481 482 483 484 485 486 487 488
(Walsh, et al., 2003). TRAP expression is dramatically upregulated during osteoclast differentiation. Therefore, TRAP activity is commonly used as an identifying marker in osteoclasts (Walsh, et al., 2003). Cathepsin K, a lysosomal cysteine proteinase, is expressed predominantly in osteoclasts. Cathepsin K cleaves key bone matrix proteins, and is believed to have an important role in degrading the organic phase of bone during bone resorption (Saftig, et al. 2000). In this experiment, the expression of TRAP and cathepsin K was increased in OVX mice. The administration of AGAF in OVX mice could suppress the induction of expression of TRAP and cathepsin K. The results showed that AGAF could down-regulate osteoclast differentiation and bone resorption in OVX mice.
Runx2 is an essential factor in osteoblast differentiation. Runx2 triggers the expression of major bone matrix genes during the early stages of osteoblast differentiation, but Runx2 is not essential for the maintenance of these gene expressions in mature osteoblasts (Komori, 2010). Moreover, Runx2 inhibits osteoblast maturation and mature bone formation at the late stage of osteoblast differentiation (Komori, 2010).
In this study, no rebound increase of Runx2 was shown in the tibia of the OVX mice compared to the sham mice. The results suggested that the OVX mice might have been in the mid-to-late stage of the bone resorption process. A previous study indicated that a supplement of dried plum could prevent OVX-induced bone loss (Rendina, et al.,2012). In addition, the study also reported that the expression of Runx2 decreased significantly in the presence of dried plums in OVX mice. The results of our study showed that the expression of Runx2 was similar to those of Rendina et al. (2012). This implies that AGAF might promote the transition of osteoblasts into osteocytes in late stages of OVX-induced osteoporosis.
489 490 491 492 493 494 495 496 497 498 499 500 501 502 503 504 505 506 507 508 509 510 511 512 513
OCN is a major noncollagenous protein component of the bone extracellular matrix, and is synthesized and secreted exclusively by osteoblasts in the late stage of maturation; it is considered an indicator of osteoblast differentiation (Sila-Asna, et al., 2007). OCN is also a sensitive bone turnover marker. The expression of OCN showed a rebounded increase in OVX mice caused by the over expression of osteoclasts in this study. Treatment of AGAF significantly inhibited the increased expression of OCN, which indicated that AGAF could suppress the bone turnover marker through the inhibition of osteoclasts. The results of OCN expression were identical to those of plasma OCN concentrations. These results show that bone protection by AGAF might prevent bone resorption by osteoclasts in OVX mice.
We evaluated the effects of AGAF in the treatment of postmenopausal osteoporosis using OVX mice. To test the hypothesis that the anti-osteoporosis effects of AGAF were caused by its prebiotics, we supplemented drinking water with SM to investigate the effects on OVX mice. SM in drinking water could significantly eliminate not only the prebiotic effects of AGAF but also the anti-osteoporosis effects in plasma bone markers in OVX mice. The preventative bone loss of AGAF was inhibited by SM. The results showed that the anti-osteoporosis properties of AGAF were derived mainly from its prebiotic effects. Certain studies have reported that inulin, a well-known prebiotic fructan, could promote intestinal mineral absorption and bone health (Scholz-Ahrens, et al. 2007; Kruger, et al. 2003).
An in vivo study showed that AGAF is an anti-osteoporosis component through its prebiotic fermentation products. The results of the in vitro study showed that AGAF could not influence the activity of ALP on osteoblast cell line MC3T3-E1, but butyric acid could increase the activity of ALP significantly. Similar results were observed in murine osteoclast differentiation. These results suggested that the 514 515 516 517 518 519 520 521 522 523 524 525 526 527 528 529 530 531 532 533 534 535 536 537 538
mechanism of anti-osteoporosis effects was caused by its prebiotic fermentation. We investigated why AGAF or its fermentation products, such as SCFA, act as anti-osteoporosis materials. The concentration of butyric acid was considerably affected by AGAF administration. Sodium butyrate was used to examine the anti-osteoporosis effects of SCFA. In an osteoblast differentiation study, AGAF did not affect ALP production. ALP is crucial to the mineralization of osteoblasts (Zhao, et al., 2007). Sodium butyrate, but not AGAF, could improve the mineralization activities of osteoblasts. In osteoclast cell line differentiation, we observed that AGAF and sodium butyrate could both influence the formation of osteoclasts. However, AGAF activity in resisting osteoclast formation was considerably weaker than that of sodium butyrate. These in vitro studies showed that sodium butyrate was a major compound in anti-osteoporosis functions. In addition, certain studies have also shown that histone deacetylase inhibitors, such as butyrate, accelerated in vitro osteoblast maturation (Katono, et al., 2008; Schroeder & Westendrof, 2005). Therefore, it is possible that AGAF partially ameliorates osteoporosis in OVX mice by enhancing osteoblast maturation and inhibiting osteoclast differentiation through butyrate production.
5. Conclusions
The results clearly showed that administration of AGAF inhibited bone turnover, elevated intestinal Ca absorption, and prevented Ca loss and deterioration in bone volume in OVX mice. Our study provides evidence that prebiotic activity was involved in the anti-osteoporotic mechanisms of AGAF. In addition, the prebiotic potency and bone protection activities of AGAF were higher than those of inulin, based on the dosage. Daniel et al. demonstrate that the half-life of butyrate in mice 539 540 541 542 543 544 545 546 547 548 549 550 551 552 553 554 555 556 557 558 559 560 561 562 563
and rabbits is less than 5 min (Daniel, et al., 1989). This indicates that the rapid elimination of butyrate is a limiting factor in practical applications (Daniel, et al., 1989). Our results showed that the prebiotic fermentation effects of AGAF might prolong the absorption period of butyrate in OVX mice. The results showed that AGAF could be a new source of food supplements in the promotion of bone health for postmenopausal osteoporosis.
Acknowledgment.
This study was supported by grants from the National Science Council of the Republic of China (NSC 101-2320-B-039-019)
REFERENCES
Asahara, T., Nomoto, K., Shimizu, K., Watanuki, M., & Tanaka, R. (2001). Increased resistance of mice to Salmonella enterica serovar Typhimurium infection by synbiotic administration of Bifidobacteria and transgalactosylated oligosaccharides. Journal of Applied Microbiology, 91, 985-996.
Barczynska, R., Slizewska, K., Jochym, K., Kapusniak, J., & Libudzisz, Z. (2012). The tartaric acid-modified enzyme-resistant dextrin from potato starch as potential prebiotic. Journal of Functional Foods, 4, 954-962.
Bouillon, R., Van Cromphaut, S., & Carmeliet, G. (2003). Intestinal calcium absorption: Molecular vitamin D mediated mechanisms. Journal Cellular Biochemistry, 88, 332-329.
Bradford, M. M. (1976). A rapid and sensitive method for the quantitation of microgram quantities of protein utilizing the principle of protein-dye binding. Analytical Biochemistry, 72, 248-254.
Bronner, F. (2003). Mechanisms of intestinal calcium absorption. Journal Cellular l Biochemistry, 88, 387-393.
Chen, H. L., Hong, L. T., Lee, J. K., & Huang, C. J. (2009). The bone-protective effect of a Taiwanese yam (Dioscorea alata L. cv. Tainung No.2) in ovariectomised female BALB/C mice. Journal of the Science of Food and Agriculture , 89, 517-522. 564 565 566 567 568 569 570 571 572 573 574 575 576 577 578 579 580 581 582 583 584 585 586 587 588 589 590 591 592 593 594
Chen, Y. M., Ho, S. C., & Woo, J. L. (2006). Greater fruit and vegetable intake is associated with increased bone mass among postmenopausal Chinese women. British Journal of Nutrition, 96, 745-751.
Chang, D. C. N., Chou, L. C., & Lee, G. C. (2007). New cultivation methods for Anoectochilus formosanus Hayata. Orchid Science and Biotechnology, 2, 56-60.
Chomczynski, P., & Sacchi, N. (1987). Single-step method of RNA isolation by acid guanidinium thiocyanate-phenol-chloroform extraction. Analytical
Biochemistry, 162, 156-159.
Connolly, M. L., Lovegrove, J. A., & Tuohy, K. M. (2010). Konjac glucomannan hydrolysate beneficially modulates bacterial composition and activity within the faecal microbiota. Journal of Functional Foods, 2, 219-224.
Coxam, V. (2007). Current data with inulin-type fructans and calcium, targeting bone health in adults. The Journal of Nutrition, 137, (Suppl. 11), S2527-S2533.
Daniel, P., Brazier, M., Cerutti, I., Pieri, F., Tardivel, I., Desmet, G., Baillet, J., & Chany, C. (1989). Pharmacokinetic study of butyric acid administered in vivo as sodium and arginine butyrate salts. Clinica Chimica Acta, 181, 255-263.
Datta, N. S. (2011). Osteoporotic fracture and parathyroid hormone. World Journal of Orthopedics, 2, 67-74.
de Villiers, T. J., & Stevenson, J. C. (2012). The WHI: the effect of hormone replacement therapy on fracture prevention. Climacteric, 15, 263-266.
Degnan, B. A., & Macfarlane, G. T. (1995). Arabinogalactan utilization in continuous cultures of Bifidobacterium longum: effect of co-culture with Bacteroides thetaiotaomicron. Anaerobe, 1, 103-112.
Devareddy, L., Hooshmand, S., Collins, J. K., Lucas, E. A., Chai, S. C., & Arjmandi, B. H. (2008). Blueberry prevents bone loss in ovariectomized rat model of postmenopausal osteoporosis. The Journal of Nutritional Biochemistry, 19, 694-699.
Du, X. M., Irino, N., Furusho, N., Hayashi, J., & Shoyama, Y. (2008). Pharmacologically active compounds in the Anoectochilus and Goodyera species. Journal of Natural Medicines, 62, 132-148.
Honda, A., Umemura, Y., & Nagasawa, S. (2001). Effect of high-impact and low-repetition training on bones in ovariectomized rats. Journal of Bone and Mineral Research, 16, 1688-1693.
Idris, A. I. (2012). Ovariectomy/orchidectomy in rodents. Methods in Moleculae
Biology, 816, 545-551.
Isama, K., & Tsuchiya, T. (2003). Enhancing effect of poly(L-lactide) on the differentiation of mouse osteoblast-like MC3T3-E1 cells. Biomaterials, 24, 3303-595 596 597 598 599 600 601 602 603 604 605 606 607 608 609 610 611 612 613 614 615 616 617 618 619 620 621 622 623 624 625 626 627 628 629 630 631 632
3309.
Iwami, K., & Moriyama, T. (1993). Effects of short chain fatty acid, sodium butyrate, on osteoblastic cells and osteoclastic cells. The International Journal of Biochemistry, 25, 1631-1635.
Katono, T., Kawato, T., Tanabe, N., Suzuki, N., Iida, T., Morozumi, A., Ochiai, K., & Maeno, M. (2008). Sodium butyrate stimulates mineralized nodule formation and osteoprotegerin expression by human osteoblasts. Archives of Oral Biology, 53, 903-909.
Khosla, S., Bilezikian, J. P., Dempster, D. W., Lewiecki, E. M., Miller, P. D., Neer, R. M., Recker, R. R., Shane, E., Shoback, D., & Potts, J. T. (2012). Benefits and Risks of Bisphosphonate Therapy for Osteoporosis. The Journal of Clinical Endocrinology and Metabolism, 97, 2272-2282.
Komori, T. (2010). Regulation of osteoblast differentiation by Runx2. Advances in Experimental Medicine and Bology, 658, 43-49.
Kruger, M. C., Brown, K. E., Collett, G., Layton, L., & Schollum, L. M. (2003). The effect of fructooligosaccharides with various degrees of polymerization on calcium bioavailability in the growing rat. Experimental Biology and Medicine, 228, 683-688.
Lopez, H. W., Coudray, C., Levrat-Verny, M. A., Feillet-Coudray, C., Demigne, C., & Remesy, C. (2000). Fructooligosaccharides enhance mineral apparent absorption and counteract the deleterious effects of phytic acid on mineral homeostasis in rats. Journal of Nutritional Biochemistry, 11, 500-508.
Masuda, K., Ikeuchi, M., Koyama, T., Yamaguchi, K., Woo, J. T., Nishimura, T., & Yazawa, K. (2008). Suppressive effects of Anoectochilus formosanus extract on osteoclast formation in vitro and bone resorption in vivo. Journal of Bone and Mineral Metabolism, 26, 123-129.
Mitamura, R., Hara, H., & Aoyama, Y. (2004). Ingestion of raffinose promotes calcium absorption in the large intestine of rats. Bioscience, Biotechnology, and
Biochemistry, 68, 384-389.
Munoa, F. J., & Pares, R. (1988). Selective medium for isolation and enumeration of Bifidobacterium spp. Applied and Environmental Microbiology, 54, 1715-1718. Niven, S. J., Beal, J. D., & Brooks, P. H. (2004). The simultaneous determination of
short chain fatty acid, monosaccharides and ethanol in fermented liquid pig diets. Animal Feed Science and Technology, 117, 339-345.
Parkar, S. G., Redgate, E. L., Wibison, R., Luo, X., Koh, E. T. H., & Schröder, R. (2010). Gut health benefits of kiwifruit pectins: Comparison with
commercial functional polysaccharides. Journal of Functional Foods, 2, 210-218. 633 634 635 636 637 638 639 640 641 642 643 644 645 646 647 648 649 650 651 652 653 654 655 656 657 658 659 660 661 662 663 664 665 666 667 668 669 670
Pietschmann, P., Rauner, M., Sipos, W., & Kerschan-Schindl, K. (2009). Osteoporosis: an age-related and gender-specific disease-a mini-review. Gerontology, 55, 3-12.
Rahman, M. M., Kukita, A., Kukita, T., Shobuike, T., Nakamura, T., & Kohashi, O. (2003). Two histone deacetylase inhibitors, trichostatin A and sodium butyrate, suppress differentiation into osteoclasts but not into macrophages. Blood, 101, 3451-3459.
Parfitt, A. M., Drezner, M. K., Glorieux, F. H., Kanis, J. A., Malluche, H., Meunier, P. J., Ott, S. M., & Recker, R. R. (1987). Bone histomorphometry: standardization of nomenclature, symbols, and units. Report of the ASBMR Histomorphometry Nomenclature Committee. Journal of Bone and Mineral Research, 2, 595-610. Rendina, E., Lim, Y. F., Marlow, D., Wang, Y., Clarke, S. L., Kuvibidila, S., Lucas,
E. A., & Smith, B. J. (2012) Dietary supplementation with dried plum prevents ovariectomy-induced bone loss while modulating the immune response in C57BL/6J mice. Journal of Nutritional Biochemistry, 23, 60-68.
Roberfroid, M. B. (2005). Introducing inulin-type fructans. British Journal of Nutrition, 93 (Suppl. 1), S13-25.
Qvist, P., Christgau, S., Pedersen, B. J., Schlemmer, A., & Christiansen, C. (2002). Circadian variation in the serum concentration of C-terminal telopeptide of type I collagen (Serum CTx): Effects of gender, age, menopausal status, posture, daylight, serum cortisol, and fasting. Bone, 31, 57-61.
Saftig, P., Hunziker, E., Everts, V., Jones, S., Boyde, A., Wehmeyer, O., Suter, A., & von Figura, K. (2000). Functions of cathepsin K in bone resorption. Lessons from cathepsin K deficient mice. Advances in Experimental Medicine and Bology, 477, 293-303.
Sila-Asna, M., Bunyaratvej, A., Maeda, S., Kitaguchi, H., & Bunyaratavej, N. (2007). Osteoblast differentiation and bone formation gene expression in strontium-inducing bone marrow mesenchymal stem cell. The Kobe Journal of Medical Sciences, 53, 25-35.
Scholz-Ahrens, K. E., Ade, P., Marten, B., Weber, P., Timm, W., Acil, Y., Gluer, C. C., & Schrezenmeir, J. (2007). Prebiotics, probiotics, and synbiotics affect mineral absorption, bone mineral content, and bone structure. Journal Of Nutrition, 137 ( Suppl 2), S838-846.
Schroeder T. M., & Westendorf, J. J. (2005). Histone deacetylase inhibitors promote osteoblast maturation. Journal of Bone and Mineral Research, 2254-2263.
Shih, C. C., Wu, Y. W., & Lin, W. C. (2001). Ameliorative effects of Anoectochilus formosanus extract on osteopenia in ovariectomized rats. Journal of Ethnopharmacology, 77, 233-238. 671 672 673 674 675 676 677 678 679 680 681 682 683 684 685 686 687 688 689 690 691 692 693 694 695 696 697 698 699 700 701 702 703 704 705 706 707 708
Stransky, M., & Rysava, L. (2009). Nutrition as Prevention and Treatment of Osteoporosis. Physiological research, 58 (Suppl.1), S7-S11.
Swaminathan, R. (2001). Biochemical markers of bone turnover. Clinica Chimica Acta, 313, 95-105.
Tomasik, P. J., & Tomasik, P. (2003). Probiotics and prebiotics. Cereal
Chemistry, 80, 113-117.
Walsh, N. C., Cahill, M., Carninci, P., Kawai, J., Okazaki, Y., Hayashizaki, Y., Hume, D. A., & Cassady, A. I. (2003). Multiple tissue-specific promoters control expression of the murine tartrate-resistant acid phosphatase gene. Gene, 307, 111-123.
Weaver, C. M. (2005). Inulin, oligofructose and bone health: experimental approaches and mechanisms. British Journal of Nutrition, 93 (Suppl. 1), S99-103.
Yang, L. C., Lin, W. C., & Lu, T. J. (2012). Characterization and Prebiotic Activity of Aqueous Extract and Indigestible Polysaccharide from Anoectochilus formosanus. Journal of Agricultural and Food Chemistry, 60, 8590-8599.
Yang, L. C., Wu, J. B., Lu, T. J., & Lin, W. C. (in press). The prebiotic effect of Anoectochilus formosanus and its consequences on bone health. British Journal Nutrition.
Yao, W., Hadi, T., Jiang, Y., Lotz, J., Wronski, T. J., & Lane, N.E. (2005). Basic fibroblast growth factor improves trabecular bone connectivity and bone strength in the lumbar vertebral body of osteopenic rats. Osteoporosis international,16, 1939- 19474.
Zhao, Y., Zou, B., Shi, Z., Wu, Q., & Chen, G. Q. (2007). The effect of 3-hydroxybutyrate on the in vitro differentiation of murine osteoblast MC3T3-E1 and in vivo bone formation in ovariectomized rats. Biomaterials, 28, 3063-3073.
Figure legends
Fig. 1. MicroCT analyses of metaphysic of the distal femur in mice of different groups. (A) The photos of microCT scans (i) Sham + H2O group. (ii) OVX + H2O group. These mice showed a decrease in the trabecular bone volume. (iii) OVX + AGAF (5 mg/kg) group. (iv) OVX + AGAF (15 mg/kg) group. (v) OVX + inulin (400 mg/kg) group. AGAF and inulin significantly prevented bone loss from OVX-induced 709 710 711 712 713 714 715 716 717 718 719 720 721 722 723 724 725 726 727 728 729 730 731 732 733 734 735 736 737 738 739 740 741 742
osteopenia. (B) Trabecular bone volume (BV/TV, %) and trabecular number (1/mm) (C) Trabecular thickness (μm) and trabecular separation (μm). All values were means ± SD (n = 8). Values with different letters were significantly different.
Fig. 2. Effects of AGAF and inulin on cecal mucosa CaBP mRNA expression and tibia mRNA expression of TRAP, cathepsin K, OCN and Runx2 in OVX mice. A, Fragments were amplified by RT-PCR. The fragments reflect the pooled data for eight samples. B, The expression levels of CaBP, TRAP, cathepsin K, OCN and Runx2 mRNA were measured and quantified densitometrically. Values were normalized to GAPDH mRNA expression. All values were means ± SD (n = 8). Values with different letters were significantly different.
Fig. 3. Effects of AGAF and inulin on plasma bone marker in OVX mice. (A) The plasma OCN and CTx in OVX mice were oral administration of AGAF (5, 15 mg/kg) or inulin (400 mg/kg) for 3 weeks. (B) the plasma OCN and CTx in OVX mice were administration of AGAF (15 mg/kg) and supplemented with or without SM in drinking water for 3 weeks. All values were means ± SD (n = 8). Values with different letters were significantly different.
Fig. 4. Effects of sodium butyrate and AGAF on ALP activity of murine osteoblast MC3T3 E1 cell line and on the osteoclast differentiation from RAW264.7 cell line. (A) ALP activity of murine osteoblast MC3T3 E1 cell under the treatment with sodium butyrate or AGAF for 6 days. Cells were lysed by ultrasonic and analyzed for ALP by p-nitrophenyl phosphate. (B) The number of counted osteoclasts per well (C) Osteoclasts were stained by TRAP. All values were means ± SD (n = 3). Values with 743 744 745 746 747 748 749 750 751 752 753 754 755 756 757 758 759 760 761 762 763 764 765 766 767
different letters were significantly different. 768
Table 1. Effects of AGAF and inulin on fecal bifidobacteria, cecal free Ca, cecal butyric acid, lactic acid, acetic acid, propionic acid and total SCFA levels in OVX mice
Dosage (mg/kg )
Fecal
Bifidobacteri a
Log10CFU/g feces
Cecal Lactic acid (μmol/g) Cecal acetic acid (μmol/g ) Cecal Propionic acid (μmol/g) Cecal butyri c acid (μmol/ g) Cecal total SCFA (μmol/g) Cecal free Ca (mg/dL) Sham + H2O -6.6 0.2b 16.8 0.3a 41.7 1.8a 4.3 0.3a 20.9 0.9b 83.7 2.6 ab 18.1 4.0a OVX + H2O - 6.1 0.5a 16.7 0.3a 40.3 2.2a 4.1 0.4a 18.4 0.5a 79.5 1.5a 17.0 2.0a OVX + AGAF 5 7.0 0.2c 18.6 2.7a 46.6 3.2ab 5.8 0.6b 25.2 0.4c 96.2 5.4cd 23.0 5.7b OVX + AGAF 15 7.3 0.2c 17.6 2.4a 50.9 0.9b 6.9 0.1b 29.0 0.3d 104.4 0.8d 24.2 3.0b OVX + Inulin 400 7.4 0.3bc 19.2 2.1a 42.4 1.4a 6.4 0.3b 21.4 1.1b 89.7 0.9bc 23.8 2.7b
All values were means ± SD (n = 8). Values with different letters were significantly different. 770 771 772 773 774 775
Table 2. MicroCT analyses of femur on OVX mice administrated AGAF and with or without SM supplement in drinking water
Treatments Trabecular bone volume (%) Trabecular number ( 1/mm) Trabecular thickness (μm) Trabecular separation (μm) Sham + H2O + H2O 31.3 2.3b 3.7 0.2c 87.5 8.9c 186 24.0c OVX + H2O + H2O 27.5 1.0a 3.3 0.1ab 62.7 6.8a 199 16.9c OVX + AGAF + H2O 29.8 1.7b 3.5 0.2bc 75.0 7.9bc 194 12.8c OVX + H2O + SM 26.9 2.4a 3.2 0.3a 62.5 5.9a 202 15.4c OVX + AGAF + SM 27.6 2.1a 3.3 0.3ab 63.2 6.1a 200 14.3c
SM (2 mg/mL) was supplement in drinking water. The mice were administrated H2O or AGAF (15 mg /kg) for 3 weeks.
All values were means ± SD (n = 8). Values with different letters were significantly different. 776 777 778 779 780 781 782 783 784 785 786 787 788 789 790 791 792