行政院國家科學委員會專題研究計畫 成果報告
脂蛋白元 A5 之功能研究(3/3)
研究成果報告(完整版)
計 畫 類 別 : 個別型 計 畫 編 號 : NSC 95-2320-B-002-055- 執 行 期 間 : 95 年 08 月 01 日至 96 年 07 月 31 日 執 行 單 位 : 國立臺灣大學醫學院醫學檢驗暨生物技術學系 計 畫 主 持 人 : 高照村 共 同 主 持 人 : 林淑華 計畫參與人員: 碩士班研究生-兼任助理:溫慧勤、林燕琳 臨床醫師:簡國龍 處 理 方 式 : 本計畫涉及專利或其他智慧財產權,1 年後可公開查詢中 華 民 國 96 年 05 月 21 日
APOA1/C3/A5 haplotypes and risk of hypertriglyceridemia in
Taiwanese
1. Introduction
Hypertriglyceridemia is a common metabolic disease in general population and is associated with the risk of coronary heart disease [1,2]. Elevation of serum
triglyceride levels may be due to either overproduction or accumulation of chylomicrons, very-low-density lipoproteins (VLDL) in circulation and genetic control plays an important role for triglyceride metabolism. Primary
hypertriglyceridemia has been associated with LPL deficiency, apolipoprotein (APO) CII deficiency or HL deficiency [3,4]. Several genes associated with triglyceride metabolism were related to triglyceride level in general population. Among the candidate genes, APOA1/C3/A5 gene cluster is located on chromosome 11q23 in human and has been well documented as a predictor for triglyceride levels. The SstI (3238C>G) single nucleotide polymorphism (SNP) in 3’-flanking region and variation of –482C>T within the insulin-responsive element in the promoter and 1100C>T in exon 3 of APOC3 has consistently shown an association with a variation in plasma triglycerides [5-9].
A minor haplotype of APOA5 (–1131C, c.-3G, IVS3+476A and 1259C) and another APOA5 haplotype (–1131T, c.56G, IVS3+476G and 1259T) associated with high plasma triglyceride levels were reported [10,11,12-15]. The c.553G>T
polymorphism in the coding region of APOA5 has shown an association with
hypertriglyceridemia in Chinese. In addition to this polymorphism in the APOA5, the haplotype of APOA5 (IVS3+476G, c.457G and c.553T) is independently associated with hypertriglyceridemia [16]. Furthermore, minor alleles at the APOA1 loci have
been associated with combined hyperlipidemia, or hypertriglyceridemia in some studies [17-19], but without replication [20, 21].
We conducted the case-control study on hypertriglyceridemia in Taiwanese and performed the genetic association study on the numerous SNPs on the APOA1/C3/A5 gene cluster. We focused on the haplotype patterns and estimated the relative risks after adjusting gender, age, and body mass index. Of all haplotypes, we established 2 distinct haplotypes that contribute remarkably to the hypertriglyceridemia in
Taiwanese.
2. Materials and methods
2.1 Subjects
Three hundred and eight patients with hypertriglyceridemia were selected for study. Hypertriglyceridemia was diagnosed on the basis of the lipid level (serum triglyceride > 400 mg/dl) through the metabolic clinic of National Taiwan University Hospital. Patients with secondary hyperlipoproteinemia, hypertension, diabetes, taking primary lipid-lowering drugs, or endocrine or metabolic disorders were excluded. The control subjects consisted of 281 individuals who were recruited from the health checkup in the same hospital. All subjects are Taiwanese and gave their informed consent before participation. The Medical Ethics Committee of National Taiwan University Hospital approved the study protocol. Anthropometric measurements and detailed medical history were obtained in each participant.
The DNA direct sequence or polymerase chain reaction (PCR) then restriction enzyme digestion were carried out to genotype all markers. Primer sequences for genotyping and the PCR conditions were posted on line. To analyze both
APOC3 –455T>C and –482C>T variants, a touch down PCR was carried out.
Restriction enzymes were added to the PCR products and resolved on 3% agarose gels. All PCRs were performed in a GeneAmp® PCR System (Applied Biosystems
Division of Perkin-Elmer Corp.).
APOA5 c.1269T>C, c.553 G>T, IVS +476G>A polymorphisms were genotyped
as previously described [16]. APOA5 c.-3A>G and c.56C>G polymorphisms were genotyped by direct sequencing by using a 3100 DNA genetic analyzer (Applied Biosystems Division of Perkin-Elmer Corp.). Nucleotides were numbered as suggested by the Human Genome Variation Society [22], with nucleotide number 1 being the A of the ATG initiation codon.
2.3 Lipid analysis
Serum total cholesterol, low-density lipoprotein (LDL) cholesterol, HDL cholesterol, and triglyceride levels were measured enzymatically on a Hitachi 7450 Analyzer (Hitachi, Japan) using Roche reagents. Total percentage coefficients of variation using pooled sera ranged from 3.5 to 7.6% for total cholesterol, 4.7 to 11.4% for triglyceride, 4.2 to 10.8% for LDL cholesterol and 4.1 to 11.3% for HDL
cholesterol.
Clinical characteristics of cases and control subjects were compared by the
Student’st test. We estimated the allele frequencies by gene counting methods and
calculated from the EM algorithm. Contingency χ2statistics were used to test differences in allele frequencies between cases and control subjects. We calculated pair-wise linkage disequilibrium, D’and correlation (r2) values and the disequilibrium coefficient was divided by maximum disequilibrium and respective significance levels [23]. Serum triglyceride level difference among every genotype was tested with
multiple linear regression models, after adjusting for age, gender and body mass index. The adjusted odds ratios were calculated by using multivariate logistic regression analysis, and we used the co-dominant modes of inheritance to avoid assumptions. We designated the inferred haplotype distribution in the study participants accounting for haplotype uncertainty by multiple imputation methods [24]. For haplotype analysis, we estimated the haplotype frequency of 12 genotype markers by PM (permutation and model-free analysis) and EH (Estimating Haplotypes) programs, which were implemented in SAS/Genetics software [25,26]. We evaluated the haplotype effects if the haplotype frequency was more than 1% in the study population. The adjusted odds ratios of various haplotypes were estimated after adjusting for age, gender and body mass index effects. We also estimated the triglyceride levels according to various haplotypes among control subjects using general linear models after adjusting for age, gender and body mass index.
3. Results
No statistically significant differences were found between genders. The hypertriglyceridemic subjects were likely to be older, and have a higher body mass index and a higher total cholesterol concentration, compared with the control subjects.
A total of 12 SNPs were analyzed with 4 in each of the three genes. The APOA5 IVS+476G>A, c.553G>T and 1259T>C were published previously [16]. Thus, Table 1 lists the other 9 SNPs. The genotype frequencies of these variable sites were all in Hardy-Weinberg equilibrium. Of these, 5 sites (APOA1 2169G>C, APOC3 3238C>G, -455T>C, -482C>T and APOA5 -1131T>C) revealed significant differences in
genotype frequencies between the hypertriglyceridemic and control groups (P < 0.05). The other 4 sites (APOA1 -3013C>T, -75G>A, IVS3+135C>T and APOC3
IVS1+122G>C) were insignificant. When allele frequency was analyzed by gene counting APOA1 IVS3+135C>T became statistically different between the hypertriglyceridemic and control groups (P < 0.02). The other 3 SNPs at APOA1 -3013C>T, -75G>A and APOC3 IVS1+122G>C remained no differences between groups. No polymorphisms were found for both APOA5 c.-3A>G and c.56C>G (data not shown) in this population. Both sites were not analyzed afterward.
3.2 Linkage disequilibrium and association analysis
The linkage disequilibrium amongst the variants in normal subjects is shown in Table 2. There was significant linkage disequilibrium between large numbers of SNPs. Seventeen percent of all pair wise D’values were greater than 0.9 in normal subjects. Strong linkage disequilibrium was found in APOA5 -1131T>C with all the other
linkage disequilibrium with APOA5 -1131T>C and APOA1 -3013C>T, there was no significant linkage disequilibrium with all the other APOC3 variants. We found in normal controls a significant association between serum triglyceride levels and 3 of the 9 SNPs analyzed in this study (Table 3). The minor allele of each of these three polymorphisms (APOA1 IVS3+135T, APOC3 3238G and APOA5 -1131C,
respectively) was associated with higher serum triglyceride levels. Multiple logistic regression for best selection model in above genotypes after adjusting age, gender and body mass index is shown in Table 4. The APOA5 -1131C minor allele remains the most prominent that is associated to hypertriglyceridemia risk with an odds ratio of 6.37 (95% confidence interval [CI], 4.08-9.95, P < 0.0001). In addition, we found that carriers for the APOA1 2169C are protective against hypertriglyceridemia (odds ratio of 0.38, 95% CI, 0.18-0.83, P = 0.015) but APOA1 IVS3+135C>T became a no significant predictor of risk of hypertriglyceridemia.
3.3 Haplotype analysis and classification of triglyceride-raising haplotypes
Table 5 summarized the 14 most common haplotypes with their relative frequencies. Of these, 4 (haplotypes 1, 2, 3, and 4) among control subjects and 3 (haplotypes 1, 2, and 5) among the hypertriglyceridemia g cases had a frequency > 10%. Haplotype 1 denotes the major allele; haplotype 2 is composed of 5 major and 7 minor alleles, haplotype 3, 10 majors and 2 minors of APOA1 -3013T and -75A, and haplotype 5, 8 majors and 2 minors of APOA5 -1131C and c.553T, in addition to the two minors in haplotype 3. Haplotype 5 occurred at a significantly higher frequency in hypertriglyceridemia than in control subjects (P < 0.0001). Significant differences were found between normal controls and hypertriglyceridemia for haplotypes 1
(19.2% vs. 10.7%, P = 0.005), 2 (10.4% vs 18.3%, P = 0.006), 3 (19.1% vs. 7.2%, P = 0.000) and 5 (1.1% vs 11.3%, P = 0.000). The odds ratios and 95% CI of various haplotypes in the multiple logistic regression model in various haplotypes after adjusting age, gender and body mass index are also listed in Table 5. Haplotype 5 was still the most significantly related to hypertriglyceridemia risk with an adjusted odds ratio of 12.83 (95% CI, 5.08–32.4, P < 0.0001). These analyses suggested that haplotype 5 seems to be specific for hypertriglyceridemic subjects.
Moreover, significant differences in serum triglyceride concentrations were found according to different haplotypes among control subjects. Of the 14 most common haplotypes, 10, 11, and 13 were not found in normal control subjects. Normal control subjects who carried the most common haplotype 1, accounting for 19.2%, had a mean triglyceride level of 86.7 mg/dl (Table 5). Subjects who carry 5, 2, 6, and 4 haplotypes had triglycerides higher than those with haplotype 1. Furthermore, subjects with haplotype 5, a predictor for hypertriglyceridemia, had triglyceride level of 125.5 mg/dl, the highest among all groups. Because haplotype 5 is different from haplotype 3, which is found in controls with an averaged triglyceride level of 86.3 mg/dl, by two additional minor alleles at APOA5 -1131C and c.553T, the latter 2 SNPs are better predictors for hypertriglyceridemia than APOA1 -3013C>T and -75G>A carried in both haplotypes 3 and 5. Two (haplotypes 2 and 6) of the other 3 haplotypes had higher triglyceride levels than the subjects carrying the APOA5 1259C minor allele. Subjects with haplotype 9 had the lowest TG level (73.8 mg/dl) among all normal control subjects. The haplotype 9 is identical to haplotype 1 in 11 of the 12 SNPs and different in APOA1 2169G>C. The results suggested hat APOA1 2169C was a protective factor for the risk of hypertriglyceridemia.
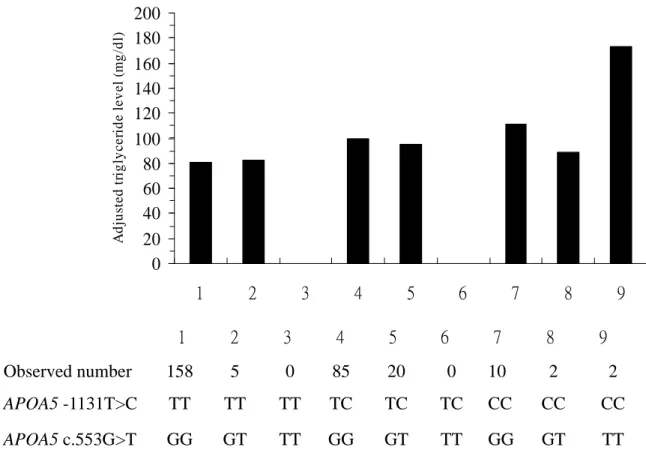
and c.553T, had the highest triglyceride levels, we next examined the effect of minor allele homozygotes on triglyceride levels. Compared with the participants with major alleles (APOA5 -1131TT and c.553GG), those homozygous for both SNPs (APOA5 -1131CC and c.553TT) had higher triglyceride levels (Fig. 1). Subjects homozygous for only APOA5 c.553TT were not recruited in this study. Subjects homozygous for -1131CC had higher triglycerides than those with major alleles (-1131TT).
Furthermore, participants carrying both minor allele of APOA5 -1131CC and c.553TT showed a significant higher triglyceride level. These results indicated that APOA5 -1131C and c.553T were significantly predictive for hypertriglyceridemia risk.
4. Discussion
In this well-designed case-control association study, two distinct haplotypes, haplotypes 2 and 5, from the 12 SNPs of the APOA1/C3/A5 gene cluster, were significantly associated with the risk of hypertriglyceridemia in Taiwanese. These associations were independent of age, gender and body mass index and were not explained by other confounding factors. Our findings provide a new, relevant evidence of risk in Taiwanese and comprehensive information on the APOA1/C3/A5 gene.
Our data suggested that haplotype 5 was a strongly predictive factor for hypertriglyceridemia, which were supported from the data on control subjects.
Haplotype 5 contains 8 major and 4 minor alleles (APOA1 -3013T, -75A, and APOA5 -1131C, c.553T) in the 12 SNPs, compared with other haplotypes that varied in
APOA1 -3013T and -75A. Pennacchio et al. reported that a minor haplotype of
APOA5 (–1131C, IVS3+476A and c.1259C) was associated with a 20-30% elevation
replicate the results among participants carrying this haplotype (i.c. haplotype 6). Our findings confirmed that the genetic predisposition to hypertriglyceridemia varied between different ethnicity.
We are convinced that the SNPs in APOA5 were important for controlling
hypertriglyceridemia risk. Talmud et al. [12] reported that APOA5 c.56G and –1131C had 52% and 40%, respectively, higher triglyceride levels compared with the common allele homozygotes (c.56CC and –1131TT), and the two SNPs’effectswere
independent and additive. Pennacchio and colleagues showed that in Caucasian the predictive genotypes for the disease are APOA5 c.-3A>G and c.56C>G [13], and that the minor allele of the c.56C>G associated with familial combined hyperlipidemia was also reported in Dutch family [27]. However, neither APOA5 c.-3A>G nor c.56C>G polymorphism was found in this ethnicity study. While APOA5 –1131T>C had a significant independent effect on the serum triglyceride level in Japanese [14], this association was not significant in a population-based Spanish control group [15]. Our data identified that the allele frequencies of APOA5 –1131T>C polymorphism were significantly higher in hypertriglyceridemic patients, which was consistent with the Japanese data. Furthermore, although there is strong linkage disequilibrium between APOA5 -1131T>C and APOA5 c.553G>T, subject carrying both minor allele of APOA5 -1131CC and c.553TT still predicted additive high triglyceride levels, indicating that APOA5 c.553G>T enhanced the risk of hypertriglyceridemia by
APOA5 -1131T>C. These synergistically additive effects were biologically plausible
and supported by the pathway of triglyceride metabolism: Fruchart-Najib and colleagues reported an increased hydrolysis of VLDL in vitro by free LPL in the presence of very high amounts of recombinant APOA5 [28], and Schaap et al. showed an influence of APOA5 on LPL-mediated lipolysis of triglyceride-rich,
apolipoprotein-free emulsions [29]. Merkel et al. also demonstrated that in the
presence of proteoglycans, APOA5 led to a significant and dose-dependent increase in LPL-mediated hydrolysis of VLDL triglycerides [30]. All these data suggested that the importance of APOA5 in the regulation of plasma triglyceride levels. Because the c.553G>T polymorphic site is located in the translated region of the APOA5, affecting the amino acid residue 185 causing a substitution of a cysteine which contains sulfur atom, and easily forming disulfide bond for a glycine residue, this amino acid change may enhance the conformation or function of the APOA5 related to hypertriglyceridemia.
The frequency of haplotype 2 was significantly higher in hypertriglyceridemia cases than in control subjects. Due to carrying the minor alleles of APOA5 -1131T>C, IVS3+476G>A and c.1259T>C, haplotype 2 is similar to the APOA5*2 haplotype that was previously reported to associate with increased plasma triglyceride levels [13]. Haplotype 2 is distinguished from haplotype 6 with its comparably higher frequency among hypertriglyceridemia cases and its variations in 3 of the 4 SNPs in both
APOC3 and APOA1 loci. Our data suggested that carriers of the APOA1 2169C minor
allele had a marginally significant lowering effect on triglycerides.
The limitations of this study include that fact our participants were recruited from hospital; therefore, the data are not applicable to general population. Second, because we selected the SNPs from literature and did not cover the extensive APOA1/C3/A5 gene locus, we might miss some information from other SNPs. Nevertheless, we constructed haplotypes with tagged SNPs and the results are valid for the association study on the risk of hypertriglyceridemia.
In this well-designed case-control study, we established that 2 distinct haplotypes contribute to the hypertriglyceridemia in Taiwanese. Both haplotypes comprise neither
APOA5 c.-3A>G nor c.56C>G polymorphism which were reported among Caucasians
and other ethnicity. The results of our study extend and add new information to the existing data regarding the association between APOA1/C3/A5 gene cluster and hypertriglyceridemia. Further studies are warranted to determine the molecular mechanism of these haplotypes on the regulation of triglyceride levels.
References
[1] Hokanson JE, Austin MA. Plasma triglyceride level is a risk factor for
cardiovascular disease independent of high-density lipoprotein cholesterol level: a meta-analysis of population-based prospective studies. J Cardiovasc Risk 1996;3:213–9.
[2] Tang Y, Sun P, Guo D, Ferro A, Ji Y, Chen Q, Fan L. A genetic variant c.553G > T in the apolipoprotein A5 gene is associated with an increased risk of coronary artery disease and altered triglyceride levels in a Chinese population.
Atherosclerosis 2006;185:433-7.
[3] Breckenridge WC, Little A, Steiner G, Chow A, Poapst M.
Hypertriglyceridemia associated with deficiency of apolipoprotein C-II. New Engl J Med 1978;298:1265–73.
[4] Carlson LA, Holmquist L, Nilsson-Ehle P. Deficiency of hepatic lipase activity in post-heparin plasma in familial hyper-alpha-triglyceridaemia. Acta Med Scand 1986;219:435–47.
[5] McConathy WJ, Gesquiere JC, Bass H, Tartar A, Fruchart JC, Wang CS. Inhibition of lipoprotein lipase activity by synthetic peptides of apolipoprotein C-III. J Lipid Res 1992;33:995–1003.
Gambert P, Ball MJ. Variation at the apo AI/CIII/AIV gene complex is associated with elevated plasma levels of apo CIII. Atherosclerosis 1991;87:239–47.
[7] Waterworth DM, Talmud PJ, Bujac SR, Fisher RM, Miller G.J, Humphries SE. Contribution of apolipoprotein C-III gene variants to determination of
triglyceride levels and interaction with smoking in middle-aged men. Arterioscler Thromb Vasc Biol 2000;20:2663–9.
[8] Waterworth DM, Talmud PJ, Humphries SE, Wicks PD, Sagnella GA, Strazullo P, Alberti KM, Cook DG, Cappuchio FP. Variable effects of the apoCIII C-482T variant on insulin, glucose and triglyceride levels in different ethnic groups: gender–BMI–genotype interaction. Diabetalogia 2001;4:245–8.
[9] Ordovas JM, Civeira F, Genest J, Craig JS, Robbins AH, Meade T, Pocovi M, Frossard PM, Masharani U, Wilson PW. Restriction fragment length
polymorphisms of the apolipoprotein A-I, C-III, A-IV gene locus. Relationships with lipids, apolipoproteins, and premature coronary artery disease.
Atherosclerosis 1991;87:75–86.
[10] van der Vliet HN, Sammels MG, Leegwater AC, Levels JH, Reitsma PH, Boers W, Chamuleau RA. Apolipoprotein A-V: a novel apolipoprotein associated with an early phase of liver regeneration. J Biol Chem 2001;276:44512–20.
[11] Pennacchio LA, Olivier M, Hubacek JA, Cohen JC, Cox DR, Fruchart JC, Krauss RM, Rubin EM. An apolipoprotein influencing triglycerides in humans and mice revealed by comparative sequencing. Science 2001;294:169–73. [12] Talmud PJ, Hawe E, Martin S, Olivier M, Miller GJ, Rubin EM, Pennacchio
LA, Humphries SE. Relative contribution of variation within the
Genet 2002;11:3039–46.
[13] Pennacchio L A, Olivier M, Hubacek JA, Krauss RM, Rubin EM, Cohen JC. Two independent apolipoprotein A5 haplotypes influence human plasma triglyceride levels. Hum Mol Genet 2002;11:3031–8.
[14] Nabika T, Nasreen S, Kobayashi S, Masuda J. The genetic effect of the
apoprotein AV gene on the serum triglyceride level in Japanese. Atherosclerosis 2002;165:201–4.
[15] Ribalta J, Figuera L, Fernandez-Ballart J, Vilella E, Cabezas MC, Masana L, Joven J. Newly identified apolipoprotein AV gene predisposes to high plasma triglycerides in familial combined hyperlipidemia. Clin Chem
2002;48:1597–600.
[16] Kao JT, Wen HC, Chien KL, Hsu HC, Lin SW. A novel genetic variant in the apolipoprotein A5 gene is associated with hypertriglyceridemia. Hum Mol Genet 2002;12:2533-9.
[17] Tybjaerg-Hansen A, Nordestgaard BG, Gerdes LU, Faergeman O, Humphries SE. Genetic markers in the apo AI-CIII-AIV gene cluster for combined hyperlipidemia, hypertriglyceridemia, and predisposition to atherosclerosis. Atherosclerosis 1993;100:157-69.
[18] Hayden MR, Kirk H, Clark C, Frohlich J, Rabkin S, McLeod R, Hewitt J. DNA polymorphisms in and around the Apo-A1-CIII genes and genetic
hyperlipidemias. Am J Hum Genet 1987;40:421–30.
[19] Wojciechowski AP, Farrall M, Cullen P, Wilson TM, Bayliss JD, Farren B, Griffin BA, Caslake MJ, Packard CJ, Shepherd L. Familial combined hyperlipidaemia linked to the apolipoprotein AI-CII-AIV gene cluster on chromosome 11q23-q24. Nature 1991;349:161–4.
[20] Wijsman EM, Brunzell JD, Jarvik GP, Austin MA, Motulsky AG, Deeb SS. Evidence against linkage of familial combined hyperlipidemia to the
apolipoprotein AI-CIII-AIV gene complex. Arterioscler Thromb Vasc Biol 1998;18:215–26.
[21] Tahvanainen E, Pajukanta P, Porkka K, Nieminen S, Ikavalko L, Nuotio I, Taskinen MR, Peltonen L, Ehnholm C. Haplotypes of the ApoA-I/CIII/A-IV gene cluster and familial combined hyperlipidemia. Arterioscler Thromb Vasc Biol 1998;18:1810–7.
[22] den Dunnen JT, Paalman MH. Standardizing mutation nomenclature: why bother? Hum Mutat 2003;22:181–2.
[23] Hartl DL, Clark AG. Darwinian evolution in mendelian population. Principles of population genetics. Sinauer Associates, Sunderland, MA, 1989, p. 1–60. [24] Kraft P, Cox DG, Paynter RA, Hunter D, De Vivo I. Accounting for haplotype
uncertainty in matched association studies: a comparison of simple and flexible techniques. Genet Epidemiol 2005;28:261-72.
[25] Xie X, Ott J. Testing linkage disequilibrium between a disease gene and marker loci. Am J Hum Genet 1993;53:1107.
[26] Zhao JH, Curtis D, Sham PC. Model-free analysis and permutation tests for allelic associations. Hum Hered 2000;50:133–9.
[27] van der Vleuten GM, Isaacs A, Zeng WW, Avest ET, Talmud PJ, Geesje M. Dallinga-Thie GM, van Duijn CM, Stalenhoef AFH, de Graaf J. Haplotype analyses of the APOA5 gene in patients with familial combined hyperlipidemia. Biochim Biophys Acta 2007;1772:81-8.
[28] Fruchart-Najib J, Baug E, Niculescu LS, Pham T, Thomas B, Rommens C, Majd Z, Brewer B, Pennacchio LA, Fruchart JC. Mechanism of triglyceride
lowering in mice expressing human apolipoprotein A5. Biochem Biophys Res Commun 2004;319:397–404.
[29] Schaap, F.G., Rensen PC, Voshol PJ, Vrius C, van der Vliet HN, Chamuleau RA, Havekes LM, Groen AK, van Dijk. KW. ApoAV reduces plasma triglycerides by inhibiting very low density lipoprotein-triglyceride (VLDL-TG) production and stimulating lipoprotein lipase-mediated VLDL-TG hydrolysis. J Biol Chem 2004;279:27941–7.
[30] Merkel M, Loeffler B, Kluger M, Fabig N, Geppert G, Pennacchio LA, Laatsch A, Heeren J. Apolipoprotein AV accelerates plasma hydrolysis of
triglyceriderich lipoproteins by interaction with proteoglycan-bound lipoprotein lipase. J Biol Chem 2005;280:21553–60
Table 1
Comparison of genotype and allele frequencies of the polymorphisms in the APOA1/C3/A5 gene between control and hypertriglyceridemic group Controls (n) Hypertriglyceridemia (n) P APOA1 -3013C>T C/C 0.529(145) 0.463(130) 0.249 C/T 0.358(98) 0.423(119) T/T 0.113(31) 0.114(32) C allele 0.708(388) 0.674(379) 0.225 T allele 0.292(160) 0.326(183) APOA1 -75G>A G/G 0.486(119) 0.470(132) 0.791 G/A 0.396(97) 0.423(119) A/A 0.118(29) 0.107(30) G allele 0.684(335) 0.681(383) 0.940 A allele 0.316(155) 0.319(179) APOA1 IVS3 +135C>T C/C 0.514(125) 0.430(122) 0.069 C/T 0.391(95) 0.422(120) T/T 0.095(23) 0.148(42) C allele 0.710(345) 0.641(364) 0.017 T allele 0.290(141) 0.359(204) APOA1 2169G>C G/G 0.115(28) 0.050(14) 0.006 G/C 0.885(215) 0.950(267) C/C 0(0) 0(0) G allele 0.942(458) 0.975(548) 0.007 C allele 0.058(28) 0.025(14) APOC3 3238C>G C/C 0.493(139) 0.391(117) 0.041 C/G 0.411(116) 0.478(143) G/G 0.096(27) 0.131(39) C allele 0.699(394) 0.630(377) 0.014 G allele 0.301(170) 0.370(221) APOC3 IVS1 +122G>C G/G 0.894(219) 0.905(256) 0.311 G/C 0.098(24) 0.095(27) C/C 0.008(2) 0(0) G allele 0.943(462) 0.952(539) 0.491 C allele 0.057(28) 0.048(27) APOC3 -455T>C T/T 0.372(105) 0.244(73) 0.003 T/C 0.426(120) 0.482(144)
C/C 0.202(57) 0.274(82) T allele 0.585(330) 0.485(290) 0.001 C allele 0.415(234) 0.515(308) APOC3 -482C>T C/C 0.362(102) 0.247(74) 0.011 C/T 0.418(118) 0.492(147) T/T 0.220(62) 0.261(78) C allele 0.571(322) 0.493(295) 0.008 T allele 0.429(242) 0.507(303) APOA5 -1131T>C T/T 0.578(163) 0.191(56) 0.000 T/C 0.376(106) 0.430(126) C/C 0.046(13) 0.379(111) T allele 0.766(432) 0.406(238) 0.000 C allele 0.234(132) 0.594(348)
Table 2
Linkage disequilibrium between all the variants in normal subjects. Left lower triangle part as D’, and right upper part as P values for pair-wise linkage disequilibrium. APOA1 -3013 C>T APOA1 -75 G>A APOA1 IVS3 +135 C>T APOA1 2169 G>C APOC3 3238 C>G APOC3 IVS1 +122 G>C APOC3 -455 T>C APOC3 -482 C>T APOA5 -1131 T>C APOA5 IVS3 +476 G>A APOA5 c.553 G>T APOA5 c.1259 T>C APOA1 -3013C>T 0 0 0.1658 0 0.0091 0 0 0.3294 0.1238 0.0314 0.1106 APOA1 -75G>A 0.9129 0 0.0087 0 0.0088 0 0 0.2500 0.3370 0.2895 0.3901 APOA1 IVS3 +135C>T 0.9679 0.8330 0.0137 0 0.0137 0 0 0.0001 0 0.0786 0 APOA1 2169G>C 0.5279 1 1 0.0124 0.3406 0.0111 0.0063 0.5861 0.4820 0.7983 0.4549 APOC3 3238C>G 0.9685 0.8335 0.9796 1 0.0125 0 0 0 0 0.1126 0 APOC3 IVS1 +122G>C 1 1 1 1 1 0 0.0000 0.0349 0.4666 0.6441 0.2402 APOC3 -455T>C 0.8810 0.7918 0.8206 0.7982 0.8269 1 0 0 0 0.4669 0.0000
APOC3 -482C>T 0.8651 0.7771 0.8144 0.8336 0.8329 1 0.9541 0.0001 0 0.6141 0.0005
APOA5 -1131T>C 0.1671 0.1973 0.2998 0.2567 0.3554 1 0.4227 0.3653 0 0 0
APOA5 IVS3 +476G>A 0.3010 0.1901 0.5775 0.3826 0.6194 0.3983 0.5691 0.5051 0.8948 0.0600 0
APOA5 c.553G>T 0.3668 0.2074 0.7919 0.0182 0.6178 0.5402 0.2210 0.1488 0.7145 1 0.6713
Table 3
Triglyceride levels (mg/dl) according to different SNPs in control group Triglyceride (mean±SD) P APOA1 -3013C>T C/C 90.9±34.3 0.782 C/T 90.4±38.3 T/T 85.9±35.7 APOA1 -75 G>A G/G 93.5±35.6 0.408 G/A 89.4±39.5 A/A 84.0±24.5 APOA1 IVS3 +135C>T C/C 84.0±31.7 0.003 C/T 100.8±38.4 T/T 89.3±40.9 APOA1 2169G>C G/G 91.6±36.3 0.537 G/C 87.1±34.9 C/C -APOC3 3238C>G C/C 83.4±31.9 0.008 C/G 97.1±38.5 G/G 92.8±38.6 APOC3 IVS1 +122G>C G/G 90.9±36.4 0.911 G/C 90.2±35.5 C/C 80.0±28.3 APOC3 -455T>C T/T 83.7±32.5 0.079 T/C 93.9±37.8 C/C 93.0±36.6
APOC3 -482C>T C/C 84.5±32.3 0.112 C/T 94.7±39.7 T/T 89.7±32.9 APOA5 -1131T>C T/T 80.9±29.7 <0.0001 T/C 100.5±39.1 C/C 116.8±44.2
Table 4
Multiple logistic regression after adjusting age, gender and BMI
Variable Odds ratio (95% CI) P
APOA1 -3013C>T (CT and TT)/CC 1.57 (1.06-2.32) 0.026
APOA1 -75 G>A (GA and AA)/GG 1.29 (0.86-1.93) 0.212
APOA1 IVS3 +135C>T (CT and TT)/CC 1.58 (0.80-3.14) 0.190
APOA1 2169G>C (GC and CC)/GG 0.38 (0.18-0.83) 0.015
APOC3 3238C>G (CG and GG)/CC 1.59 (1.08-2.33) 0.018
APOC3 IVS1 +122G>C (GC and CC)/GG 0.95 (0.50-1.80) 0.864
APOC3 -455T>C (TC and CC)/TT 1.72 (1.13-2.61) 0.011
APOC3 -482C>T (CT and TT)/CC 1.69 (1.11-2.56) 0.014
Table 5
Common haplotype derived from all polymorphic sites using all the genotype data. The 14 depicted haplotypes account for 80.9% of all haplotypes, none of the other predicted haplotypes had a frequency of greater than 1%. The minor alleles that define the haplotypes are highlighted in bold.
Frequency, % APOA1 APOC3 APOA5
Haplo
type All Normal (TGa) HTGb P
-3013 C>T -75 G>A IVS3 +135 C>T 2169 G>C 3238 C>G IVS1 +122 G>C -455 T>C -482 C>T -1131 T>C IVS3 +476 G>A c.553 G>T c.1259 T>C ORc 95% CI P 1 14.5 19.2 (86.7) 10.7 0.005 C G C G C G T C T G G T 0.4 0.25, 0.62 < 0.0001 2 14.2 10.4 (108.7) 18.3 0.006 C G T G G G C T C A G C 2.13 1.37, 3.29 0.001 3 13.3 19.1 (86.3) 7.2 0.000 T A C G C G T C T G G T 0.35 0.22, 0.55 < 0.0001 4 8.9 10.3 (89.1) 7.5 0.306 C G T G G G C T T G G T 0.59 0.35, 1.00 0.052 5 6.1 1.1 (125.5) 11.3 0.000 T A C G C G T C C G T T 12.83 5.08, 32.41 < 0.0001 6 4.7 3.6 (97.6) 5.8 0.323 T A C G C G T C C A G C 2.73 1.32, 5.64 0.007 7 4.1 4.9 (81.7) 3.0 0.384 C G C G C C C T T G G T 0.65 0.32, 1.34 0.24 8 3.6 4.5 (78.1) 3.1 0.505 C G C G C G C T T G G T 0.27 0.12, 0.64 0.003 9 3.5 4.9 (73.8) 2.1 0.100 C G C C C G T C T G G T 0.43 0.17, 1.04 0.06 10 2.0 0.0 3.4 0.002 C G T G G G C T C G T T 11 1.9 0.0 3.4 0.002 T A C G C G C T C G T T 12 1.6 0.9 2.2 0.288 C G C G C G C T C G T T 13 1.5 0.0 2.1 0.031 C G C G C G T C C A G C 14 1.0 1.8 (76.5) 0.0 0.025 C G T G G G T C T G G T
a
indicates average triglyceride concentration in mg/dl.
b
indicates hypertriglyceridemia.
c
Fig. 1. Triglyceride levels in normal subjects after adjusting age, gender and BMI, according to combined APOA5 -1131T>C and APOA5
c.553G>T genotypes. Subjects carrying APOA5 -1131CC had higher mean serum triglyceride levels than those with wild type (111.2 mg/dl for APOA5 c.553GG, 88.8 mg/dl for APOA5 c.553GT versus 80.4 mg/dl for those wild type).
Fig. 1.
0 20 40 60 80 100 120 140 160 180 200 1 2 3 4 5 6 7 8 9 A d ju st e d tr ig ly c e ri d e le v e l (m g /d l) 0 20 40 60 80 100 120 140 160 180 200 1 2 3 4 5 6 7 8 9 A d ju st e d tr ig ly c e ri d e le v e l (m g /d l) TT GT GG TT GT GG TT GT GG APOA5 c.553G>T CC CC CC TC TC TC TT TT TT APOA5 -1131T>C 2 2 10 0 20 85 0 5 158 Observed numberEvaluation:
We have finished our project and have submitted the manuscript for publication. The results reached our goal.