Purification
and Characterization
of a Trypsin Inhibitor
from Mouse Seminal Vesicle Secretion
Min-Long
Lai,*
Shun-Wen
Chen,?
and Yee-Hsiung
Chen*,T,’
*Institute
ofBiochemical
Science, College
ofScience, National
Taiwan
University;
and tlnstitute
ofBiological
Chemistry,
Academia
Sinica, Taipei, 10764 Taiwan,
Republic
ofChina
Received February 14, 1991, and in revised form May 24, 1991
A Kazal-type
trypsin
inhibitor
in mouse seminal
vesicle
secretion
was purified
to homogeneity
via a series of pu-
rification
steps including
ammonium
sulfate
fraction-
ation,
affinity
chromatography
on a trypsin
Affi-Gel
10
column,
and HPLC
on a reverse
phase C, column.
It was
shown
to be a weak basic protein
with
an isoelectric
point
of 8.7 and to contain
no carbohydrate.
The protein
had
a specific
activity
of 184 U/mg
protein
in the inhibitory
effect on the trypsin
digestion
of N-benzoyl-Pro-Phe-
Arg-p-nitroanilide.
Analysis
of the kinetic
data for the
trypsin
digestion
of N-benzoyl-Phe-Val-Arg
‘I-amido-
4-methylcoumarin
revealed
that the protein
was a com-
petitive
inhibitor
with
an inhibitory
constant
(Ki) of 0.15
nM.
The molecular
mass of the protein
was determined
to be 7 kDa by both gel chromatography
and electropho-
resis. Results
of direct
amino
acid determinations
indi-
cated that this protein
corresponded
to the reading
frame
of MP12
cDNA
identified
from mouse prostate.
We found
that cleavage
only
at the reactive
site of this protein
(Arg’s-Ile20)
resulted
in its denaturation.
o ISSI Academic Press, Inc.The seminal vesicles present in most adult male mam-
mals secrete a group of proteins that constitute a major
portion of seminal plasma (1, 2). The biological signifi-
cance of these proteins in mammalian reproductive phys-
iology is currently obscure. It was found that extirpation
of seminal vesicles from a mouse greatly reduced fertility
(3,4). Recently, seven and five major proteins have been
identified from mouse and rat seminal vesicle secretion
(SVS).’ (5, 6). The genetic expression of some of these
i To whom correspondence should be addressed. Fax: (02) 363.5038. ‘Abbreviations used: MSVS, mouse seminal vesicle secretion; TI, trypsin inhibitor; PSTI, pancreatic secretory trypsin inhibitor; PI, pro- tease inhibitor; SDS, sodium dodecyl sulfate; PAGE, polyacrylamide gel electrophoresis; IEF, isoelectric focusing; PCR, polymerase chain re- action.
0003.9861/91 $3.00
Copyright 0 1991 by Academic Press, Inc. All rights of reproduction in any form reserved.
proteins has been shown to be dependent on the presence
of testosterone (6-8).
Protease inhibitors (PIs) have a physiological function
other than the inhibition of protease activity
(9). Exis-
tence of PIs in sex accessory tissues of mammals is well
known (10-12). They are believed to be important for
protection of genital tract epithelium against proteolytic
damage (13) and/or have a regulatory role in the fertil-
ization process (14, 15). Hence, the study of PIs in the
genital tract is an important subject of reproductive bi-
ology.
A cDNA (MP12) which codes for a Kazal-type PI has
been identified in the mouse ventral prostate by molecular
cloning (16). Androgen-dependent expression of this PI
mRNA as probed with MP12 cDNA has been observed
in male sex accessory tissues including ventral prostate,
seminal vesicle, and coagulating gland, but it is expressed
constitutively
in the pancreas (16). Meanwhile, a PI with
a molecular weight of 12 kDa (P12) has been identified
in the mouse ventral prostate, and it was suggested that
MP12 cDNA corresponds to the P12 protein (17). In the
present study, we purified and characterized one TI from
MSVS. This TI is a basic polypeptide of 57 amino acid
residues, which is similar to rat PSTI-II but different from
rat PSTI-I (9) on the basis of molecular size. It is not a
glycoprotein in nature, which is different from the P12
protein which is believed to be a glycoprotein (17). We
confirmed further that the primary structure of this TI
is identical to that deduced from MP12 cDNA.
EXPERIMENTAL
Materials. Affi-Gel 10 was purchased from Bio-Rad Laboratories (Richmond, CA). N-Benzoyl-Pro-Phe-Arg-p-nitroanilide HCl, N-ben- zoyl-Phe-Val-Arg 7-amido-4-methylcoumarin, bovine pancreatic tryp sin, and soybean trypsin inhibitor were obtained from Sigma Chemical Co., (St. Louis, MO). Markers for IEF and thin layer ampholine PAGE plate were procured from Sartorius Gmbh (FRG). Sephadex G-50 was obtained from Pharmacia (Uppsala, Sweden). AMV reverse transcriptase and T7 DNA polymerase sequencing system were purchased from Pro- mega (Madison, WI). T4 DNA ligase was obtained from Bethesda Re-
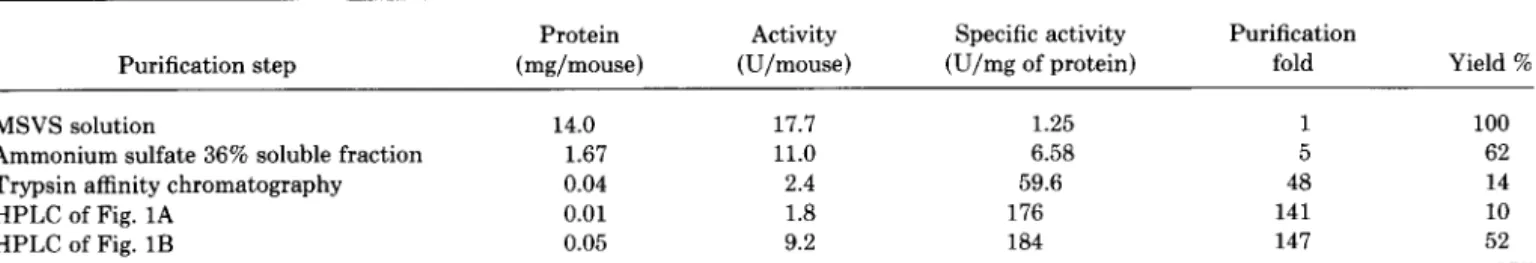
TABLE I
Purification
of TI from MSVS”
Purification step Protein (mg/mouse) Activity (U/mouse) Specific activity (U/mg of protein) Purification fold Yield % MSVS solution 14.0 17.7 1.25 1 100Ammonium sulfate 36% soluble fraction 1.67 11.0 6.58 5 62
Trypsin affinity chromatography 0.04 2.4 59.6 48 14
HPLC of Fig. 1A 0.01 1.8 176 141 10
HPLC of Fig. 1B 0.05 9.2 184 147 52
e Data were the average of 20 mice, 9 weeks old. See text for details.
search Laboratories (Gaithersburg, MD). Restriction enzymes such as BumHI, EcoRI, and SmuI were purchased from Boehringer Mannheim Gmbh (FRG). Taq polymerase was obtained from Perkin-Elmer Cetus Co., (Norwalk, CT). Geneclean kit was purchased from Bio 101 Inc. (La Jolla, CA). All chemicals were reagent grade from commercial sources.
Extraction of TI from MSVS. The seminal vesicles of mature male mice (ICR) killed by cervical dislocation were carefully dissected to free them from the adjacent coagulating gland, and the secretion collected from 100 mice was expressed directly into 100 ml of ice cold 5% acetic acid. After stirring at 4°C for 30 min, the solution became clear. The solution was fractionated in 36% saturation of ammonium sulfate, and the mixture was adjusted to pH 2.0 with 6 N HCI. The precipitating material was removed by centrifugation at 8OOOg for 20 min. The solution was passed through a glass filter to remove lipid and dialyzed against 0.5% acetic acid and lyophilized.
SDS-PAGE and ZEF. Proteins were resolved by SDS-PAGE on a 15% gel slab (15 X 12 X 0.075 cm) according to the method of Schagger et al. (18). IEF on a thin layer ampholine PAGE plate (pH range 3-10) was performed by a LKB multiphor unit. The cathodic fluid consisted of 0.44% Arg-0.06% Lys, which was adjusted to pH 10 by the addition of ethylenediamine. The anodic fluid contained 0.33% Asp-0.37% Glu at pH 3.0. Focusing was conducted for 4 h at a constant power of 2.0 W with initial current of 10 mA and a voltage maximum of 1.7 kV.
Immobilization of trypsin. Coupling of protein to Affi-Gel 10 was according to the supplier’s specification. At 4”C, 5 mg of trypsin in 1.0 ml of 5 mM phosphate-O.4 M NaCl at pH 7.9 was mixed overnight with an equal volume of Affi-Gel 10, which was washed with the same buffer beforehand. Ethanolamine was then added to the gel mixture to a final concentration of 1.0 M to stop the coupling reaction. It was determined that 1 ml of the trypsin affinity gel could absorb 150 fig of soybean trypsin inhibitor.
Amino acid analysis and sequencing. Protein was hydrolyzed in the vapor phase of 7.0 M HCl containing 10% trifluoroacetic acid and 0.1% phenol at 158°C for 30 min, according to the method of Tsugita et al. (19). Amino acid composition was determined by the conventional method of Spackman et al. (20) on a Beckman System 6300 high per- formance analyzer. The amount of tryptophan was determined by a UV absorption method. The amino acid sequence was determined by au- tomated Edman degradation with a gas-phase microsequenator (477A protein sequencer with on line 120A analyzer, Applied Biosystems, Foster City, CA).
Sugar analysis. Protein was digested with 3.0 M trifluoroacetic acid in a siliconized tube at 100°C for 6 h. The digested sample was evaporated to dryness, redissolved in an adequate amount of water, and subjected to chromatography on a Dionex Bio LC System (Dionex Corp., Sun- nyvale, CA) attached to a pulse amperometric detector.
Assay of TI actiuity. N-Benzoyl-Pro-Phe-Arg-p-nitroanilide HCl was used as substrate and hydrolysis of the substrate was followed by the change in absorbance at 405 nm (21, 22). One enzyme unit corre- sponded to the hydrolysis of 1 pmol of substrate per minute by bovine
pancreatic trypsin. The activity of TI was based on its inhibitory effect on the digestion of substrate by trypsin. Trypsin and TI were mixed and preincubated for 5 min before the addition of substrate. One inhibitor unit corresponded to the reduction of one enzyme unit. The specific activity of TI was expressed in inhibitor units per milligram of protein.
Kinetic analysis. The trypsin digestion of N-benzoyl-Phe-Val-Arg 7-amido-4-methylcoumarin was followed by the change in fluorescence at 460 nm with excitation wavelength at 380 nm. The kinetic data for the inhibitory effect of TI on the trypsin activity were analyzed by Dix- on’s plot for determining the inhibitory constant (K,) of a tight binding enzyme inhibitor (23, 24):
K(l + [SIIK,) = K
PI
where K,,, may be regarded as a “pseudo-equilibrium constant” and K is the distance between two neighboring intersection points on the ab- scissa of the plot of the velocity of the enzyme reaction (ordinate) vs inhibitor concentration (abscissa). A plot of K against [S] will be a straight line of which the intersection with the vertical axis gives Ki and that with the base line gives K,,,.
RNA isolation and cDNA preparation. Total cellular RNA was iso- lated from adult MSV according to a previous method (25). Single- stranded cDNAs were prepared on the polyadenylated fraction of MSV RNA by standard procedure (25) using AMV reverse transcriptase.
Polymeruse chain reaction, cloning and analysis. Based on MP12 cDNA of mouse ventral prostate, we synthesized one oligonucleotide of
CCCAGATCTTCGACAATGAAGGT, which is in the 5’-noncoding re- gion, and the other oligonucleotide of CCCACGTTGCCTTTCATTA-
CGG, which is complementary to the 3’.untranslated region (see Fig. 5). Those two oligonucleotides were employed as the primer pair for PCR, which amplified the single-stranded cDNAs of MSV with Taq polymerase for 30 cycles: 94°C 1.5 min; 4O“C, 2.0 min; 72”C, 3.0 min. The reaction mixture was subjected to electrophoresis on a 1.8% agarose gel. The amplified DNA, which was extracted from the gel with a Gene- clean kit, was ligated to pUC19 via a SmaI site and introduced into Escherichiu coli strain DH5a using a transformation technique (26). Positive clones containing the cDNA insert were confirmed by EcoRI- BumHI digestion. The cDNAs concerned were sequenced by the dideoxy T7 DNA polymerase technique using either oligonucleotide of the primer pair employed for PCR as the primer (27). Each base was determined at least three times in both orientations.
RESULTS
Purification of MSVS TI
Table I summarizes the steps for the purification.
MSVS was soluble in 5% acetic acid. The soluble MSVS
was fractionated initially by 36% saturation of ammonium
ab
0000 49.890
0 000
Elution
Time,Min
39.910
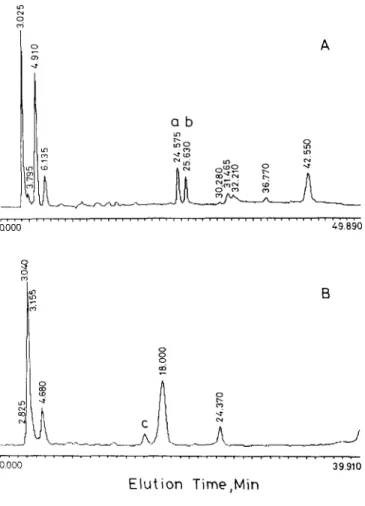
FIG. 1. Purification of MSVS TI by reverse-phase HPLC. Chroma- tography was carried out on a Waters C4 300 A column (3.9 X 300 mm) equilibrated with 0.1% TFA, and the effluent was monitored at 280 nm. (A) The TI fraction isolated from affinity chromatography on a trypsin Affi-Gel 10 column (see text for details) was applied, and the column was eluted with a linear gradient of O&60% acetonitrile at a flow rate of 1.0 ml/min for 50 min. (B) The soluble fraction of MSVS in 36% sat- uration of ammonium sulfate (see text for details) was subjected directly to chromatography, and the column was eluted with a linear gradient of 15-40% acetonitrile at a flow rate of 1 ml/min for 40 min. Peaks a, b, and c are denoted.
sulfate precipitation at pH 2.0. Around 62% of total TI
activity remained in the solution. Further purification by
affinity chromatography on a trypsin Affi-Gel 10 column
preequilibrated with 0.4
MNaCl-0.1
MTris at pH 7.9
gave a TI fraction which was eluted from the column with
0.1
Mglycine at pH 3.0 (not shown). Only 14% of the
total TI activity was recovered from the column. Subjec-
tion of the TI fraction to HPLC on a reverse phase C,
300A column gave six major peaks (Fig. 1A). TI activity
appeared only in peak a. Direct resolution of the proteins
in the ammonium sulfate solution described above by
HPLC greatly improved the yield of TI, which appeared
at peak c shown in Fig. 1B. Around 52% of the total TI
activity was recovered with this procedure. However, re-
peated HPLC was necessary to obtain pure TI. It should
be mentioned that the purity of TI was increased 147-
fold after HPLC. The specific activity of TI thus purified
was 184 U/mg of protein. Estimation based on the activity
indicated that TI comprised 0.7% of the soluble MSVS
proteins.
Preliminary Characterization of MS VS TI
MSVS was resolved by SDS-PAGE
into seven major
protein bands (Fig. 2A, lane 2). In accordance with the
nomenclature of Chen et al. (6), these bands were labeled
I-VII
in decreasing order of size.
The absorbance, E :&, , of peak a protein (Fig. 1A) was
determined to be rather low at 4.2. Sugar analysis revealed
no carbohydrate present in the protein. A single band of
7 kDa with the isoelectric point at 8.7 was detected on
analysis of the protein by both SDS-PAGE (Fig. 2A, lane
3) and IEF in pH 3.0-10.0 (Fig. 2B, lane 2), indicating
that the protein had been purified to homogeneity and
was distinct from the main proteins (cf. lanes 2 and 3 of
Fig. 2A). The molecular weight of the protein was deter-
mined from the partition coefficient, K,, , in the gel chro-
matography (Fig. 3) agreed with that estimated from
SDS-PAGE.
The K,, determined from the position trac-
ing for TI activity in the gel chromatography of the soluble
MSVS showed no difference from that of peak a protein,
suggesting no association between peak a protein and
other protein(s) in MSVS.
A
1
2
3
FIG. 2. (A) Protein components of soluble MSVS. A suitable amount of protein was subjected to SDS-PAGE on a 15% slab gel (15 X 12 X 0.075 cm). (1) Protein standard: phosphorylase b (94 kDa), bovine serum albumin (67 kDa), ovalbumin (43 kDa), carbonic anhydrase (30 kDa), soybean trypsin inhibitor (20 kDa), n-lactalbumin (14 kDa), snake venom cardiotoxin (7 kDa); (2) MSVS (50 pg); (3) peak a protein of
Fig. 1 (10 pg). (B) Isoelectric focusing patterns: (1) protein markers; (2) peak a protein of Fig. 1 (5.0 pg). IEF was performed in thin layer am- pholine PAGE plate (pH 3-10). Protein patterns were visualized after staining the gels with Coomassie blue. The isoelectric point of peak a protein appeared at 8.7.
2 1
\
Lysozyme 14300,0.295 Y05
IO3 104 105
Molecular Weight
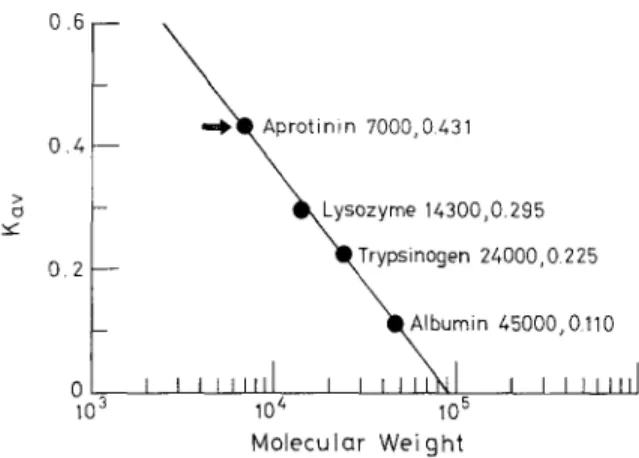
FIG. 3. Molecular weight determination of MSVS TI by gel filtration. Peak a protein of Fig. 1, soluble MSVS, and marker proteins were applied individually to a Sephadex G-50 column (1.2 X 100 cm). The column was eluted with Tris 0.1 M at pH 7.8. Trypsin inhibitor activity was measured. The partition coefficient of each protein was calculated from its elution volume (VJ, void volume ( VJ, and total bed volume (V,) of the gel in accordance with K., = (V, - V,)/( V, - VJ. The molecular weight and Kav of each marker protein are shown in the figure. The K., of peak a protein as denoted with an arrow in the figure was estimated to be 0.43, which corresponded to a molecular weight of 7 kDa. The same molecular weight was determined from the trypsin inhibitor activity tracing on the chromatogram of soluble MSVS.
Direct analysis
of amino acid composition
(Table II)
indicated
that peak a protein
contained
no tryptophan
and only a small amount of tyrosine,
which accounts
for
the low absorbance
of this protein at 280 nm. The protein
was found to have a net excess of basic residues
which
could give rise to the slightly basic isoelectric
point. The
amino acid composition
data generated directly from the
analysis
of protein
were generally compatible
with the
putative mature protein derived from MP12 cDNA
(16).
It was of interest
to note that peak b protein,
which
showed no trypsin
inhibitory
activity,
shared with peak
a protein the same amino acid composition
(not shown).
Having measured the inhibitory
activity of peak a pro-
tein on the trypsin
digestion of N-benzoyl-Phe-Val-Arg
7-amido-4-methylcoumarin
in 2-100
pM(one case is
shown in Fig. 4A), we found that the K in Eq. [l] varied
with the substrate concentration.
This behavior indicated
that peak a protein inhibited
the trypsin
catalysis
com-
petitively
according to the explanation
of Dixon (23). The
plot based on Eq. [l] as shown in Fig. 4B gave Ki and K,,,
to be 0.15
nMand 50
pM,respectively.
Primary
Structure
of MSVS TI
More than one type of PI with different
molecular size
may exist in one organ of an animal. For instance,
two
types of PSTIs are present in porcine and rat pancreatic
juice (9, 28, 29). Rat PSTI-I
consists
of 61 and PSTI-II
of 56 amino acid residues (9). They are highly homologous
and show the same trypsin
inhibitory
activity
but have
different
physiological
functions.
These two inhibitors
originate
from different
genes, but their cDNAs
have
identical
5’-noncoding
regions
and nearly identical
3’-
noncoding regions (30, 31), suggesting that 5’-noncoding
regions as well as 3’-noncoding
regions of PSTI-related
cDNAs
of one organ may be highly conserved.
Having
this background
in mind, we amplified the cDNAs
of MSV
by PCR using oligonucleotides
corresponding
to 5’- and
3’-noncoding
region of MP12 as primer pair (see Exper-
imental section).
Fourteen
colonies containing
the am-
plified cDNAs
were identified
from the transformed
E.
coli strain DH5a.
The 14 cDNA
inserts
contained
the
same number of nucleotides
(309 bp) and showed the same
nucleotide
sequences, which confirmed
completely
those
in MP 12 cDNA
(369 bp). Apparently,
a PI mRNA
cor-
responding
to MP12 cDNA did express in MSV. The nu-
cleotide
sequences
of the amplified
cDNA
and MP12
cDNA
and the deduced amino acid sequence are shown
in Fig. 5. Further
analyses of peak a, b, and c proteins
purified
from HPLC
(Fig. 1) by direct determination
of
a portion of the primary
structure
were undertaken.
We
found no evidence of modification
of amino acid residues
during sequence analysis
from the results
of sequence
analysis.
Results
of amino
acid determinations
were
aligned with the cDNA-derived
sequence (Fig. 5).
Automated
Edman degradation of either peak a or peak
c protein (both were biologically
active) for 30 cycles gave
reliable data. The same amino acid was identified for the
TABLE II
Amino Acid Composition
ofMSVS TI
Amino acid mol (W) mol/mol of protein” Deduced value*
Asx 8.9 5.12 Glx 7.6 4.37 Ser 4.3 2.46 Thr 4.6 2.62 GUY 10.4 5.98 Ala 9.3 5.33 Arg 6.7 3.82 Pro 6.9 3.95 Val 8.6 4.91 Met 0.3 0.18 Ile 5.2 2.99 Leu 3.7 2.11 Trp 0.3 0.16 Phe 2.2 1.28 CYS 9.2” 5.28’ LYS 7.1 4.09 His 1.7 1.01 Tyr 2.8 1.63 57.29 6 4 2 57 n Average of four determinations based on a molecular weight of 7000 Da.
* Value derived from the MP12 cDNA sequence. ’ Three aspartic acid and two asparagine. d Four glutamic acid.
Inhibitor,
nM
B
I I
-50 0 50 100
Substrate,
uM
FIG. 4. Effect of MSVS TI on trypsin kinetics. (A) Trypsin at 1.0
nM and peak a protein (Fig. 1) were incubated at 25’C for 5 min before adding the substrate of N-benzoyl-Phe-Val-Arg 7-amido-4-methylcou- marin to a final concentration of 20 FM. The relative velocity was ex- pressed by using the velocity measured in the absence of inhibitor as 100%. (B) The plot of distance
K
vs substrate concentration according to Eq. [l].two proteins at each cycle, showing that they are the same
protein molecule. The amino acid determinations con-
firmed both Ala as the NH,-terminal
residue and the
reading frame of MP12 cDNA. The NH,-terminal
se-
quence analysis of peak b protein for 30 cycles gave re-
liable data also. Two predominant amino acids could be
detected at each of the first 19 cycles, and a single amino
acid could be detected at each of the last eleven cycles
(Table III). The actual yields of the two sequences in an
individual cycle were such that both components appeared
to be present in nearly equal amounts. One of the two
sequences could readily be interpreted as representing the
NH,-terminal sequence of peak a protein while the other
was found to be a new sequence, which confirmed residues
20-49 of the reading frame of MP12 cDNA. These data
along with the amino acid composition data suggested
that peak b protein was produced from the digestion by
the immobilized trypsin at the peptide bond of Argl’-IlezO
of peak a protein. In summary, 49 out of 57 amino acid
residues in the putative mature protein predicted from
MP12 cDNA were confirmed by direct protein analysis.
DISCUSSION
According to the alignment of homologous protease in-
hibitors (16), MSVS TI shows a high degree of sequence
similarity with the vertebrate Kazal-type PIs. Our results
suggest that one type of PI similar to rat PSTI-II is likely
to be translationally produced in MSV. We have not found
yet another type of PI similar to rat PSTI-I in MSV. The
vertebrate Kazal-type PIs may possess similar, although
not identical, main chain conformation (16). They give
“temporary
inhibition”
to the related proteinases by a
common mechanism (15, 32). In each inhibitor molecule
there exists on the surface one peptide bond, the reactive
site, which combines with the enzyme in a substrate-like
manner and serves as a substrate for the enzyme. In the
absence of tertiary
structure for MSVS TI, which was
shown to be a competitive inhibitor, we superimposed the
primary structure of this protein onto the three-dimen-
sional structure of porcine PST1 in the complex formed
by PST1 and trypsinogen (33) and made some educated
guesses. Residues from His” to Asp22 of MSVS TI may
be the primary origin which is involved in the major polar
interaction with trypsin, and the reactive site peptide bond
is apparently at Arg’g-Ile20. The basic sequence of Arg43-
Lys44-Arg45, which plays an important role in the regu-
lation of temporary inhibition according to the study of
TABLE III
The NH,-Terminal Sequence
Analysis
of Peak b Protein of Fig. 1A
Step Amino acids NH2 terminus of MSVS TI” New sequence 1 2 3 4 5 6 7 8 9 10 11 12 13 14 15 16 17 18 19 20 21 22 23 24 25 26 27 28 29 30 Ala, Ile LYS, Tyr Val, Asp Thr, Pro Gly, Val Lys - Glu, Gly Ala, Thr Ser, Asp - Gly His, Ile Asp, Thr Ala, Tyr Val, Ala Ala, Asn Gly, Glu Pro, Val Arg, Leu Phe Glu Asn Arg LYS Arg Ile Glu Pro Val Ala LYS Val Thr GUY LYS Glu Ala Ser His Asp Ala Val Ala GUY Pro Arg Ile Tyr ASP Pro Val GUY Thr Asp GUY Ile Ile ‘b Asp Pro Val Glr Thr Asp GUY Ile Thr Tw Ala Asn Glu Val Leu Phe Glu Asn k LYS Arg Ile Glu Pro Val ’ The NH,-terminal sequence analysis of peak a protein of Fig. 1A.
A
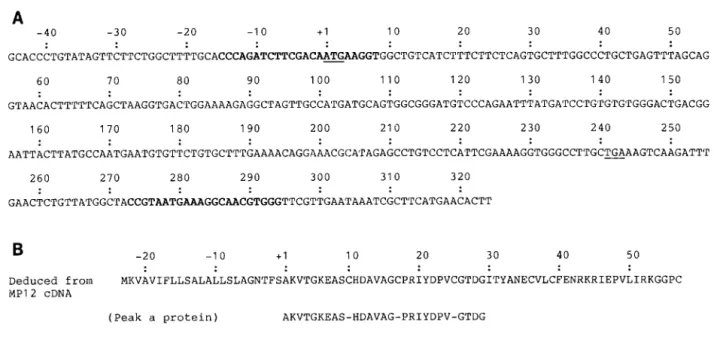
-40 -30 -20 -10 +l 10 20 30 40 50 GCACCCTGTATAGTTCTTCTGGCTTTTGCACCCAGATCTTCGAC~~~GGTGGCTG'rCATCTTTCTTCTCAGTGCTTTGGCCCTGCTGAGTTTAGCAG 60 70 80 90 100 110 120 130 140 150 GTAACACTTTTTCAGCTAAGGTGACTGGACTGGAAAAGAGGCTAGTTGCCA'rGATGCAGTGGCGGGATGTCCCAGAATTT~rGATC~r~r~rGTGGGACTGACGG 160 170 180 190 200 210 220 230 240 250 AATTACTTATGCCAATGAATGTGTTCTGTGCTTTGAAAACAGGAAACGC~rAGAGCCTGTCCTCATTCGAAAAGGTGGGCCT'rGC~AAGTCAAGATTT 260 270 280 290 300 310 320 GAACTCTGTTATGGCTACCGTAATGAAAGGCAACGTGGGTGGGTTCGTTGAATAAATCGCTTCATGAACACTTB
-20 -10 +I 10 20 30 40 50Deduced from ~KVAVIFLLSALALLSLAGNTFSAKVTGKEASCHDAVAGCPRIYDPVCGTDGITYANECVLCFENRKRIEPVLIRKGGPC MP12 cDNA
(Peak a protein) AKVTGKEAS-HDAVAG-PRIYDPV-GTDG
(New sequence deduced from Peak b protein) IYDPV-GTDGITYANE-VL-FENRKRIEPV
FIG. 5. (A) The nucleotide sequences of MP12 cDNA from Mills et al. (16). Bold characters indicate the primer pair used for PCR of this work and bars indicate the initial and stop codons of the open reading frame. (B) Comparison of amino acid sequences deduced from MP12 cDNA with those determined from Edman degradation of peak a and peak b proteins purified from HPLC shown in Fig. 1.
human PST1 (32), locates three-dimensionally
opposite
to the reactive site. The result of sequence analysis
for
peak b protein reveals that the immobilized trypsin
linked
to Affi-Gel 10 is able to digest only the bound inhibitor
at the reactive site but is inaccessible
to attack the basic
sequence. The peak b protein
is biologically
inactive,
which is contradictory
to previous
reports that one cleav-
age only at the reactive site of either porcine or bovine
PST1 did not result in their denaturation
(28, 34).
ently, post-translational
cleavage must be at the peptide
bond of Ser-Ala
in the signal peptide of MSVS TI and
at the peptide bond of Ala-Lys
in the signal peptide of
rat PSTI-II.
ACKNOWLEDGMENTS
Our results suggest that MSVS TI corresponds to MP12
cDNA. A question arises whether MSVS TI and P12 are
the same protein. The molecular size of a protein deduced
from MP12 cDNA should be smaller than that of P12
protein; note that the 80 amino-acid open reading frame
of the cDNAs should generate a primary translation
product of 9 kDa, which could decrease in size after re-
moval of the signal peptide to 7 kDa, which is the molec-
ular size of MSVS TI. Glycosylation of the 7-kDa core
protein to produce PI2 protein as suggested by Mills et
al. (16, 17) was not observed here. Perhaps glycosylation
of the P12 occurs only in the prostate, but not in the
seminal vesicle. Obviously, MSVS TI is different from
the P12 protein.
This work was partially supported by the National Science Council, Taiwan, Republic of China (Grant NSC-SO-0203-BOOl-05). Some of the work described in this paper forms part of a dissertation submitted by M.-L. Lai in partial fulfillment for the requirement of the degree of D.Sc. at National Taiwan University.
REFERENCES
1. Mann, T. (1964) The Biochemistry of Semen and of the Male Re- productive Tract, Wiley, New York.
2. Price, D., and Williams-Ashman, H. G. (1961) in Sex and Internal Secretion (Young, W. C., Ed.), 3rd ed., Vol 1, pp. 366-448, Williams & Wilkins, Baltimore.
3. Pang, S. F., Chow, P. H., and Wang, T. M. (1979) J. Reprod. Fertil. 56,129-132.
4. Peitz, B., and Olds-Clarke, P. (1986) Btil. Reprod. 35,608-617. 5. Ostrowski, M. C., Kistler, M. K., and Kistler, W. S. (1979) J. Bid.
Chem. 254,383-390.
The signal peptides of both MSVS TI and rat PSTI-II
have 23 amino acids, with sequences that are almost iden-
tical. While the NHz-terminal residue of rat PSTI-II
is
Lys, that of MSVS TI is Ala, which agrees with the sug-
gestion of Mills et al. (16) from analysis of MP12 cDNA
by a weight-matrix
method of von Heijne (35) for pre-
dicting the signal peptide sequence cleavage site. Appar-
6. Chen, Y. H., Pentecost, B. T., McLachlan, J. A., and Teng, C. T. (1987) Mol. Endocrinol. 1, 707-716.
7. Higgins, S. F., Burchell, J. M., and Mainwaring, I. P. (1976) Biochem. J. 158, 271-282.
8. Higgins, S. F., Colman, A., Fuller, F. M., and Jackson, P. J. (1981) Mol. Cell Endocrinol. 2 1, 255-262.
9. Uda, K. I., Ogawa, M., Shibata, T., Murata, A., Mori, T., Kikuchi, N., Yoshida, N. Tsunasawa, S., and Sakiyama, F. (1988) Bid. Chem. Hoppe-Seyler 369(Suppl), 55-61.
10. 11.
12.
13.
14.
15.16.
17.
18.
19.
20.
21.
Fink, E., and Fritz, H. (1976) in Methods in Enzymology (Jakoby, W. B., and Wilchek, M., Eds.), Vol. 46, pp. 825-833, Academic Press, San Diego.
Fritz, H., Tschesche, H., and Fink, E. (1976) in Methods in Enzy- mology (Jakoby, W. B., and Wilchek, M., Eds.), Vol. 46, pp. 834- 847, Academic Press, San Diego.
Meloun, B., Cechovi, D., and Jonhkova, V. (1984) Hoppe-Seykr’s Z. Physiol. Chem. Rd. 364(Suppl.), 1665-1670.
Tschesche, H., Wittig, B., Decker, G., Miiller-Esterl, W., and Fritz, H. (1982) Eur. J. Biochem.
126, 99-104.
Huhtala, M. L. (1984) Hoppe-Seyler’s 2. Physiol. Chem. Bd. 365(Suppl.), 819-825.
Cechovi, D., and Jonakovi, V. (1981) in Methods in Enzymology (Lorand, L., Ed.), Vol. 80, pp. 7922803, Academic Press, San Diego. Mills, J. S., Needham, M., and Parker, M. G. (1987) EMBO J. 6,
3711-3717.
Mills, J. S., Needham, M., Thompson, T. C., and Parker, M. G. (1987) Mol. Cell. Endocrinol. 53,
111-118.
Schlgger, H., and von Jagow, G. (1987) Anal. Biochem.
166, 368-
379.
Tsugita, A., Uchida, T., Mewes, H. W., and Ataka, T. (1987) J. Biochem.
102, 1593-1597.
Spackman, D. H., Stein, W. H., and Moore, S. (1958) Anal. Chem.
30,
1190-1206.Green, N. M., and Work, E. (1953) Biochem. J. 54, 347-352.
22.
23.
24.
25.
26.
27.
28.
29.30.
31.
32.
33.
34.
35.
Lottenberg, R., Christensen, U., Jackson, C. M., and Coleman, P. L. (1981) in Methods in Enzymology (Lorand, L., Ed.), Vol. 80, pp. 341-361, Academic Press, San Diego.
Dixon, M. (1972) Biochem. J.
129,
197-202.Greco, W. R., andHakala, M. T. (1979) J. Biol. Chem. 254,12,104- 12,109.
Maniatis, T., Fritsch, E. F., and Sambrook, J. (1989) Molecular Cloning: A Laboratory Manual. Cold Spring Harbor Laboratory Press, Cold Spring Harbor, NY.
Chung, C. T., Niemela, S. L., and Miller, R. H. (1989) Proc. Natl. Acad. Sci. USA 66, 2172-2175.
Tabor, S., and Richardson, C. C. (1987) Proc. Natl. Acad. Sci. USA
84,4767-4771.
Schneider, S. L., Stasiuk, L., and Laskowski, M., Sr. (1973) J. Biol. Chem. 248,
7207-7214.
Bartelt, D. C., and Greene, L. J. (1971) J. Biol. Chem. 246,
2218-
2229.
Horii, A., Tomita, N., Yokouchi, H., Doi, S., Uda, K., Ogawa, M., Mori, T., and Matsubara, K. (1989) Biochem. Biophys. Res. Commun. 162,X-159.
Hill, R. E., and Hastie, N. D. (1987) Nature 326, 96-99.
Kikuchi, N., Negata, K., Shin, M., Mitsushima, K., Teraoka, H., and Yoshida, N. (1989) J. Biochem.
106, 1059-1063.
Bolognesi, M., and Gatti, G. (1982) J. Mol. Biol.
162, 839-868.
Sealock, R. W., and Laskowski, M., Jr. (1973) Biochemistry
12,
3139-3146.