ProceediogsoftbeZnn3 IEEE loternational Coorerenee on Robotics 5 Automation
Taipei, Taiwan. September 14-19. 2003
Automatic
EMG
Feature Evaluation for Controlling a Prosthetic Hand Using a
Supervised Feature Mining Method: An Intelligent Approach
Han-Pang Huang',
Yi-Hung Liu",
and
Chun-Shin Wong"
Robotics Laboratory, Department of Mechanical Engineering National Taiwan University, Taipei, 10660, Taiwan TELIFAX: (886) 2-23633875, E-mail: hanpanp@,ntu.edu.hv *Professor and correspondence addressee, **Graduate student
Abstract
Electromyograph (EMG) has the properties of large variations and nonstationarity There are two issues in the classification of EMG signals. One is the feature selection, and the other is the classifier design. Subject to the first issue, we propose a supervised feature mining (SFM) method, which is an intelligent approach based on genetic algorithms (GAS), fuzzy measure, and domain knowledge on pattern recognition. The SFM can find the optimal EMG feature subset automatically and remove the redundant from a large amount of feature candidates without taking trial-and-error. In the experiments, all feature candidates and optimal feature subset are conducted to demonstrate the validity of the proposed SFM. Moreover, experimental results show that the optimal EMG feature subset obtained from SFM can obtain higher classification rates compared with using all feature candidates by
K-NN
method.Keywords: EMG classification, feature mining, genetic algorithms (GAS), fuzzy measure, self-organizing map.
1. Introduction
EMG classification is one of the most difficult pattern recognition problems because there usually exist large variations in EMG features. Especially, it is difficult to extract useful features from the residual muscles of
an
amputee. So far, many researches proposed many kinds of EMG features to classify postures and they showed good performance
[4][lO][l8][20][2][6].
However, how to select a feature subset with the best discrimination ability from those features is still an issue for classifying EMG signals. Hence, in this paper, we propose a supervised feature mining method (SFM) to deal with the problem.In
SFM, the intraclass and interclass ambiguities are measured by fuzzy entropy and index of fuzziness in multi-dimensional feature space. Then, a fuzzy- feature evaluation index (FFEI) is developed to give an overall measurement of separation and compactness of the class structure in the feature space. The central concept of the proposed SFM is to change the class structurein
the feature space according to the relative importance of features. By introducing a set of weighting factors to each feature, the class structure (is., the index FFEI) becomes a function of these factors in feature space. A weighting factor implies the relative importance of a feature. Hence, the genetic algorithm (GA) is performed to search the optimal weighting factor automatically. We can select theoptimal feature subset according to the weighting factors. The larger the value of the weighting factor is, the more important the feature is.
In this paper, we select eight kinds of different features that have been widely used to classify E M F signals as the feature candidates. They are integral of EMG (IEMG) [IO], waveform length (WL) [IO], variance (VAR) [16][2Oj, zero crossing (ZC) [10][2Oj, slope sign changes (SSC) [lo], Willison amplitude (WAMP) [18), autoregressive model (ARM) [18][6] and histogram of EMG (HEMG)
[IS],
respectively. Accordingly, we select eight kinds of frequently used prehensile postures to be classified. SFM can select optimal feature subset from these feature candidates automatically without taking trial-and-error. The process will be perfomzd on PC-based processes (off-line).The rest of this paper is organized as follows. Section
2
illustrates the equipment for the EMG acquisition. Furthermore, eight postures to he classified are selected.In
the later of this section, seven kinds of selected features candidates will he introduced. In Section 3, the detail of the proposed supervised feature mining method, SFM, isillustrated. Section 4 introduces the EMG classification briefly. Several experiments will he conducted in Section
5 . Finally, we have some conclusion remarks in Section 6.
2.
EMG
Feature Candidates and Extractions
Eight types of prehensile postures to
be
classified are selected in that they are typical postures of most frequent use for human beings. The eight postures are power grasp (PG). hook grasp (HG), wrist flexion (WF), lateral pinch (LP), flattened hand (FH), centralized grip (CEG), thwe-jaw chuck (TJC), and Cylindrical grasp (CYG), and they are listed in Table I .Table 1 Eight kinds of prehensile postures to be classified
I, i f x > o ( 5 ) s g n ( x ) =
i
0, otherwiseIn order to obtain meaningkl EMG signals for eight kinds of prehensile postures, the placement of EMG surface electrodes is important. According to the relations between the muscle location and the prehensile postures [12], the three EMG surface electrodes are placed on palmaris longus, extensor digitorum and flexor carpi ulnaris and therefore three channels are used (see Fig. 1).
where
E.
slope
sign
Changes (SSC)SSC counts the number of times the slope of the signal changes sign. Similarly, it needs to include a threshold to reduce the effect of noise induced by slope sign changes. Given three contiguous EMG signals emgk.,, emgk and
emg,,,, the number of slope sign changes increases if ( 6 ) (emsk
-
e m g k - , ) x (emgk - e m g k + l ) 2 0.03f o r k = 2,.. ., N - 1
F. Willison Amplitude (WAMP)
WAMP is the number of counts for each change of the EMG signal amplitude that exceeds a defined threshold. It can indicate the muscle contraction level as given by
N-I
Pelman* Impus X f l e T k -emgk+ll)
(7) k=l
Fig. 1. The placements of EMG surface electrodes
, i f x > O . 3 The eight postures generate different EMG signals with
. .
-
-
where f ( x ) = {I 0, otherwise various characteristics. In this paper, seven kinds offeatures to he evaluated are selected as follows. A. Integral of EMG (IEMG)
value of the EMG signal. It is given by
G. Autoregressive Model (ARM)
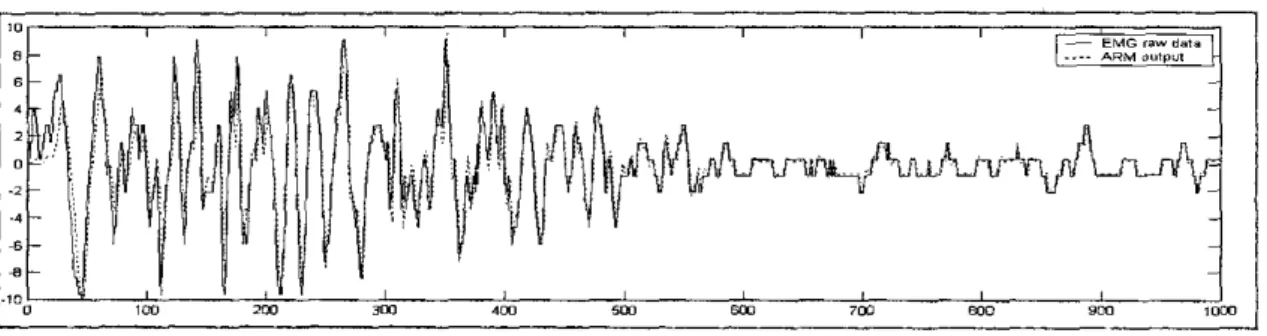
It is difficult to analyze the EMG signal because of its nature of nonlinearity and nonstationarity. However, in a short time period the EMG signal can he regarded as a stationary Gaussian process and can he represented by an autoregressive model (ARM). ARM is used to identify the EMG time series as
IEMG is an estimate of the summation of absolute 1 ”
IEMG = - x i e m g , l ( I )
k=l
where emgi is the kth sample data out of N samples of EMG raw data.
B. Waveform Length (WL)
WL is a cumulative variation of the EMG that can indicate the degree of variation ahout the EMG signal. It is given by 1v-, WL =
CI
emgk+] -emgxI
(2) *=I C. Variance (VAR) signal as given byVAR is a measure of the power density of the EMG
D. Zero Crossing (ZC)
ZC counts the number of times that the signal crosses zero. A threshold needs to he introduced to reduce the noise induced at zero crossing. Given two contiguous EMG signals emgx and emgk,,, the ZC can he calculated as N-I ZC= C[sgn(-emgk xemgk+l)nlemgk - e m g k + l l > ~ . ~ 2 ] k=l (4) M yk = -Caiemgk-; + wk (8) i=l
where yk is the !ith output of ARM and emgk.jis the (k-i)th sample data out of N samples of EMG raw data. M is the
order of ARM, ai are the estimate of the ARM parameters and wk is the white noise. The ARM parameters ai can he calculated via the adaptive least mean square (LMS) method and thus we have
a,(n+ I) = ai(n)-2pe(n)emg(n-i) f o r i = I...M (9)
where ai(n) is the original ARM parameter,
p
is a constant rate of convergence and e(n) is the difference between the nth sample data of EMG raw data and the nth output of ARM. Hence, we can update thenew ARM
parameter by Eqn.(9). A model order of 4 is adequate for AR time series modeling of EMG signal. Thus, an ARM contains four feature components. The simulation of the original EMG signal using a fourth-order AR model is shown in Fig. 2.
H. Histogram of EMG (HEMG)
HEMG is the extension of the ZC and WAMP. It counts how many samples in the particular voltage range and provides the information ahout the frequency which the EMG signals reach multiple amplitude levels. Similar to the setting in [IB], the voltage range [-IO, +lo] is divided into nine equivalent intervals and the counts in each voltage interval will be multiplied by 0.01. AHEMG contains nine feature components.
Fig. 2. The simulation of the original EMG signal using a fourth-order AR model
3. Supervised Features Mining (SFM)
feature mining (SFM) for EMG features in details.
3.1 Compactness index
Suppose that there are I classes ( C
,..._,
C, ,_.., C, ) to be classified, and each class hasp patterns. The feature space is an n-dimensional feature space F =( 4 ,
...,
F,).
The distance between a pattern Fj EC, and its corresponding mean in class C, is defined as the normalized Euclidean distanceIn this section, we introduce the proposed supervised
where
Note that mkj denotes the mean of class C, along the ith feature axis, and a,, is a normalization factor, in which N I is a positive number so that the value of d,(Fj) would lie in the interval [0, 0.51, and p is the class size. Since the normalized Euclidean distance for a pattern Fj E C, to the mean has been defined, one can
use the semi--IT membership function to compute the intraclass ambiguity using the fuzzy entropy 1171
where S,(.) is the Shannon function and can be expressed as
The multi-dimensional semi --IT membership function is defined as
& ( A x ) ) = - P ( x ) h 4 x )
-U
- d x ) ) W
-d4)
(13)monotonically as the value of dk(Fj) decreases monotonically in the same interval. Hence, if most of the patterns are clustered around the center, then the value of the index H , would he low. In such a case, the compactness of these patterns
Fj
E C,, j = l,2, ....,p ishigh. On the other hand, if the value of the index H , is high, then the compactness of the intraclass set is low. That means the patterns are far from the center. The compacmess index H, stands for the intraclass ambiguity for all patterns F t C, to class C,
.
3.2
Separation indexSimilar to definitions in the measme of intraclass ambiguity, some definitions are modified for the measure of the interclass ambiguity. Let mkhc be the center of classes C, and C,. along the ith feature axis, k ;e k',
k , k ' = l,Z, ..., 1 , the normalized Euclidean distance between the pattern and the center of the two classes C, and C,. isdefinedas
where factor
a,,,
is the normalization factor such that the value of dkk.(Fi) would lie in the interval 10, 0.51and
N,
is a positive real number. The interclass ambiguity between two classes can he obtained by computing the index of fuzziness (Kaufmann entropy) [ I l l for all patterns in the given two classes. Namely, we haveIt is noted that if dk(Fj) = O , then Hi, = O , and if d,(Fj) 2 0.5, then H, = 1 , in case o f p = l . The value of the index Hh increases monotonically as the value of d,(Fj) increases monotonically in the interval [0, O S ] .
On the other hand, the value of the index Hh decreases
where F,"' t C,.
.
From the aboveequation, the index of fuzziness yw has the minimum ( y,,. = 0 ) as the value of d w ( F ) equals to zero, and
y E . has the maximum ( ykk. = I ) as the value of d,,.(F) = 0.5. If most of the patterns F E C, U C,. are
F," EC, and
embedded into the module. Also, for obtaining meaningful EMG signals, a 30-400 Hz. band pass filter is also embedded. The above are developed with the assembly language of TMS320C31. The output of classifier indicates which posture should he executed and the
DSP
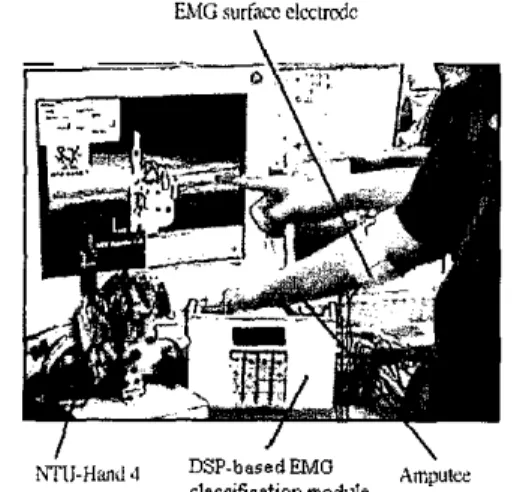
will send the command to the prosthetic hand, NTU-Hand 4. NTU-Hand 4 is a five fingered prosthetic hand with I I degree of freedom (DOF) (see Fig. 4). When receiving the postnre command, the NTU-Hand 4 will generate the actual posture output.EMC surhcc clcclmlc
h4,-Hand4 DSP-basedEMG AIn\"tee
cla~slfication module
Fig. 4 EMG classification system and NTU-Hand 4
5.
Experimental Results
For finding the optimal feature subset for EMG signal classification by using the proposed SFM, we prepare some EMG training data for the evaluation. Each class has 20 training patterns and each panern contains eight kinds of features to be evaluated. The first six features are scalar, while the last
two,
ARM and HEMG are feature vectors. An ARM feature is a 4-D vector and a HEMG feature is a 9-D vector. In order to transform these two kinds of feature vectors to scalars (winners), we perform two I-D Kohonen's self-organizing maps (SOMs) [I31 to find their respective feature axes. Some parameters in our SOMs are3) Learning rate: initial value is 0.9 and i s updated by
~ ( r )
= 0.9exp(--) f200
Hereafter, it will decrease gradually, hut we set its minimum value at 0.01
All the 20 ARM and HEMG features are fed into the two I-D SOMs to learn weight vectors. The learning is stopped when the mean square error (MSE) almost keeps at a small constant. Finally, all 4-D ARM features can he represented by their corresponding 1-D winners on the output nodes, and all 9-D HEMG features can be represeuted by I-D winners, too.
Since all training patterns are prepared well, the next step is to perform SFM to find the relative importance of the eight features. Before using CA to minimize the index FFEI, some CA operations should he set first. All weighting factors are randomized in [0,1] initially, and then encoded to hinaly IO-bit strings (chromosomes). Therefore, the resolution of a weighting factor is 1024 in [O,l] such that the relative importance can he obtained more precisely. Some other operations are listed in Table 2. Besides. a roulette wheel selection is used as the evolution operation. The fitness function is defined as the inverse of the index FFEI, and the cost of each generation is defined as the summation of values of index FFEI of all populations in a generation. A genetic algorithm search with 400 generations is called a run. There are three runs in OUT experiment such that the results can he compared
objectively. Finally, optimal weighting factors and ranks of the three runs are listed in Table 3. The generation-cost diagram of the first nu is shown in Fig. 5. These weighting factors are determined when the convergence cuwe keeps at a constant. The rank of a feature is determined by its corresponding weighting factor, w , i.e., the relative importance.
Table 2. CA operations setting in the experiment
rate rate point size
String length Crossover Mutation Crossover Population
IO-bit binary I 0.05 Randomly 80
set as follows. chromosome search
I ) The numbers of output nodes are 100. Numbers of input nodes are 4 and 9, respectively.
2) Neighborhood size: initial value is 100 and is shrunk 36
1 33
29
by
PI
( 1 ) = ~xP(--
where di.y, is the lateral distance between winner y , and excited neuron j in the I-D output space, and a(t) isdefinedas
1
20010g100Therefore, as time I increases, the width a(t) 28
decreases at an exponential rate, and the topological neighborhood shrinks in a corresponding manner.
I a(f) = 100exp(-
0 50 100 150 200 250 300 350 400
GensrallOnS
Fig. 5 . Generation-cost diagram: using CA to minimize
224
FFEI subject to the weighting set. (The first run)
As a result, one can see that the features ARM and HEMG are the best two features in the three runs. It is worth noting that the weighting factors are not the same in each run. It may he due to the initial populations in GA generated randomly. However, the ranking levels in the three runs are nearly the same. There exists a great difference in the values of weighting Factors between the two features, ARM and HEMG, and the other six features. Especially, the relative importance of features ARM and HEMG are nearly equal to each other. Also, the four features, VR, ZC, SSC, and WAMP, are quite had because their weighting factors are quite small. The IEMG and WL occupy ambiguous positions because their respective weighting factors are in a middle region in contrast with others.
Table 3. Optimal weighting factors and ranks of features
The fin1 run The second run The third run Rank Rank Rank IEMG 0.2107 3 0.2997 3 0.2321 4 WL 0.21134 4 0.2330 4 0.3405 3 VR U . I ~ 5 0.0544 5 o.innn 6
ssc
0.1020 6 0.0243 7 0.1458 5 ARM 0.5766 2 0.7124 2 0.70ui I HEMG 0.8745 I 0.7665 1 0.6790 2Table 4. Comparison of classification rates among
ZC 0.0550 7 0.0455 6 0.0787 7
WAMP 0.0289 8 0.0233 8 0.0122 8
f
i
PG HG WF LP FH CEG TIC CYG
IEMG 5 5 70 90 75 70 ss 45 80 WL 45 60 IOU 8 s 70 60 65 75 VR 40 68 95 95 85 45 50 80 ZC 35 60 100 90 60 65 25 40
ssc
60 50 in0 80 85 70 45 70 ARM 90 85 95 inn 75 75 70 75 WAMP 40 35 100 65 50 55 45 45 HEMG 80 95 100 80 100 75 95 80Table 5. Average classification rates of different features of EMG data by K-NN classifier (%)
IEMG WL VR ZC SSC WAMP A R M HEMG 67.5 70 65.63 59.38 70 54.38 83.13 88.13
So far, we have found out the feature subset (ARM, HEMG) with higher ranking, and the feature subset {IEMG, WL, VR, ZC, SSC, WAMP) with lower ranking by the SFM. In order to demonstrate the validity of the ranking from the SFM, the k-nearest neighbor (K-NN) algorithm [I31 is used as the classifier to obtain the classification rates for individual features. For avoiding the existence of a tie, the k is set as an odd value,
&S.
The classification results for different postures are listed in Table 4. The average classification rates are listed in Table5 . From the results in Table 4, we can find that the features ARM and HEMG obtain high classification rates for all postures especially for HEMG The classification rates of all postures are above 80%. On the other hand, the other six features get lower classification rates except for
the third posture, the wrist flexion. From the classification results in Table 5 , we can find that the features ARM and HEMG get higher average classification rates than others.
6. Conclusions
In this paper, we propose a method (SFM) for solving the automatic feature selection from a large amount of EMG features, which had been used before. SFM found that the two features, forth-order auroregressive model (ARM) and histogram o f E M C signals (HEMG), are the
better two Features for the EMG classification than others (for the eight kinds of prehensile postures). In the experiments, some classification results based on K-NN method verify the validity of feature ranking results obtained from SFM.
References
[I1
[Z]
J. Basak, R. K. De, and S . K. Pal, "Fuzzy feature evaluation index and connectionist realization-11: Theoretical analysis," Infinnation Science, vol. 111, ppl-17, 1998.
F. H. Y. Chan, Y. S. Yang, F. K. Lam, Y. T. Zhang, and P. A. Parker, "Fuzzy EMG classification for prosthesis CMUUI," IEEE Transactions on Rehobilitcltion Engineering, vol. 8, no. 3, pp. C. Y. Chung, "DSP-Based controller far a multi-degree prosthetic hand," Master Thesis, Department of Mechanical Engineering, National Taiwan University, Taiwan, ROC.,1999.
K. Englehan, B. Hudgin, and P. A. Parker, "A wavelet-based
continuous classification scheme for multifunction myoelectric
conuol," IEEE Tr~nsactiom on Biomedical Engineering, vol. 48, na.3.pp.302-311,Mar2001.
[SI Mitsuo Gen, and Runwei Cheng, Genetic Algorithms & Engineering Design, John Wiley & Sans, Inc. 1997.
I61 D. Graupe, J. Magnussen and A.A. M. Been, "A microprocessor
system for multifunctional control of upper-limb prosthesis via myoelectric signal identification," IEEE Transactions on Auromoiic Conlml, ~ 0 1 . 2 3 , no. 4, pp. 538.544. 1978
[7] Simon Haykin, Neural Networks: R Comprehensive Foundation,
Prentice-Hall, New Jersey, 1999.
[8] D. M. Himmelblau, AppliedNonlinear Pmgromming, New York
McGrawHill, 1976.
[9l H. P. Huang: and Y. H. Liu, "A GA-based f u z y feature evaluation algorithm for panern recognition," in Pmc. of& IOth
IEEEIM C m z on F u z q Systems, vol. 2, pp. 833-836,2001 [lo] B. Hudgins, P. Parker, and R. N. Scott, "New strategy for
multi-function myoelectric ~ontrol," IEEE Tronsocrions on Biomedicol En@neering, vol. 40, no. 1 , pp. 82-94, Jan. 1993. [ I l l A. KaufmaM, and M. Gupta, Introduction to/i(iq arithmetic:
thmv and opplicotions, New York Van Nostrand Reinhold Co.,
305.311,
sep.
2000.[3]
[4]
to*=.
I , " _ .
F. P. Kendall, E. K. M c C r e q and P, G. Provance, Muscles
Testing and Function: x,ith Poshm and Pam, Baltimore, Md.: Williams & Wilkins, 1993.
1. M. Killer, M. R. Gray, and I. A. Givens. JR., "A fuzzy
k-nearest neighbor algorilhm," IEEE Tranroclions on Sj~srems, Man. andCybernerics. vol. 15, no. 4, pp. 580-585, 1986.
T. Kohanen, "The self-organizing map," Proc. IEEE, vol. 78, no.
9, pp. 1464-1480,1990.
P. J. M. van Laarhoven, and E. H. L. Aans, SimulmedAmealing: Theov and Applicationr, Published by D. Reidel Publishing
Company, 1987.
H.P. Huang, C.Y. Chen, "Development of a Myoelectric
Discrimination System for a Multi-Degree Prosthetic Hand," I999 IEEE Infl. Co-5 On Roboticr and A~tomotion, Detroit,
USA, May 10-15, 1999, pp.2392-2397.
A. D. Luca and S Termini, "A definition of non probabilistic entropy in the Setting of fuzzy ret theory," In/ormafion and
Z. K. Mahyar, W. C. Bruce, B. Kambir and M. H. Reza, "EMG feature evaluation for movement control of upper extremity prostheses," IEEE Tronsoclions on Rehobilitorion Engineering, vol. 3, no. 4. pp. 324-333,Dec 1995.
S. K. Pal, J. Basak and R. K. De, "Fuuy feahxe evaluation index and COMeCliOniSf realization," Informotion Science, vol.
105, pp173-188, 1998.
G N. Saiidis and T. P. Gootee, "EMG panern analysis and classification for a prosthetic am,.( IEEE Transactions on Biomedicol Engineering, vol. BME-29, no. 6, pp. 403412, 1982.