Modeling the Degr ee of Cur r ency Misalignment ar ound the
Asian Financial Cr isis: Evidence fr om Taiwan and Kor ea’s
Non-deliver y For war d Exchange Mar kets
*Yuan-chen Chang
**Associate Professor, Department of Finance, National Chengchi University
Chung-hua Shen
Professor, Department of Money and Banking,
National Chengchi University
ABSTRACT
This paper investigates the degree of currency misalignment in Taiwan and Korea around the Asian financial crisis. We calculate the implicit NTD/USD and WON/USD spot exchange rates from their observed non-delivery forward rates and measure the degree of currency misalignment as the difference between the implied and observed spot exchange rates. Our presumption is that during a financial crisis, non-delivery forward rates reflect market sentiments more closely than spot and forward rates. We calculate the probability for each currency in different states using our measures for currency misalignments and find that the persistence of large misalignment of the WON/USD is longer than that of the NTD/USD during the Asian financial crisis period. Our model of currency misalignment can be applied to forecast the occurrence of large exchange rate adjustments during a financial crisis.
Key wor ds:
Asian Financial Crisis, Exchange Rates, NDFⅠ. Introduction
The purpose of this paper is to model the degree of currency misalignment of the NTD/USD and WON/USD1 rates around the Asian financial crisis. There are a few different approaches to measure currency misalignment in the literature (Edward, 1994, Williamson, 1994, Chinn, 1998, and Park and Rhee, 2000). Park and Rhee (2000) propose a method to measure currency misalignment based on covered interest rate parity. Using no-arbitrage conditions for forward exchange rates, they calculate the spot exchange rates that are implied from the observed WON/USD forward exchange rates. They define currency misalignment as the differences between implied and observed spot rates. Their results show that the
WON/USD
*
We wish to thank participants in the Taiwan Finance Association conference (2002) and an anonymous referee for valuable comments and suggestions.
** Corresponding author, Tel: (02)29393091~81102. [email protected]
1 The NTD/USD and WON/USD rates are expressed as the units of the New Taiwan dollar
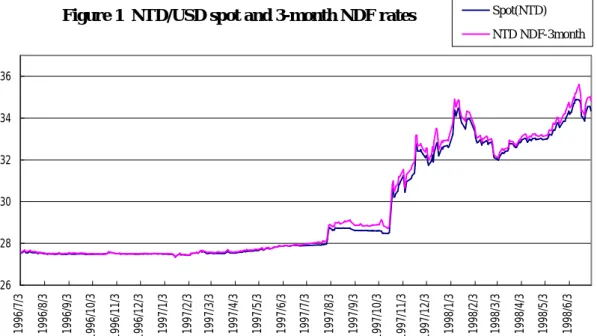
Figur e 1 NTD/USD spot and 3-month NDF r ates 26 28 30 32 34 36 1996/7/3 1996/8/3 1996/9/3 1996/10/3 1996/11/3 1996/12/3 1997/1/3 1997/2/3 1997/3/3 1997/4/3 1997/5/3 1997/6/3 1997/7/3 1997/8/3 1997/9/3 1997/10/3 1997/11/3 1997/12/3 1998/1/3 1998/2/3 1998/3/3 1998/4/3 1998/5/3 1998/6/3 Spot(NTD) NTD NDF-3month
rate
was overvalued before the Asian financial crisis but was significantly undervalued between Oct/1997 to Dec./1997. Unlike the crisis in Taiwan, Korea’s crisis originated in its excessive debt financing and limited foreign reserves; therefore, we might find different patterns of currency misalignments in Taiwan’s market.Using the non-delivery forward (NDF) rates, we calculate the misalignment for both currencies and compare their patterns during the Asian financial crisis. The NDFs are currency derivatives that allow market participants to hedge exchange rate exposure when the forward exchange market is not accessible due to government restrictions. Two of the biggest Asian NDF markets are the WON/USD and the NTD/USD, with daily transactions close to US$250 millions for the
WON/USD
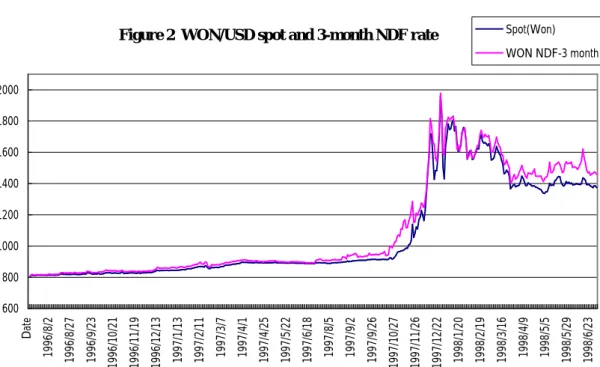
and US$150 million for the NTD/USD in 1997 (Park and Rhee, 2000). During the Asian financial crisis, both Bank of Korea and Central Bank of China actively intervened in the domestic spot and forward exchange markets, therefore, it will be difficult to identify the equilibrium exchange rates using forward rates that would prevailed had the government not intervened in these markets.To circumvent the effect of central bank intervention in Taiwan and Korea’s exchange rate markets, we use NDF (non-delivery forward) rates, which are traded, in the offshore foreign exchange markets. Since NDF settlements at maturity are made in US dollars and no local currencies change hands, their prices were less affected by the intervention of central banks. The relationship between the NDF rates and spot rates in both markets during the sample period can be seen from Figures 1 and 2. It shows in Figure 1 that the NDF rates in Taiwan’s market move closely with the spot rate from July/1996 to July/1997. From August/1997 onwards, the NDF rates in Taiwan’s markets began to deviate from the spot rates. Similar patterns can be seen for the Korean won NDF rates in Figure 2. The NDF rates in both markets were higher than the spot rates in the second half of the sample period, which indicate that market was anticipating a depreciation of both currencies.
To investigate the misalignments of both currencies during the sample period, we calculate the implicit NTD/USD and WON/USD spot rates from their observed non-delivery forward rates. Following Park and Rhee (2000), we define the differences between implied and observed spot rates as our measures for currency misalignments. A regime-switching model (Hamilton, 1989) was applied to capture the dynamics of misalignments for each currency. Using our measures for currency misalignment, we show that both the NTD/USD and
WON/USD
rates were undervalued in the beginning of the Asian financial crisis. Besides, the persistence of misalignment of the WON/USD is longer than that of the NTD/USD during the Asian financial crisis. The specification in this paper is a natural framework for assessing the occurrence of large exchange rate adjustments during the financial crisis.This paper is organized as follows. Section 2 describes the data and currency misalignment measure. Section 3 discusses regime-switching model. Section 4 presents the empirical evidence and section 4 concludes the paper.
Ⅱ. Data and cur rency misalignment measure
2.1 Relevance of the data and char acter istics of the exchange r atesThe data used in this study consists of daily spot NTD/USD and WON/USD rates, three-month non-delivery forward (NDF) swap rates, three-month WON denominated CD (certificate of deposites) rates, NTD denominated CP (commercial paper) rates and USD three-month Treasury bill rates. We did not adjust the covered interest parity using the yield spreads suggested by Park and Rhee (2001)
Figur e 2 WON/USD spot and 3-month NDF r ate
600 800 1000 1200 1400 1600 1800 2000 Date 1996/8/2 1996/8/27 1996/9/23 1996/10/21 1996/11/19 1996/12/13 1997/1/13 1997/2/11 1997/3/7 1997/4/1 1997/4/25 1997/5/22 1997/6/18 1997/8/5 1997/9/2 1997/9/26 1997/10/27 1997/11/26 1997/12/22 1998/1/20 1998/2/19 1998/3/16 1998/4/9 1998/5/5 1998/5/29 1998/6/23 Spot(Won) WON NDF-3 month
because dollar denominated Korean won CD rates are not available to us. The sample period is from 03/July/1996 to 26/June/1998. The daily spot NTD/USD rates and NDF quotations from the Taipei branches of Citi bank (CITI), were obtained from the Bridges Inc. Taipei. Three-month NTD denominated CP rates and USD three-month Treasury bill rates were retrieved from the Taiwan Economic Journal. The daily spot WON/USD and WON denominated CD rates were obtained from the website of Bank of Korea and WON/USD NDF rates were provided by J.P. Morgan.
Summary statistics of the NTD/USD and WON/USD exchange rates and interest rates are provided in Table 1. Panel A in Table 1 shows that the sample means of the spot NTD/USD and WON/USD rates are 29.65 and 1067.33 respectively. The sample means of the 3-month NDF rates for both currencies are slightly higher than those of spot rates, which indicate that market participants were expecting an appreciation of NTD/USD and WON/USD during the sample period. It is seen that the WON denominated 3-month interest rate was much volatile than that of the NTD denominated interest rates. The sample mean of the WON denominated interest rate is 15.46% with the standard deviation of 3.64% and the maximum value of 25%. On the other hand, the sample mean and standard deviation of the NTD/USD interest rate are 6.97% and 1.23%, respectively. It indicates that the money market in Korea was affected by the crisis more severely than that in Taiwan’s market because of the tight macroeconomic adjustment program requested by IMF in Korea. There were some missing values (38 observations) for the NTD/USD NDF rates quoted by the Citi bank during the sample period. We replaced the missing values with the averages of NDF quotations from the ABN AMRO, Bank of America and Standard Charter banks. We also deleted quotations on Saturday for the NTD rates and quotations on holidays in both countries and the remaining sample consists of 447 observations for both currencies.
2.2 Misalignments of the NTD/USD and WON/USD exchange r ates
T
here are a few different approaches to measure currency misalignment in the literature (Edward, 1994, Williamson, 1994, Chinn, 1998, and Park and Rhee, 2000). It can be measured by formal macroeconomic models of exchange rate determination or current account sustainability (Chinn, 1998). Park and Rhee (2000) propose a method to measure currency misalignment based on covered interest rate parity. Using no-arbitrage conditions for forward exchange rates, they calculate the spot exchange rates that are implied from the observed WON/USD forward exchange rates. They define currency misalignment as the differences between implied and observed spot rates and their results show that theWON/USD
was undervalued before the Asian financial crisis but became overvalued at the end of 1997. However, they do not provide formal modeling of the patterns of currency misalignment, which could have important implications for assessing the probability of large exchange rate adjustments during financial crisis.In this paper, we extend their study by modeling currency misalignment using a regime-switching model. Furthermore, we compare the patterns of currency misalignment of the NTD/USD with those of the WON/USD rates during the sample period. We calculate the implied spot rate from the covered interest rate
parity based on the NDF of the NTD/USD and WON/USD rates. The implied spot rate has the value:
T t D USD t
F
T
i
T
i
S
* ,]
)
360
/
(
1
)
360
/
(
1
[
⋅
+
+
=
(1) * tS
is the implied spot rate, which satisfies the covered interest rate parity by treating the NDF rates and interest rates as exogenous.i
USD is the 3 month (T= 90) US Treasury Bill rate andi
D is 3 month WON-denominated CD interest rate or NTD-denominated CP interest rate. We define currency misalignment (yt) as thelog difference between the implied spot rate and observed spot rate multiplied by 100. If
y
t>
0
, the observed spot exchange rate is lower than the level that participants in the NDF market expect to prevail and it indicates thatWON/USD
or NTD/USD is undervalued. 100 * )] ln( ) [ln( * t t tS
S
y
= − (2) Table 1 Summar y statistics of exchange r ates and inter est r atesPanel A: NTD_SP NTD_3F WON_SP WON_3F i_NT i_WON i_USD
Mean 29.65 29.80 1067.33 1103.40 6.97 15.46 5.04 Std 2.58 2.69 302.34 322.81 1.23 3.64 0.096 Min 27.34 27.35 805.80 809.58 5.00 11.3 4.79 Max 34.90 35.62 1960.00 1977.75 11.00 25.00 5.31 Sample size 447 447 447 447 447 447 447
Panel B: NTD_ misalignment WON_misalignment
Mean -0.0045 0.4860 Std error of mean 0.0151 0.1391 Std 0.3195 2.9400 Min -0.689 -6.78 Max 1.628 15.46 Sample size 447 447
Notes: NTD_SP and NTD_3F represent NTD/USD spot and 3 month forward NDF rates. WON_SP and WON_3F represent WON/USD spot and 3 month forward NDF rates. i_NT, i_WON, and i_USD are multiplied by 100 and represent NTD 3 month commercial paper rates, WON 3 month CD rates and USD 3 month T-Bill rates respectively. NTD_misalignment and WON_misalignment,
y
t, represents log-difference between implied spot rate and observed spot rate for NTD/USD and WON/USD.Summary statistics of currency misalignment are reported in Panel B of Table 1. The sample mean of the NTD/USD misalignment is –0.0045 with standard error of sample mean equal to 0.015. The sample mean of the WON/USD misalignment is 0.486 with standard error of sample mean equal to 0.139. The null hypothesis of zero sample means can be rejected for the WON/USD misalignment at the one percentage level but it cannot be rejected for the NTD/USD misalignment. It indicates that the misalignment of the WON/USD rate deviates from zero during the sample period. The standard deviation of the NTD/USD (0.31) rate is smaller than
that of the WON/USD rate (2.94). We will discuss the implications of these misalignments in section IV.
Ⅲ. Methodology
To compare the magnitude and persistent of misalignments around the Asian financial crisis, we apply a regime-switching model to the misalignment of both currencies in this section. This specification involves,
y
t, the measurement of currency misalignment, which is calculated as the log difference between the implied spot rate and observed spot rate. The model suggests the interpretation of the misalignment process following two states. State 1 (denoted by large misalignment) is the state where exchange rate misalignment is characterized by large swings and variance is high. State 2 is the usual state where the misalignment is close to zero with a relatively small variance.We assume the misalignment is governed by an unobserved state variable,
s
t, that takes on the value one or two when the observed change in the exchange rate is drawn from aN
(
µ
1,
σ
12)
orN
(
µ
2,
σ
22)
, respectively. Following Hamiltion (1989), we postulate that the unobservable state variable evolves as a Markov chain. This implies that the current regime,s
t, only depends on the regime one period ago. Whens
t= 1, the observed change in the currency misalignment is assumed to be drawn from aN
(
µ
1,
σ
12)
distribution. Whens
t=2,y
tis distributedN
(
µ
2,
σ
22)
. The transition probability of moving from one state to the other is as follows,Pr( s
t= 1 | s
t-1= 1 ) = p
11Pr( s
t= 2 | s
t-1= 1 ) = 1 - p
11Pr( s
t= 1 | s
t-1= 2 ) = 1 - p
22(3)
Pr( s
t= 2 | s
t-1= 2 ) = p
22This model allows us to examine the regimes of currency misalignment and test whether they are independent of the regime that prevailed last period. The inference about the value of st for a single date t can be obtained by summing
together the relevant joint probability. Maximum likelihood estimation of this regime-switching model can be obtained following the method proposed by Hamilton (1989).
Ⅳ. Empir ical results
Maximum likelihood estimates of parameters for the misalignment are summarized in Table 2. In the regime represented by state 1, the mean value of the misalignment for NTD/USD rate is 0.4269, which is much higher than the mean value of the misalignment in state 2 (-0.1476). The negative value of the misalignment in state 2 indicates that NTD/USD is overvalued in this period. It is seen that each regime is highly persistent for the NTD/USD rate as shown by the large value of P11 (0.9737) and P22 (0.9899). The probability that large
misalignment (denoted by state 1) of NTD/USD rate will be followed by another day of large misalignment is 0.9737. The persistent periods of NTD/USD rate in this regime are around 38 days (1/(1- P11)). The probability that small misalignment
(denoted by state 2) of NTD/USD rate will be followed by another day of small misalignment is 0.9899, so that this regime persists on average around 100 days.
The probability that large misalignment (denoted by state 1) of WON/USD rates will be followed by another day of large misalignment is 0.9785. It can be seen that this probability is higher than that of the NTD/USD rates. The persistent periods of WON/USD rates in this regime are close to 47 days (1/(1- P11 )), which
indicates that the Korean currency market was affected by the Asian financial crisis longer than that in Taiwan. The probability that small misalignment (denoted by state 2) of WON/USD rate will be followed by another day of small misalignment is 0.9863, so that this regime persists on average around 73 days.
Table 2: Par ameter estimates of the r egime-switching model.
Par ameter NTD/USD WON/USD
1 µ 0.4269 (0.0356) 2.4006 (0.3196) 2 µ -0.1476(0.009) (0.0427)-0.6348 11 P (0.0174)0.9737 (0.0171)0.9785 22 P 0.9899 (0.0059) 0.9863 (0.01001)
Notes: Currency misalignment represents log-difference between implied spot rate and observed spot rate for NTD and WON dollar. Standard errors are in parenthesis. µ1 is the sample mean in state 1 (crisis period) and µ2 is the sample mean in state 2. P11 is the probability of state 1 given the previous the previous misalignment is in state 1 and P22 is the probability of state 2 given the previous misalignment is in state 2
Figur e 3: NTD_Misalignments -1 -0.5 0 0.5 1 1.5 2 1996/7/3 1996/8/3 1996/9/3 1996/10/3 1996/11/3 1996/12/3 1997/1/3 1997/2/3 1997/3/3 1997/4/3 1997/5/3 1997/6/3 1997/7/3 1997/8/3 1997/9/3 1997/10/3 1997/11/3 1997/12/3 1998/1/3 1998/2/3 1998/3/3 1998/4/3 1998/5/3 1998/6/3 Date Misalignments
Figur e 4:WON_Misalignments -10 -5 0 5 10 15 20 1996/7/3 1996/8/3 1996/9/3 1996/10/3 1996/11/3 1996/12/3 1997/1/3 1997/2/3 1997/3/3 1997/4/3 1997/5/3 1997/6/3 1997/7/3 1997/8/3 1997/9/3 1997/10/3 1997/11/3 1997/12/3 1998/1/3 1998/2/3 1998/3/3 1998/4/3 1998/5/3 1998/6/3 Date Misalignments
Figur e 5: NTD smoothing Pr obability
0 0.2 0.4 0.6 0.8 1 1.2 Date 1996/8/2 1996/8/27 1996/9/23 1996/10/21 1996/11/19 1996/12/13 1997/1/13 1997/2/11 1997/3/7 1997/4/1 1997/4/25 1997/5/22 1997/6/18 1997/8/5 1997/9/2 1997/9/26 1997/10/27 1997/11/26 1997/12/22 1998/1/20 1998/2/19 1998/3/16 1998/4/9 1998/5/5 1998/5/29 1998/6/23
Results in Figures 3 to 4 show the patterns of the misalignment for NTD/USD and WON/USD rates. The patterns in Figure 3 show that NTD/USD misalignment started to increase from July/1997 onwards and had a first peak around August/1997 when the Asian financial crisis hit the East Asian countries. It declined sharply in early Oct./1997. The misalignment of NTD/USD rates was volatile in Oct./1997, and reached the second peak around the end of 1997 when the new president of central bank of China was appointed. It declined gradually from the beginning of 1998 but reached a third peak around June/1998 when the central bank of China imposed new restrictions on the participants of the NTD/USD non-delivery forward market.
We calculate the smoothing probability for NTD/USD rates and plot the resulting series in Figure 5. The smoothing probability of state 1 for NTD/USD rates is close to zero in the first half of the sample period and jumps to one between August/1997 and Sept/1997. The probability drops to zero in early Sept/1997 but rose again at the end of Sept/1997 and stay near one until the Jan./1998. A new round of financial crisis in emerging markets started in Russia and Brazil from the middle of 1998 sparks another wave for the NTD/USD misalignment, which increased from April/1998 onwards.
The patterns for the WON/USD misalignment are different from those of the NTD/USD rates. Figure 4 shows the results for the WON/USD rates. The
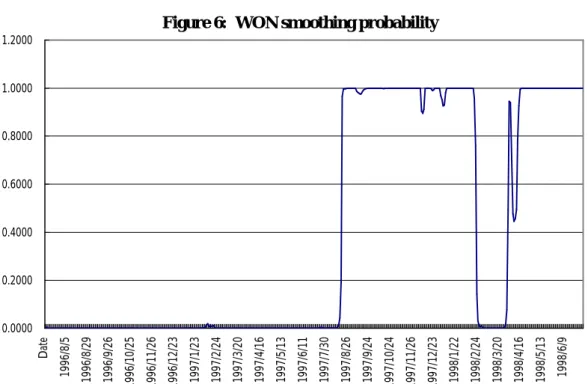
Figur e 6: WON smoothing pr obability
0.0000 0.2000 0.4000 0.6000 0.8000 1.0000 1.2000 Date 1996/8/5 1996/8/29 1996/9/26 1996/10/25 1996/11/26 1996/12/23 1997/1/23 1997/2/24 1997/3/20 1997/4/16 1997/5/13 1997/6/11 1997/7/30 1997/8/26 1997/9/24 1997/10/24 1997/11/26 1997/12/23 1998/1/22 1998/2/24 1998/3/20 1998/4/16 1998/5/13 1998/6/9
WON/USD
appears to be undervalued according to the misalignment measure in the periods at the end of 1997. It started to increase from July/1997 when the Asian financial crisis hit Thailand’s currency market and reached its peaks around Nov/1997 and drop sharply when Korea signed a stand-by arrangement with the IMF around Dec./1997. TheWON/USD
turns out to be overvalued again from the beginning of 1998 but the misalignment continues to increase till the end of the sample period. We also calculate the smoothing probability for the WON/USD rates and plot the resulting series in Figure 6. The smoothing probability for state 1 of the WON/USD rate jumps to one from August/1997 to Feb/1998. Though it stayed near zero between March/1998 and April/1998, it jumped to higher level from April/1998 onwards. This indicates that the probability of Korea won to be in state 1 is longer for that of the Taiwan dollar during the sample period.Ⅴ. Conclusions
The purpose of this paper is to model the degree of currency misalignment in Taiwan and Korea around the Asian financial crisis. By comparing the implicit NTD/USD and WON/USD spot exchange rates from their observed non-delivery forward rates, we show the differences between the misalignments of these two currencies. The innovation of this paper is that we use the NDF rates as our measurement of currency misalignment and compare the patterns of misalignments between these two markets.
Maximum likelihood estimates of parameters in the regime-switching model show that the mean value of currency misalignment for NTD/USD is small. The null hypothesis of zero sample means cannot be rejected for the NTD/USD misalignment. It indicates that the degree of NTD/USD misalignment is smaller than that of the WON/USD during the Asian financial crisis. Besides, the persistence of misalignment of the WON/USD is longer than that of the NTD/USD and extends to the end of the sample period. Future research can focus on the impact of transaction costs and government regulations on the degree of currency misalignment during a financial crisis. The specification in this paper is a natural framework for assessing the occurrence of large exchange rate adjustments during the financial crisis.
References
Chinn, M., 1998, Before the Fall: Were East Asian Currencies Overvalued?, NBER working paper, 6491, National Bureau of Economic Research.
Domowitz, I. and C. S. Hakkio, 1985, Conditional Variance and the Risk Premium in the Foreign Exchange Market, Journal of International Economics, 19: 47-66.
Edwards, S., 1994, Real and Monetary Determinants of Real Exchange Rate Behavior: Theory and Evidence from Developing Countries, Williamson (ed.) Estimating Equilibrium Exchange Rates, 61-92.
Engle, C. and J.D. Hamilton, 1990, Long Swings in the Dollar: Are They in the Data and Do Markets Know it?, American Economic Review, 4:689-713.
Economics,14: 319-338.
Froot, K. A. and J. A. Frankel, 1989, Forward discount bias: is it an exchange risk premium? Quarterly Journal of Economics,104: 139-161.
Hamilton, J. D., 1989, A New Approach to the Economic Analysis of Nonstationary Time Series and the Business Cycle, Econometrica, 3: 357-384.
Hansen, L.P.,1982, Large Sample Properties of Generalized Method of Moments Estimators, Econometrica, 50: 1029-1054.
Hodrick, R. J., 1987, The Empirical Evidence on the Efficiency of Forward and Futures Foreign Exchange Markets, London, Harwood Academic Publishers Korajczyk, R. A., 1985, The Pricing of Forward Contracts for Foreign Exchange,
Journal of Political Economy, 93: 346-368.
Park D. and Rhee C., 2000, Measuring the Degree of Currency Misalignment Using Offshore Forward Exchange Rates: The Case of the Korean Financial Crisis, working paper, Rochester Center for Economic Research.
Shen, C. H., 1993, Testing Efficiency of the Taiwan-US Forward Exchange Market : A Markov Switching Model, Academia Economic Papers,22: p87-115.
______________and Ho, C., 1996, Efficiency of Taiwan's Forward Exchange Market : Evidence Since Market Reopening in 1991, Journal of Financial Studies,3: 63-85.
Williamson, J., 1994, Introduction, Williamson (ed.) Estimating Equilibrium Exchange Rates, 1-18.
亞洲金融風暴時期遠匯與即期匯率價格不一致程度的探討:
韓圜及新台幣無本金遠匯市場的實證結果
張元晨
* 國立政治大學財務管理學系副教授沈中華
** 國立政治大學金融系教授摘 要
本文旨在探討台灣及韓國在亞洲金融風暴時期無本金遠匯市場與即期匯 率價格不一致的程度。基於在金融風暴時期透過無本金遠匯計算出來的隱含即 期匯率較能反映市場對匯率走勢的看法,本文利用新台幣兌美元及韓圜兌美元 的無本金遠匯推算出隱含的即期匯率水準,並將遠匯與即期匯率不一致的程度 定義為隱含的即期匯率與實際即期匯率之間的差額。我們利用匯率不一致的程 度推算新台幣及韓圜在亞洲金融風暴期間處於不同狀態的機率,研究發現韓圜 匯率不一致程度較高的持續期間較新台幣為長,後續研究可以參考本文的架構 分析在金融風暴時期匯率發生大幅波動的時機。關鍵字
:亞洲金融風暴、匯率、無本金遠匯*台北市文山區指南路二段 64 號,TEL:29393091 ~ 81102, Email: [email protected] **台北市文山區指南路二段 64 號