Networks Based on Poly (ethylene glycol) Diacrylate
and Epoxy.
II.
Kinetic Study
MU-SHIH LIN,* KUEN-TAY JENC, KUN-YUI HUANC, and YEN-FONC SHIHt
Department of Applied Chemistry, National Chiao Tung University, Hsinchu, Taiwan 30050, Republic of China
SYNOPSIS
Simultaneous interpenetrating polymer networks ( SINs) based on diglycidyl ether of bis- phenol A (DGEBA) and poly( ethylene glycol) diacrylate (PEGDA) in weight ratios of
100/0,50/50, and O / 100 were blended and cured simultaneously by using benzoyl peroxide (BPO) and rn-xylenediamine (MXDA) as curing agents. A kinetic study during SIN for- mation was carried out a t 45,55,63, and 70°C. Concentration changes for both the epoxide and C = C bond were monitored with FTIR. A rate expression for DGEBA cure kinetics was established with a model reaction of phenyl glycidyl ether ( P G E ) and benzylamine. Experimental results revealed that lower rate constants and higher activation energy for the SIN were found, compared with those for the constituent DGEBA and PEGDA network formation. A model of network interlock was proposed to account for this phenomenon. During simultaneous cure of DGEBA and PEGDA, the interlock (mutual entanglement) between DGEBA and PEGDA networks provided a sterically hindered environment, which subsequently increased the activation energy and reduced cure rates for both DGEBA and PEGDA. 0 1993 John Wiley & Sons, Inc.
Keywords: simultaneous interpenetrating polymer network ( S I N ) kinetic parameter
network interlock
INTRODUCTION
In our previous report on the preparation and char- acterization of optically clear, simultaneous inter- penetrating polymer networks based on PEGDA and an epoxy, we reported such intermolecular inter- actions in PEGDA/DGEBA and PEGDA/diamine on the curing behavior of PEGDA/epoxy SINs. It was noted that the unusually slow increase in vis- cosity for a composition of PEGDA/EGDBA = 501
50 was mainly attributed to H bonding between PEGDA and DGEBA.l We then found that this generally slow viscosity increase could be possibly, in part, due to the effect of mutual entanglement between PEGDA and DGEBA networks, i.e., an ef-
* To whom all correspondence should be addressed.
'
Present address: Department of Chemical Engineering, Shu- Teh Junior College of Technology, Taichung, Taiwan 40202, Re- public of ChinaJournal of Polymer Science: Part A Polymer Chemistry, Vol. 31,3317-3325 (1993)
0 1993 John Wiley & Sons, Inc. CCC OSS7-624X/93/133317-09
fect of network interlock.' We then searched the literature and found Xue et al.'s report on the kinetic study of polyurethane ( P U ) and styrene (St) IPN.3 They found that there was no interference between the reaction mechanisms and that increasing the P U / S t proportion enhanced the rate of PU for- mation, but lessened the rate of PS formation. We were interested in these results and thought that there might be some factor governing the cure rate of each network. In this article, we would like to report on the detailed kinetic analyses, including the model reaction of the epoxy cure to educidate the implied factors governing the cure behavior of SIN formation.
EXPERIMENTAL
Analytical grade of phenyl glycidyl ether (PGE) and benzylamine were purchased from Merck Co. and were used as received. The model reaction was car-
3318 LIN ET AL.
ried out a t 50, 58, 61, and 67OC by reacting PGE (3.75 g) and benzylamine (2.68 g) in 10 mL of di- chloroethane.
PEGDA was prepared according to the previous study.' DGEBA (Epikote 826) containing PGE was obtained from Shell Co. An epoxy equivalent weight (EEW) of 185 was found by titration. PEGDAI DGEBA in weight ratios of 100/0, 50/50, and O / 100 were blended. BPO (1.0 phr based on PEGDA) and MXDA (based on stoichiometric EEW) were
where A o , A,, and A, are peak areas of the specific functional group a t the initial time, time t, and after post-cure7 respectively; C o , C,, and C , are the cor- responding concentrations. Typical difference spec- tra for the epoxide and the C = C bond are shown in Figure 1.
RESULTS AND D~SCUSS~ONS
added to the foregoing compositions as curing agents. SIN formations were induced at 45, 55, 63, and 70°C. Samples were cast on KBr plates and were sandwiched and mounted on a sample holder which was heated electrically. Changes of concentrations in the epoxide group and the C = C bond were mon- itored with a Nicolet model 520 FTIR. The resolu- tion of FTIR was set a t 1 cm-'. Difference spectra were obtained by subtracting the absorbances at
Many studies on epoxide cured by diamines were reported in the l i t e r a t ~ r e . ~ - l ~ King and Bell reviewed and discussed the reaction mechanisms extensively in their study on reactions in a typical epoxy-ali- phatic diamine system.' The reaction of a primary amine and an epoxide would be expected to lead to the following possibilities:
Primary amine-glycidyl ether reaction: time t from that a t time zero, using the benzene
absorbance at 1608 cm-' as the internal standard.
H
(1)
?\
Integration of peak areas at ca. 915 and 1636 cm-' RNH, + CH,CH-- RNCH2CH-
from the difference spectra were related to the I
OH changes of concentrations for the epoxide and the
C = C bond. The conversion, a7 is defined as
Secondary amine-glycidyl ether reaction:
a = (Ao - A t ) / ( A o - A , ) = (Co - C t ) / ( C o -
Ca)
( b ) ( 2 ) H
?\
RNCH,CH- + CH,CH-- RN(CH,CH-), I I OH OHl.J--
A 2 - A 0\
\ Etherification of primary alcohol-glycidyl ether:?\
-CH- + CH2CH--
-CH- ( 3 ) I OCH,CH- I OH I OHHowever, Shechter et al.,4 in their study of glycidyl ether reaction with amine, came to the conclusion that there was no great selectivity in the reaction of a primary amine with a glycidyl ether successively from secondary to tertiary amine and that, as in the secondary amine-glycidyl ether reactions, the amount of etherification was negligible. In all cases, the hydroxyl groups served only as a catalyst for the
1900 1600 1 4 0 0 --9 2 0 +900 8 6 0 reaction and not as a serous contender for epoxide
H s v s n u m a e r ( c m - 1 ) in competition with amine. They proposed a ter-
molecular mechanism to account for this acceler-
Figure 1. Typical difference spectra ( t , in minutes) of:
..
HO-X
R2N-CH2CH- + HOX
OH I
( 4 )
A similar mechanism was proposed by Smith8 that a hydrogen bond forms between hydrogen donor and the epoxide ring followed by a three molecular tran- sition state which is rate-determining:
R slow
-
0I
slow-
R RN I + HX I CH2CH- I OHTanaka and Mika” suggested a mechanism based on the hydrogen bonding of amine to a hydrogen donor such as alcohol:
1‘
1
?\
R,NIIIHX +CH,CH-S ( 7 )-
R2N-CH2CH- + HX ( 8 ) I I T s C H - ] 0 OH HXHarrod‘ and Bellenger et al.17 observed hydrogen bonding in a n epoxy-amine system. We also ob- served hydrogen bonding in DGEBA-MXDA sys-
tem.’ King and Bell’ argued that equilibrium hy- drogen bonding would be more favorable between hydroxyl and amine groups than epoxy and hydrox- yls due to the difference in basicity. Nevertheless, in the catalytic reaction, a hypothetical termolecular transition state among secondary alcohol, amine, and an epoxy is generally recognized
Kinetics of the Model Reaction
T o establish the rate expression, we carried out a model reaction, which dealt with the “uncatalytic” reaction between phenyl glycidyl ether ( P G E ) and benzy lamine:
As concluded by Shechter et al.,4 there was no great selectivity in the reaction of glycidyl ether with a primary or a secondary amine, the rate constant may be expressed as
kl.
The newly produced hydroxy group in I further this model reaction, according to reaction ( 10) :0
3320 LIN ET AL.
In a typical epoxy-amine cure reaction, both un- catalytic and catalytic reactions are generally rec- ognized in the literature.12-16 Let [El and [ A ] be concentrations of epoxide and amine a t time t and are related to their initial concentrations of [ E l o and [A10 by
Here a is the conversion of epoxide. Since new O H is produced for every epoxide consumed, according to reaction (9), so
Typical changes of conversions with time for the model reaction are given in Figure 2. From reactions ( 9 ) and ( l o ) , the rate of disappearance of the ep- oxide is given by
d[E1
-
k l [ E ] [ A ]+
k , [ E ] [ A ] [ O H ] ( 1 4 ) dtwhere
kl
and kz are rate constants for uncatalyticand catalytic reactions, respectively. By combining eqs. ( 11) - ( 1 4 ) , eq. (15) is obtained
T i m e , m i n .
Figure 2.
for the model reaction at various temperatures.
Plots of conversions of epoxide versus time
oc
Figure 3.
at various temperatures.
Plots of CY / ( 1 - a)' vs. for the model reaction
i.e.,
where & can be found from the slopes of the con- versioncurvesavs.t(Fig.2).Aplotof&/(l -a ) ' vs. (Y gives a straight line, with an intercept of kl [ A],
and a slope of k2[E]o[Alo, as shown in Figure 3. Plots of In kl and In
kz
versus reciprocal absolute temperatures 1/
T give the activation energies of uncatalytic ( E l ) and catalytic ( E 2 ) reactions (Fig.4). The resultant rate constants and corresponding activation energies for the model reaction are listed
4
-
k l I I I I 2 . 6 2.9 3 3.1 3 . 2 3 I / T x l o 3 , 'I(-' Figure 4.1 / T for the model reaction.
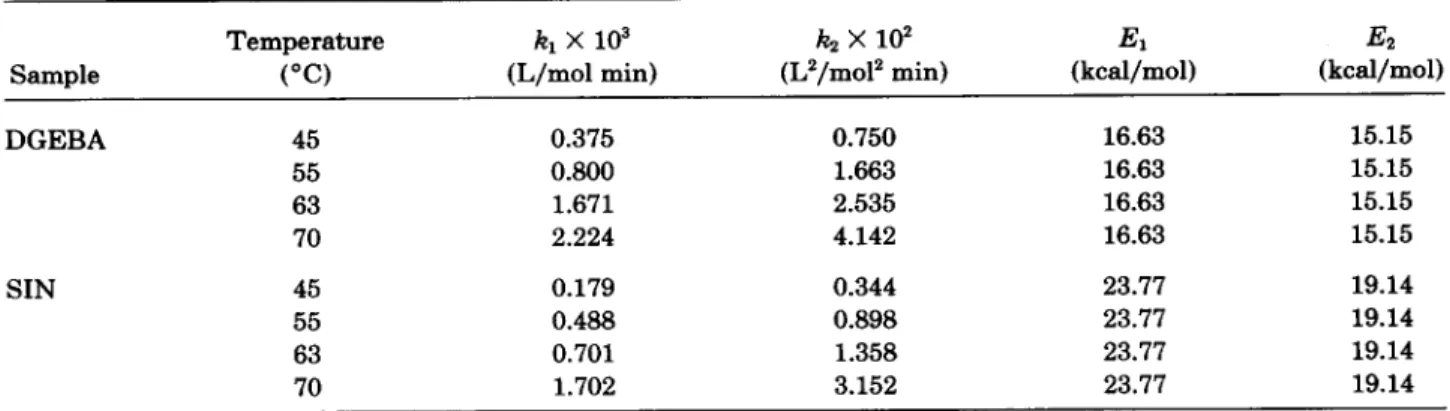
in Table I. It is noted that the rate constant ( k2) for the catalytic reaction is about 10 times faster than that for the uncatalytic reaction ( k l ) and, the ac- tivation energy of the catalytic reaction ( E 2 ) is less
than that of the uncatalytic reaction ( E l )
.
From the study of the model reaction, it is found that the cat- alytic effect is always there even if the initial reac- tants contain no OH group, because the newly pro- duced OH group is always present in the course of the reaction.Kinetics of the DCEBA Cure
From the study of the model reaction, it is known that both the uncatalytic and catalytic reactions al- ways get involved in the cure reaction of epoxide since a new hydroxy group is always produced [re- actions ( 9 ) and ( 10) ]. The reactivities of the two amino hydrogens may be similar in dilute solution as concluded by Shecheter et al., while the reactiv- ities of these two amino hydrogens may be different in bulk. Analyses of the secondary amine concen- trations done by King and Bell' indicated that at the early stages of curing reaction only primary amine were consumed quickly; the secondary amine participated in the reaction at latter stages. There- fore, it appears reasonable to assume that in a DGEBA-MXDA curing reaction, the primary amino hydrogen predominately reacts with the epoxide at the early stages, and eq. (16) may be properly used for the rate expression for epoxy-diamine cure ki- netics. The first term on the right side of eq. (16) relates to the uncatalytic reaction [reaction ( 9 ) ] while the second term relates to the catalytic reac- tion [reaction ( 10)
1.
An alternate expression was proposed in the literature: 12-16d a
- - - k ; ( l - a)"
+
k;a"(l - a)"d t
where k; and k; are apparent rate constants for the uncatalytic and the catalytic reactions, and m
+
n= 2. Generally, the reported m and n values are not
integers, probably due to diffusion and other un- known factors. By comparing eqs. ( 16) and ( 17), it is clear that k; = k,[A], and k; = k2[E]O[A]O. Here kl and k2 are real rate constants, while k; and k; are only the "apparent rate constants." Furthermore, this rate expression has little direct relationship to the reaction mechanisms, as it is only an emperical equation.
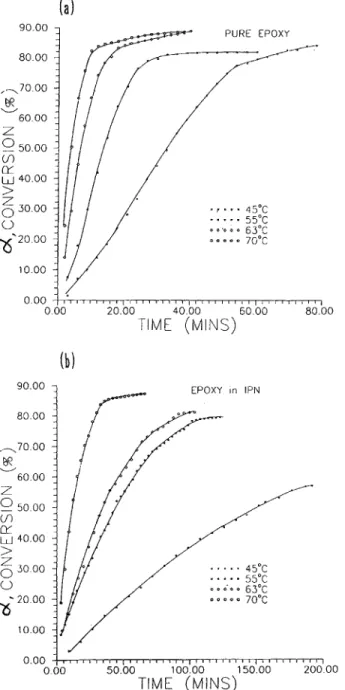
Typical changes of conversions a vs. time are shown in Figures 5 ( a ) and 5 ( b ) for pure DGEBA and SIN of PEGDA/DGEBA = 50/50. Figures 6 ( a ) and 6 ( b ) show the plots of & / ( 1 - a)* vs. a for pure DGEBA and SIN of PEGDA/DGEBA = 50/ 50, from which the intercept and slope give kl[A]o and k2[ El,[ AIo as known from eq. ( 16). It is noted that at early stages of curing reactions, the data nicely fits eq. ( 1 6 ) , while at the latter stages, devia- tion is observed, presumably because diffusion con- trol and/or complicated reactions got involved in the curing behavior. Kinetic parameters are listed in Table 11. The activation energy for the ncatalytic
( E l ) and the catalytic ( E 2 ) reactions were calculated
from Arrhenius plots [Figs. 7 ( a ) and 7 ( b )
1.
Results similar to the model reaction were found. The rate constant for the uncatalytic reaction ( k , ) was gen- erally lower than that of the catalytic reaction ( k2) while the activation energy of the uncatalytic re- action ( E l ) was generally higher than that of the catalytic reaction ( E 2 ) . Comparing Tables I and 11, DGEBA exhibited higher rate constants than PGE, presumably because the original OH group in DGEBA provided a catalytic environment for the cure reaction. Similar results were found for other SIN systems in our Ohashi and co- workers recently reported a similar effect by curing epoxy resin having hydroxymethyl groups." In ad- dition, experimental results also clearly indicated that the rate constants kl and k2 for SIN are gen- erally lower than the corresponding ones of the pure DGEBA. On the other hand, the corresponding ac- tivation energies for SIN are generally higher thanTable I.
Temperature kl X
lo3
k.2x 1 0 2 El E2Kinetic Parameters for the Model Reaction: [Elo = [Ale = 1.55 mol/L
("C) (L/mol min) (L2/mo12 min) (kcal/mol) (kcal/mol)
50 0.293 0.491 24.13 19.16
58 0.950 0.666 24.13 19.16
61 1.128 0.967 24.13 19.16
3322 LIN ET AL. PURE EPOXY /- 90.00 80.00 ,,70.00 60.00 R
z
v0
50.00 u,>
Z 0 30.00 0 40.00.
45°C.
55°C = 7G'C 0 63°C EPOXY in IPN 90.00z
0
50 00 u,fi
40.00>
Z 0 30 00 (3 -25- 2o O0. . .
45°C 55°C...
o o 6 0 e 63°C D o * o o 7 0 " ~ 0.00 I1160I84I 184 III I /III II 'T I I I I I i a I I I 1 4 ' 1 0 00 50.00 100.00 150.00 20000 TIME (MINS)Figure 5. Plots of conversions versus time for: ( a )
DGEBA and ( b ) epoxide in SIN of PEGDA/DGEBA = 50/50.
those of pure DGEBA. From the above findings, it appears that network interlock does exist. Here the network interlock means the mutual entanglement between the epoxy network and the PEGDA net- work. During SIN formation, the presence of one network, e.g., the epoxy network, would provide an additional sterically hindered environment to the growth of the other network, i.e., the PEGDA net- work, and vice versa. The network interlock not only
gives additional steric hindrance but also restrains chain mobility of the reactants, leading to a lower rate constant and a higher activation energy for SIN.
Kinetics
of
the PECDA CureFree radical polymerization of vinyl compounds normally follows a first-order reaction, 2o assuming the homolysis of the initiator is the rate-determining
(a
1
0 ' 7 0 PURE EPOXY 0 601
II w. .
.
.
.
AS'C v 4 I 0.30j
/
,
-ad N h d I 4 \ v .d 000 \,rrrr- 000 0 2 0 0 4 0 0 60 . *-
0 8 0 I 0 0 d (CONVERSION) 0 0(b1
0 -O D 0 1 5 - 0 1 3 - 0 1 0 - 0 0 8 - 0 00 0 20 0 80 m , ( C O ~ ~ E R S I O ~ Figure 6. Plots of & / ( l - a ) 2 vs. a for: ( a ) DGEBA and (b) SIN of PEGDA/DGEBA = 5 0 / 5 0 at various temperatures.Table 11. Kinetic Parameters of Epoxide for DGEBA and SIN: [El, = 5.02 mol/L, [Ale = 0.329 mol/L
Temperature kl X
lo3
k.2x
lo2
El Ez(kcal/mol) (kcal/mol)
Sample
("0
(L/mol min) (L2/mo12 min)DGEBA 45 55 63 70 0.375 0.800 1.671 2.224 0.750 1.663 2.535 4.142 16.63 15.15 16.63 15.15 16.63 15.15 16.63 15.15 SIN 45 0.179 0.344 23.77 19.14 55 0.488 0.898 23.77 19.14 63 0.701 1.358 23.77 19.14 70 1.702 3.152 23.77 19.14 (a) 80.00 70 00 '-60.00 b? v 5 0 00
0
40 00 W$
30 00 0 20 00 10 003.
Figure 7. versus reciprocal ab-
solute temperature 1 / T for: ( a ) DGEBA and ( b ) SIN of
PEGDA/EGDBA = 50/50. Plots of In k, and In ' > 6 0 00 6?
-
z
53 000
g
$0 00 0 . 2 0 00 W$
30 00 0 75- 10 00 0 0 0 ,I IIIIII I I I V I I I 8 111r,,rllCllal p l I /, 0 00 50 00 10000 1 5 0 0 0 20000 TIME (MINS) Figure 8.in: ( a ) PEGDA and ( b ) PEGDA/DGEBA = 50/50.
3324 LIN ET AL. 0 - 1.60
1
PURE PEGDA *-- h d 1.00 I +-
0 80'
0 6 0 0 40 0.20 45°C 55°C 63°C 70°C2
I 0.80 4 c-
0.60 I 0.40 0.20 PEGDA in IPN . . 0.00 j b ,I I I,, , , , ,,
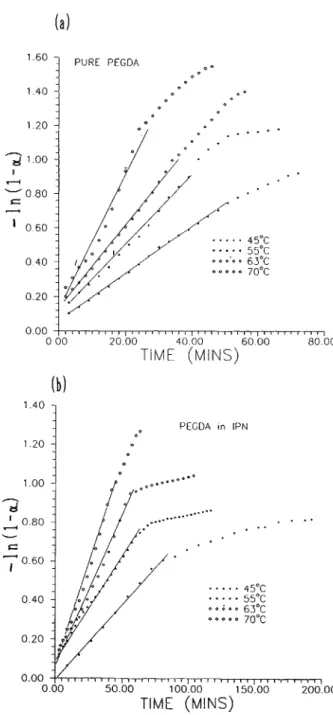
, ~, , ~, , I , , 0.00 50.00 100.00 15000 200.00 TIME (MINS)Figure 9. Plots of -In (1 - a ) vs. time for C = C in:
( a ) PEGDA and ( b ) SIN of PEGDA/DGEBA = 50/50.
step for the initiation, and steady-state is reached
Integration of eq. (18) gives
where [MI, and [MI are the concentrations of the
C = C bond in PEGDA at the beginning and time t, f i s the initiator efficiency, [ I ] is the initiator con- centrations, kd is the dissociation constant of the initiator, and kp and k, are rate constants of chain propagation and chain termination. Assume that f and [ I ] do not change too much at early stages of cure such that kp( kdf [ I ] / k t ) 'I2 is nearly constant
and equal to k. The result of eq. ( 19) can be ex- pressed as
- l n ( l - a ) = Izt (20) with [MI = [MIo( 1 - a ) by neglecting the C = C concentration after postcure ([MI,). Figures 8( a ) and 8 ( b ) show the conversions a vs. time t for PEGDA and for a SIN of PPEGMA/DGEBA = 50/ 50. Figure 9 ( a ) shows the plot of - In ( 1
-
a ) vs. t for PEGDA cured by BPO at various temperatures. Figure 9 ( b ) shows a similar plot for SIN of PEGDA/ DGEBA = 50/50. Slopes of straight lines give the values of the apparent rate constant k at various temperatures. The corresponding apparent activa- tion energies were calculated from the plots of In k vs. reciprocal absolute temperature 1/
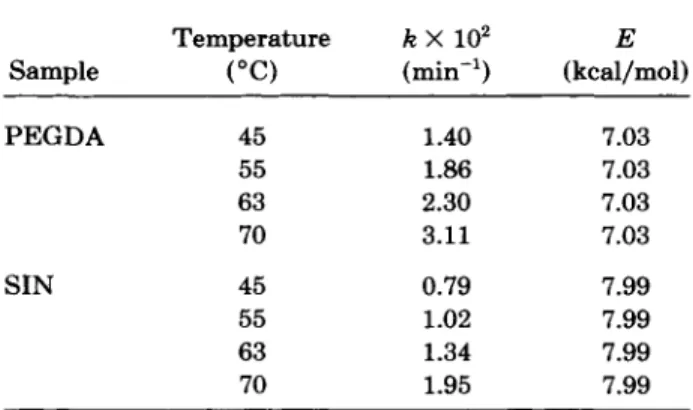
T [Figs. 10 ( a ) and 1 0 ( b ) ] . Kinetic parameters for PEGDA and SIN are summarized in Table 111. Similarly, the data closely fit eq. (20) a t early stages of cure while a t latter stages, deviation is generally observed, pre- sumably because of the gel effect.20It is clear from Table I11 that the SIN shows lower apparent rate constants and higher apparent acti- vation energies than pure PEGDA. Again, the net-
Figure 10.
PEGDA and ( b ) SIN of PEGDA/EGDBA = 50/50. Plots of In Iz vs. 1 / T for C = C for: ( a )
Table 111. and SIN
Kinetic Parameters of C = C for PEGDA
~~ ~ ~~
Temperature k X
lo2
ESample ("C) (min-') (kcal/mol)
PEGDA 45 1.40 7.03 55 1.86 7.03 63 2.30 7.03 70 3.11 7.03 SIN 45 0.79 7.99 55 1.02 7.99 63 1.34 7.99 70 1.95 7.99
work interlock appears to have a significant effect on the curing behavior of SIN.
CONCLUSIONS
In a kinetic study of DGEBA/PEGDA SIN, it was found that the SIN resulted in lower rate constants and higher activation energies, compared with those of the respective components. This phenomenon can be interpreted by an effect of the network interlock. The network interlock apparently not only gave ad- ditional sterically hindered environment to the cur- ing reactions, but also restrained the mobilities of both DGEBA and PEGDA, thus accounting for the observed phenomenon.
The authors are grateful to the National Science Council of ROC for financial support under Contract Number
NSC-82-0405-E009-095.
REFERENCES A N D NOTES
1. M. S. Lin and K. T. Jeng, J. Polym. Sci. Polym. Chem.
Ed., 30, 1941-1951 1992).
2. M. S. Lin and C. C. Yeh, J. Polym. Sci. Polym. Chem.
Ed., 3 1, 2093 ( 1993 )
.
3. S.-C. Xue, Z.-P. Zhang, and S.-K. Ying, Polymer, 30,
1271 (1989).
4. L. Shechter, J. Wynstra, and R. E. Kurkyiy, I d . Eng.
Chem., 4 8 , 9 4 ( 1956).
5. A. K. Ingberman and R. K. Walton, J. Polym. Sci.,
28,468 ( 1958).
6. ( a ) J. F. Harrod, J. Appl. Polym. Sci., 6, S63 (1962);
( b ) J. F. Harrod, J. Polym. Sci., A l , 385 (1963). 7. N. S. Isaacs and R. E. Parker, J. Chem. Soc., 3497
( 1960).
8. I. T. Smith, Polymer, 2, 95 (1961).
9. J. J. King and J. P. Bell, Reactions in a Typical Epoxy-
Aliphatic Diamine System, in Epoxy Resin Chemistry,
R. S. Bauer, Ed., ACS Symposium Series, Vol. 114,
American Chemical Society, Washington, DC, pp.
10. Y. Tanaka and T. F. Mika, in Epoxy Resins Chemistry
and Technology, C. A. May and Y. Tanaka, Eds., Dek-
ker, New York, 1973, p. 135.
11. K. Horie, H. Hiura, M. Sawada, I. Mita, and H. Kambe, J. Polym. Sci. A-1, 8, 1357-1372 (1970). 12. 0. A. Moroni, J. Mijiovic, E. M. Pearce, and C. C.
Foun, J. Appl. Polym. Sci., 32,3761-3773 (1986).
13. C. C. Riccardi, H. E. Adabbo, and J. J. Williams, J.
Appl. Polym. Sci., 29, 2481-2492 (1984).
14. A. Dutta and M. E. Ryan, J. Appl. Polym. Sci., 24, 635-649 ( 1979).
15. M. A. Golub and N. R. Lerner, J. Appl. Polym. Sci.,
16. J. Mijovic, J. Kim, and J. Slaby, J. Appl. Polym. Sci.,
29, 1449 (1984).
17. V. Bellenger, J. Vender, J. Francillette, P. Hoarau, and E. Morel, Polymer, 28, 1079 ( 1987).
18. ( a ) M. S. Lin and R. J. Chang, J . Appl. Polym. Sci.,
46, 815-827 (1992); ( b ) M. S. Lin, Timothy Yang, and Kun-Yui Huang, Polymer, in press.
19. K. Ohashi, K. Hasegawa, A. Fukuda, and K. Uede, J.
Appl. Polym. Sci., 44,419-423 ( 1992).
20. ( a ) George Odian, Principles of Polymerization, 2nd ed., Wiley, New York, 1981, chapter 3; ( b ) T. R. Cuadrado, J. Baanajo, and R. J. J. Williams, J. Appl.
Polym. Sci., 28,485-499 ( 1983).
223-262.
32,5215-5229 (1986).
Received December 21, 1992