國
立
交
通
大
學
資訊科學與工程研究所
碩
士
論
文
使用去反光機制作車輛顏色分類
Vehicle Color Classification Using the Specular-Free Mechanism
研 究 生:李端賢
指導教授:李素瑛 教授
使用去反光機制作車輛顏色分類
Vehicle Color Classification Using the Specular-Free Mechanism
研 究 生:李端賢 Student:Tuan-Hsien Lee
指導教授:李素瑛 Advisor:Suh-Yin Lee
國 立 交 通 大 學
資 訊 科 學 與 工 程 研 究 所
碩 士 論 文
A ThesisSubmitted to Institute of MultimediaEngineering College of Computer Science
National Chiao Tung University in partial Fulfillment of the Requirements
for the Degree of Master
in
Computer Science August 2011
Hsinchu, Taiwan, Republic of China
i
使用去反光機制作車輛顏色分類
研究生 : 李端賢 指導教授 : 李素瑛 教授
國立交通大學資訊工程與科學系
摘要
在自動化的車輛監視系統中,顏色辨識是一項重要的議題。車輛的顏色是一 項重要的特徵,它可以幫助我們去辨識這輛車子的身分。在這篇論文中,我們提 出一個以降低反光影響的方法去分類車輛的顏色。首先,使用影像切割演算法把 影像切成幾個區域,找出最有可能是車輛外殼的那個區域。由於受到車殼上反光 的影響,會使得影像切割後車殼會變成幾塊破碎的區域,我們將很難找到完整的 車輛外殼的區域。因此,我們使用了一個去反光的方法分開反光的成分和漫射的 成分,以降低反光所造成的影響。最後,我們找出車輛車殼的區域,計算它的主 要顏色以分類車輛的顏色。我們從幾個不同的網站上下載七種不同顏色的車輛圖 片當作實驗的資料,實驗的結果顯示出我們提出的方法有令人滿意的結果。 關鍵字: 車輛顏色分類,去除反光ii
Vehicle Color Classification Using the Specular-Free Mechanism
Student: Tuan-Hsien Lee Advisor:
Prof.Suh-Yin Lee
Institute of Computer Science and Information Engineering
National Chiao-Tung University
Abstract
Color recognition is an important issue in automatic vehicle surveillance. The vehicle color is a critical feature to help identify cars. In this thesis, we propose a novel approach for vehicle color classification. Firstly, we use image segmentation algorithm to divide image into regions and extract the vehicle shell part from them. Since the light reflection will influence, the broken regions on car shell after image segmentation, we can’t find a complete car shell well in images. Thus, we use the specular-to-diffuse mechanism to separate specular component and diffuse component and reduce the light reflection influence. Finally, we extract the vehicle shell region and calculate the dominant color of the shell region to classify the vehicle color. We download the 7 kinds of different color vehicle images from Internet web sites. The experimental results demonstrate good performance and thus show the effectiveness of the proposed schemes.
iii
Acknowledgement
First of all, I greatly appreciate the kind guidance of my advisor, Prof. Suh-Yin Lee. She not only helps with my research very much but also takes care of me. Her graceful suggestion and encouragement help me forward to complete this thesis.
Besides, I want to give my thanks to all members in the Information System Laboratory for their suggestion and instruction, especially Ms. Hui-Zhen Gu, Mr.
Yi-Cheng Chen, and Mr. Li-Wu Tsai.
Finally, I would like to express my deepest appreciation to my parents. They support me on all parts in my life and study. This thesis is dedicated to them.
iv
Table of Contents
Abstract(Chinese) ... i Abstract(English) ... ii Acknowledgement ... iii Table of Contents ... iv List of Figures ... v Chapter 1. Introduction ... 1 1.1 Motivation ... 1 1.2 Related Works ... 2 1.3 Organization ... 3 Chapter 2. Background ... 4 2.1 Color Models ... 42.1.1 The RGB Color Space ... 4
2.1.2 The HSI Color Space ... 4
2.1.3 Converting Colors from RGB to HIS ... 5
2.2 Hill-manipulation: An effective algorithm for Color Image Segmentation ... 6
2.2.1 Hill-climbing algorithm ... 8
2.2.2 Solving the scenario case I ... 8
2.2.3 Solving the scenario case II ... 9
2.2.4 Filtering out unnecessary regions ... 9
2.3 Separating Reflection Components of Textured Surfaces using a Single Image... 9
2.3.1 Reflection Model ... 10
2.3.2 Specular-To-Diffuse Mechanism ... 11
Chapter 3. The Proposed Vehicle Color Classification Method ... 14
3.1 Overview of Proposed Scheme ... 14
3.2 Image Color Discrimination ... 15
3.3 Vehicle Body Region Extraction ... 18
3.4 Using Specular-To-Diffuse Mechanism ... 19
3.5 Vehicle Body Color Discrimination ... 23
3.6 Iterative Process ... 24
Chapter 4. Experimental Results... 25
4.1 Experimental Dataset ... 25
4.2 Experimental Results ... 26
Chapter 5. Conclusion and Future work ... 29
v
List of Figures
Figure 2.1: The RGB Color Space ... 4
Figure 2-2 The HSI Color Space ... 5
Figure 2-3. The Scenario Case I Problem [13] ... 7
Figure 2-4. The Scenario Case II Problem [13] ... 7
Figure 2-5. The Result of Maximum Chromaticity and Intensity Space [14] ... 12
Figure 2-6. The Intersection Point of Specular and Diffues [14] ... 13
Figure 3-1. The Proposed Scheme of Vehicle Color Classification ... 15
Figure 3-2. The NxN Blocks ... 16
Figure 3-3. The Four Regions of Inner Blocks ... 16
Figure 3-4. The Flow Chart of Initial Vehicle Color Discrimination ... 17
Figure 3-5. The Reason of Bad Results in Image Color Discrimination ... 18
Figure 3-6. The Result of Vehicle Body Extraction ... 19
Figure 3-7. Broken Region of Vehicle Body Extraction on Light Reflection Influence20 Figure 3-8. Improved Vehicle Body Extraction Using Specular-Free Machanism ... 21
Figure 3-9. The Result of Vehicle Image Segmentation on Red Car ... 22
Figure 3-10. The Result of Vehicle Image Segmentation on Black Car ... 22
Figure 3-11. The Result of Vehicle Image Segmentation on White Car ... 23
Figure 3-12. The Iterative Process Flow Chart ... 24
Figure 4-1. The sample images of the database ... 25
Figure 4-2. The classification accuracy on black, white, color... 27
Figure 4-3. The root mean square error of dominant color ... 27
1
Chapter 1. Introduction
1.1 Motivation
In recent years, vehicle color recognition is an important issue in many related applications, such as automatic vehicle surveillance system. Various surveillance cameras have widely been employed in ubiquitous environments. For example, many entrances of parking areas or the crossroads have equipped with cameras. Therefore, many surveillance systems get vehicle images or videos by using camera. However, vehicle images or videos may be affected by various environments factors, such as highlights, shades, or other objects. We might get various noises in vehicle information under many different conditions. Because of the variation of vehicle colors, shapes, orientations, size, and poses in different environmental, there are many challenges and difficulty to recognize vehicle color correctly.
In vehicle recognition, the plate number is the feature that is widely applied to identify vehicles. However, plate number may be hided or tampered in some conditions. Therefore, the vehicle color becomes another important feature in vehicle recognition. For example, if a system finds that the car plate does not match with the car color, the system will reject the request of the car that may be illegal. The vehicle color recognition is an important work to increase the correctness and security. In this thesis, we mainly propose an advanced color recognition approach. Due to the surroundings influence to vehicle images, it is difficult to recognize the vehicle color correctly. Our proposed method reduces the affect of highlight to vehicle color recognition. Besides, vehicle body detection is an important issue to vehicle color recognition. In general, the vehicle color is the color of the car shell. Therefore, we
2
need to detect vehicle body that does not contain number plate, windshield, windows, and other parts. Those may affect the correction of vehicle color recognition.
There are two main challenges in our problem. First, how to find the vehicle body is difficult. The major color of a vehicle is determined by the steel plates without windshield, car lamps, background, and so on. Second, how to discover the real vehicle color is hard. The detected color may have been affected by light reflection. Our goal is to acquire the vehicle body region without the irrelevant parts and to reduce the highlight influence on vehicle body for color classification.
1.2 Related Works
Several vehicle color classification methods have been proposed in the past few years. Detailed surveys can be found in [1-8]. Those methods of vehicle color recognition are usually developed following some similar steps. Methods [5-8] are proposed to find the vehicle body region. [5, 7] fix the vehicle location in the image and assign a region as the vehicle body region. [6] not only uses image segmentation but also removed some undesired region from vehicle video. [8] uses two different methods (smooth hood peace and semi front vehicle) to find vehicle body region. Those methods also fix the vehicle location in the image. When finding the vehicle body region, they can use them to classify the vehicle color more correctly.
And then, the next step is to construct feature vector of images. It is important to use feature vector to compare the difference images. When we construct the ground truth, we can compare the testing image with images of ground truth. By the way, we can discriminate the vehicle color. [1] proposes a novel convolution kernel function to construct Grid kernel which is a kind of feature vector. They use this method to transform a vehicle image into a vector, and classify vehicle color images. Some
3
methods [2, 3, 4, 6, 8] convert RGB color space into HSV(HSI) color space. Then, they calculate H, S, V(I) (sometimes only H, S) values of all pixels in the images or the vehicle body region, and construct the three-dimension histograms or the two-dimension histograms of the HSV(HSI) or HS. For each image, all of the histogram values are combined into feature vectors. They use the feature vector of color histograms to discriminate vehicle color. [8] uses not only histogram based feature selection method but also pixel based selection method and pixel based median selection method to construct feature vector. They compare the different advantages of those methods.
The last step is classification. It is the core of vehicle color recognition. Support Value Method (SVM) is most widely used in vehicle color recognition. [1, 2, 6, 8] use SVM and feature vector to classify vehicle color images. [3, 4] calculate the distance of two feature vectors in training data and testing data. [5, 7] find the dominant color of vehicle image and use decision tree to classify different colors. [8] uses not only SVM but also K-Nearest Neighbor Model and Artificial Neural Networks to classify vehicle color.
1.3 Organization
The organization of this thesis is as follows. In chapter 2, we introduce some background knowledge required for digital image processing. In chapter 3, we illustrate the method that uses the specular-to-diffuse mechanism to improve the proposed vehicle color classification method. In chapter 4, the experimental results and discussion will be presented. Finally, we conclude the thesis and describe the future work in chapter 5.
4
Chapter 2. Background
2.1 Color Models
2.1.1 The RGB Color Space
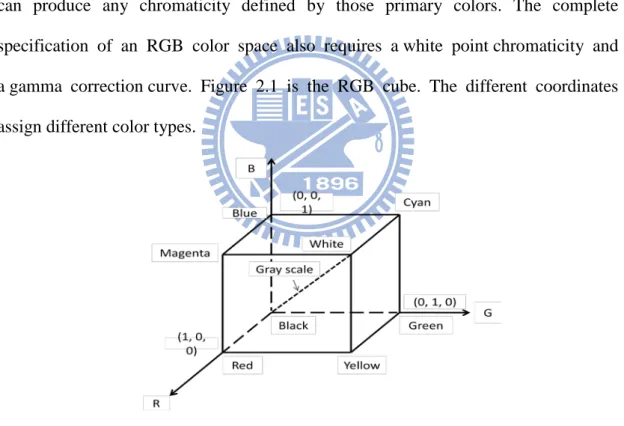
RGB is an abbreviation for red, green, and blue. An RGB color space is an additive color space based on the RGB color model. A particular RGB color space is defined by the three chromaticities of the red, green, and blue additive primaries, and can produce any chromaticity defined by those primary colors. The complete specification of an RGB color space also requires a white point chromaticity and a gamma correction curve. Figure 2.1 is the RGB cube. The different coordinates assign different color types.
Figure 2.1: The RGB Color Space
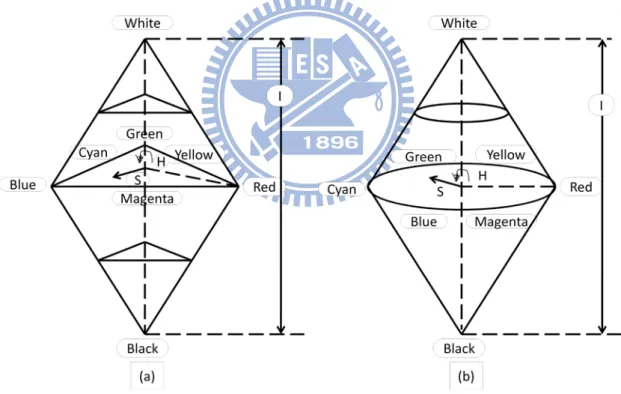
2.1.2 The HSI Color Space
In this model, as in the YIQ model, luminance or intensity (I) is decoupled from the color information which is described by Hue channel and Saturation channel. It is
5
closely to the way humans perceive color by using Hue and saturation of colors respond, and thus this model is suited for interactive manipulation of color images where changes occur for each variable shift that corresponds to what the operator expects.
The Hue component describes the color itself in the form of an angle between [0,360] degrees. 0 degree mean red, 120 means green, 240 means blue. 60 degrees is yellow, and 300 degrees is magenta. The Saturation component signals how much the color is polluted with white color. The range of the S component is [0,1]. The Intensity range is between [0,1] and 0 means black, 1 means white.
Figure 2-2 The HSI Color Space
2.1.3 Converting Colors from RGB to HIS
6
obtained using the equation
H = �θ if B ≤ G360 − θ if B > G (1) with
θ = cos−1� 12[(R−G)+ (R−B)]
[(R−G)2+ (R−B)(G−B)]1/2� (2)
The saturation component is given by
S = 1 − (R+G+B)3 [min(R, G, B)] (3)
Finally, the intensity component is given by
I = 13(R + G + B) (4)
It is supposed that the RGB values have been normalized to the range [0, 1] and that angle θ is measured with respect to the red axis of the HSI space.
2.2 Hill-manipulation: An effective algorithm for Color Image
Segmentation
Many researchers have proposed many different algorithms for color image segmentation. Image segmentation algorithms intend to divide an image into several visually coherent segments. In cluster-based image segmentation techniques, these techniques may support from the dominance of some larger hills. [13] proposes a novel approach of color image segmentation. The method is called hill-manipulation algorithm. Hill-manipulation algorithm can overcome the problems of the traditional cluster-based image segmentation algorithms. The problems are that there are two scenarios of detail loss in an image after propose the traditional cluster-based image segmentation algorithms. Hill-manipulation algorithm mainly contains two parts, including the traditional image segmentation algorithm called hill-climbing algorithm
7
[12] and the methods of solving the two scenarios of detail loss.
The scenario case I is a large portion of an image falls inside one wide hill, as shown in Fig 2-3. The wide hill may contain many small hills that have different colors. Fig 2.3 (a) is the original image, Fig 2.3 (b) is the corresponding color histogram and Fig 3.2 (c) is the image segmented into one large region and several other small regions
Figure 2-3. The Scenario Case I Problem [13] (a) Original image (b) Histogram of Hue Pixels (c) Image Segmentation Result
The scenario case II is the histogram contains a wide spectrum of colors in the image including the two extreme colors in the hue axis, as shown in Fig 2-4. Fig 2-4. (a) is the original image, Fig 2-4. (b) is the corresponding color histogram, and Fig 2-4. (c) is the image segmented into one large blue region, the black region, and the white background.
(a) (b) (c)
Figure 2-4. The Scenario Case II Problem [13] (a) Original image (b) Histogram of Hue Pixels (c) Image Segmentation Result
8
2.2.1 Hill-climbing algorithm
The hill-climbing segmentation algorithm [12] is a method using cluster-based techniques. The main idea is that each hill contains similar colors in color histogram and a hill is represented as a cluster. Initially, it constructs the HSV color histogram of the color image. Next, it randomly chooses a non-zero bin of the color histograms as target bin and compares the neighbor bins with target bin. The maximum neighbor bins as the center bin. It continues the same steps until a locally maximum bin of the color histogram is found. By the same steps, it can find all the locally maximum bins of the color histogram, and those bins are regarded as the initial seeds of the clustering algorithm. Therefore, the same color pixels can be grouped together.
2.2.2 Solving the scenario case I
In order to solve the scenario I, [13] proposes a hill-slimming algorithm to overcome this problem. The idea is that they analyze the HSV color model and define a threshold, beyond which a hill can be considered wide, called slimming threshold. Therefore, if a hill contains more than six bins in any component (H, S, or V), it is considered wide and needs to be slimmed. They propose an algorithm, called hill-slimming algorithm to split a wide hill into homogenous sub-hills. The hill-slimming algorithm creates a temporary histogram of a wide hill in the original histogram, called temp_hist, using the double intervals for H, S, and V. Therefore, the wide hills of the original histogram are extended out and divided into several homogenous sub-hills. Each sub-hill will be assigned a unique color.
9
2.2.3 Solving the scenario case II
In order to solve the scenario II, [13] proposes Detect-Dominant-Hill algorithm and hill-dismantling algorithm to overcome this problem. Detect-Dominant-Hill algorithm is used to detect a hill that contains six or less bins but represents most of the image area. Hence, there is a possibility that such a hill contain non-similar color. The hill width is defined as the number of histogram bins in the hill. It computes the pixel numbers of each hill, and calculates the average size of all bins. If the size of a hill is more than the average size of all bins and a hill width is less than slimming threshold, such a hill is dominant hill. And then it uses hill-dismantling algorithm to separate such a hill into some sub-hills.
2.2.4 Filtering out unnecessary regions
Due to the application of the hill-slimming and hill-dismantling algorithms to solve the two scenario cases mentioned, many unnecessary small regions may be generated. Thus, it proposes region-filtering algorithm to filter out unnecessary small regions. Initial, it calculates the average size from all distinct regions. If a size of region is smaller than the average size, it will change the color by the color of majority surrounding region.
2.3 Separating Reflection Components of Textured Surfaces using a
Single Image
[15] proposes a novel algorithm of light reflection removal that uses Specular-to-diffuse mechanism to separate the specular component and diffuse
10
component. The specular-free image is the result of specular-to-diffuse mechanism. It can improve the result of image segmentation. The following is the introduction of specular-to-diffuse mechanism.
2.3.1 Reflection Model
[14] introduces the dichromatic reflection model, which states that reflected lights of inhomogeneous objects are linear combinations of diffuse and specular components. Therefore, the pixel of inhomogeneous objects taken in an image by a digital color camera can be described as:
I(x) = ωd(x) ∫ S(λ)Ω E(λ)q(λ)dλ + ωs(x) ∫ E(λ)q(λ)dλΩ (5)
, where I = {Ir , Ig, Ib} is the color vector of image intensity or camera sensor. The spatial parameter, x = {x, y}, is the two dimensional image coordinates. q = {qr, qg, qb} is the three-element-vector of sensor sensitivity. ωd(x), and ωs(x) are the
weighting factors for diffuse and specular reflections, respectively; their values depend on the geometric structure at location x. S(λ) is the diffuse spectral reflectance function, while E(λ) is independent of the spatial location (x) because we assume a uniform illumination color. The integration is done over the visible spectrum (Ω). For simplicity, I(x) can be written as:
I(x) = ωd(x)B(x) + ωs(x)G (6)
, where B(x) = ∫ S(λ, x)Ω E(λ)q(λ)dλ and G = ∫ E(λ)q(λ)dλΩ . It defines chromaticity as:
σ(x) = I I(x)
r (x) + Ig(x)+ Ib(x) (7)
11
specular chromaticity (Γ ) as Λ(x) = B(x)
Br(x)+ Bg(x)+ Bb(x) and Γ =
G Gr+ Gg+ Gb,
respectively. Therefore, I(x) can be written in term of chromaticity:
I(x) = md(x)Λ + ms(x)Γ (8)
, where md(x) = ωd(x)[Br+ Bg+ Bb], and ms(x) = ωs(x)[Gr+ Gg+ Gb].
2.3.2 Specular-To-Diffuse Mechanism
In order to separate the reflection and diffuse components, it proposes an algorithm, called the specular-to-diffuse mechanism. The main ideal of this mechanism is the saturation values of all pixels are made constant with regard to the maximum chromaticity, while retaining their hue. Following the chromaticity definition (7), it defines maximum chromaticity as:
σ�′(x) = max (Ir′(x),Ig′(x),Ib′ (x) )
Ir′(x)+Ig′(x)+Ib′ (x) . (9)
By assuming a uniformly single colored illumination surface lit in a two-dimensional space, maximum chromaticity-intensity space. Fig. 2-5 (a) is the image with light reflection and Fig. 2-5 (b) is the maximum chromaticity and intensity space. It finds a phenomenon that diffuse pixel without light reflection influence; the maximum chromaticity value is a constant value. Otherwise, specular pixel is influenced by light reflection; the maximum chromaticity is changed following the different light intensity.
12
Figure 2-5. The Result of Maximum Chromaticity and Intensity Space [14]
The detail of specular-to-diffuse mechanism is following. All image pixels including diffuse and specular are projected into maximum chromaticity intensity space. The location of diffuse pixels will be at the right side of specular pixels. It finds the curved line form by the projected pixels, as shown in Fig 2-6. The following equation makes this curved line:
Ĩ′(x) = md′(x)(Λ�′(x) − 13)( σ�
′(x)
σ�′(x)− 13). (10)
Due to ms′ of specular pixel equals zero at the intersection point, the intersection point becomes crucial important. It indicates the diffuse component of specular pixel. Therefore, it wants to compute md′ (x), which can be derived from (10):
md′ (x) = Ĩ′(x)[3σ�′(x)−1]
σ�′(x)[3Λ�′(x)−1]. (11)
Having known the md′ (x) value, it can know ms′(x) by ms′(x) = Ir′(x) + Ig′(x) + Ib′(x) − md′(x). Consequently, the diffuse reflection component can be written as:
md′ (x1)Λ′(x1) = I′(x1) - ms
′(x 1)
13
14
Chapter 3.
The Proposed Vehicle Color Classification Method
We propose an effective vehicle color classification algorithm. In our algorithm, we consider the influence of light reflection on car shell during the image segmentation process and extract the vehicle body to classify vehicle color by using the dominant color of vehicle body.
3.1 Overview of Proposed Scheme
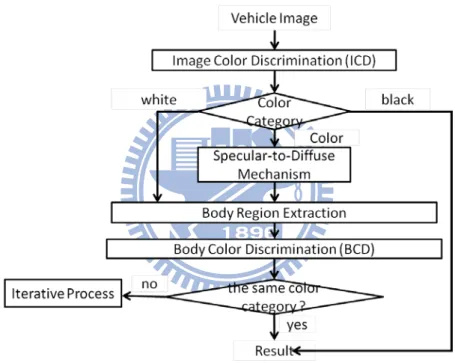
The overview of proposed vehicle color recognition is depicted in Figure 3-1. The system architecture mainly consists of five parts, including image color discrimination, specular-to-diffuse mechanism, body region extraction, body color classification, and iterative process.
For image color discrimination, we divide a vehicle image into NxN blocks. We calculate the average value of hue, saturation, and intensity of each block. By the HSI information, we roughly divide a vehicle image into three different categories: white, black, and colors. And then, we adopt different strategies to extract vehicle color for each of the three categories.
Next, the specular-to-diffuse mechanism is used to reduce the influence of light reflection before the step of vehicle body extraction. If the image is classified into color category in the image color discrimination step, the specular-to-diffuse mechanism is executed. Otherwise, the step is not performed.
The image segmentation technique is adopted for vehicle body extraction. In the body region extraction step, an effective algorithm: Hill-manipulation [13] is utilized. We want to find the vehicle body region from image segmentation result. After processing, we get the vehicle image that only contains the vehicle steel plate.
15
Lastly, we propose a color classification method calculating the dominant color of the vehicle body region. We classify vehicle image into different categories by dominant colors. Moreover, there is an iterative process step to check the answer. We double check the results including image color discrimination and body color discrimination. If the results are the same, we will complete the process. If not the same, we will come back to the color category step and choose other color category that has not been chosen before. By using this iterative method, we will improve the correctness of vehicle color classification.
Figure 3-1. The Proposed Scheme of Vehicle Color Classification
3.2 Image Color Discrimination
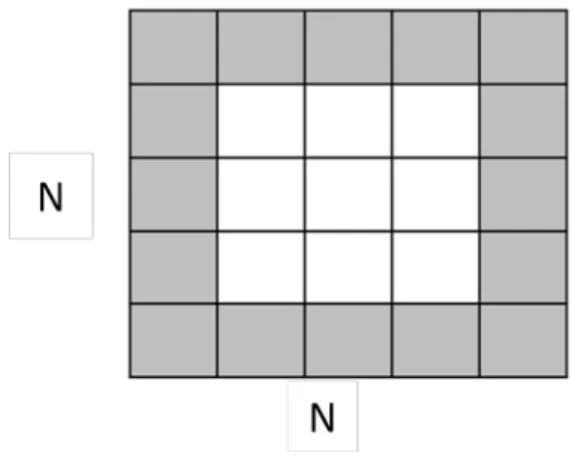
In this section, we propose a method to classify vehicle images into three categories, including color, white, and black. A vehicle image is divided into NxN blocks (N=5), as in Figure 3-2. These blocks are distinguished as the inner blocks and the outer blocks. Since the outer blacks may contain the background information, only the inner blocks containing important car information are considered.
16
Figure 3-2. The NxN Blocks
For all inner blocks, we divide those inner blocks into four regions, as in Figure 3-3. The average RGB value for each region is calculated, and it is considered as the dominant RGB value of the region. We transform RGB color model into HSI color model, because the color described by HSI color model is more intuitive to human’s eyes. And then, we find the average intensity value of all inner blocks (avg_I) and the maximum average saturation value from those regions (mavg_S). The average intensity value (avg_I) and the maximum average saturation value (mavg_S) are utilized to classify a vehicle image into three different categories: color, white, and black.
Figure 3-3. The Four Regions of Inner Blocks
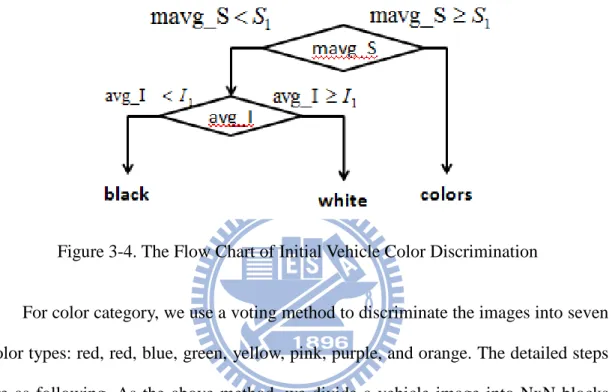
Color category contains higher saturation and white color shows higher intensity. If the maximum average saturation (mavg_S) is greater than or equal to a threshold S1, we will classify the vehicle into color category. If the maximum saturation is less
17
than a threshold S1 and the average intensity value (avg_I) is greater than a threshold I1, we will classify the vehicle into white category. If the maximum average saturation
(mavg_S) is less than a threshold S1 and the average intensity value (avg_I) is less than I1, we will classify the vehicle into black category. Figure 3-4 shows the flow chart of image color discrimination.
Figure 3-4. The Flow Chart of Initial Vehicle Color Discrimination
For color category, we use a voting method to discriminate the images into seven color types: red, red, blue, green, yellow, pink, purple, and orange. The detailed steps are as following. As the above method, we divide a vehicle image into NxN blocks (N=5), and we also consider the inner blocks. For each inner block, we find the dominant color by calculating the average HSI value of all pixels in the block. For the target inner block, we compare its dominant color with the dominant colors of other inner blocks. If the difference of dominants is less than a threshold, we vote that target block once. When all inner blocks go through the voting process, we find the inner block that has the largest number of votes. We call such a block “max_block”. And then, we pick those inner blocks that vote max_block once, and calculate the average dominant color value of max_block and those blocks that vote max_block. Finally, we discriminate the vehicle image color by the average dominant color of the above blocks. Moreover, we transform the dominant color from RGB to HIS. And then, we
18
need to compare the hue value with the hue value of all colors, such as red, blue, green, yellow, pink, purple, and orange. We want to find the most similar color to the dominant color.
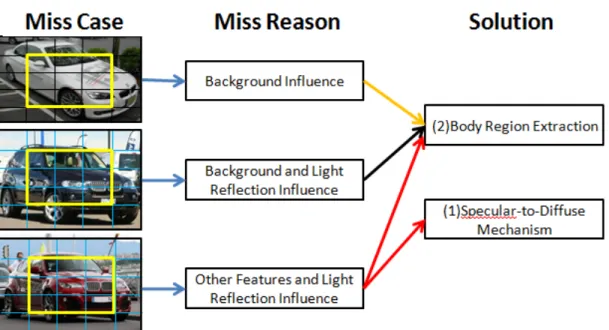
Due to the influence of background, windshield, and car lamps, the classification of domination color might be affected. Therefore, we propose a novel method to improve the results later on. Figure 3-5 shows some miss cases, miss reason, and the solution method.
Figure 3-5. The Reason of Bad Results in Image Color Discrimination
3.3 Vehicle Body Region Extraction
Finding the vehicle body region is a way to improve the performance of the vehicle color recognition. The advantage of finding vehicle body region is that we can classify the vehicle body’s color without the influence of background or other features, such as windshield and car lamps. In order to extract the vehicle body region, we firstly use the hill-manipulation image segmentation algorithm [13] to collect pixels
19
with similar colors into a region. An image as shown in Fig. 3-6 (a) is split into many regions as shown in Fig 3-6 (b).
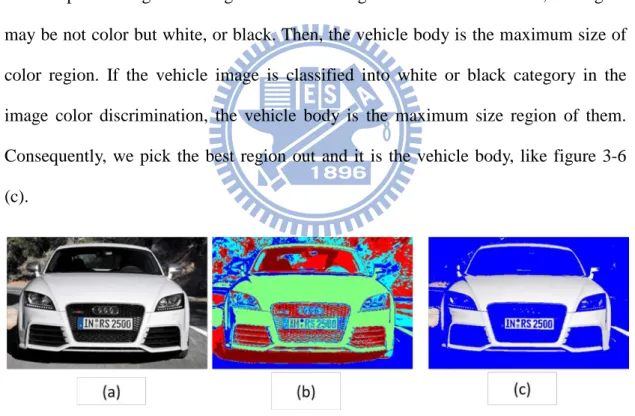
However, it is challenging to know which regions belong to the vehicle body. Thus, we propose a method to find them out. Initially, we count the size of each region and find the top three largest size regions. Moreover, we check if those regions are locating at the central area or not. Only the region which occupies a large and prominent area is considered as a candidate of the vehicle body. Next, we decide which region is the vehicle body. One is that if the vehicle image is classified in colors category in initial vehicle color discrimination, we count the average saturation of the top three largest size regions. If the average saturation is too small, the region may be not color but white, or black. Then, the vehicle body is the maximum size of color region. If the vehicle image is classified into white or black category in the image color discrimination, the vehicle body is the maximum size region of them. Consequently, we pick the best region out and it is the vehicle body, like figure 3-6 (c).
Figure 3-6. The Result of Vehicle Body Extraction (a) Original Vehicle Image (b) Image Segmentation on Vehicle Image (c) Extracted Vehicle Body Image
3.4 Using Specular-To-Diffuse Mechanism
20
problem is that some vehicles whose shells have light reflection. When we try to find the vehicle body, we wish to collect the similar color in the same region. However, the light reflections have bad influence on color image segmentation. Because the color difference between the original vehicle shell and the light reflection parts is significant, the vehicle shell will be broken into multiple regions after hill-manipulation image segmentation. Therefore, we cannot find a complete vehicle shell. Moreover, we may regard the wrong parts as the vehicle body. Figure 3-7 shows a yellow car image, the image after segmentation, and the extracted vehicle body. Figure 3-7(a) is a vehicle image. Figure 3-7 (b) is an image segmentation result. Figure 3-7(c) is a vehicle body extraction result.
Figure 3-7. Broken Region of Vehicle Body Extraction on Light Reflection Influence (a) Original Vehicle Image (b) Image Segmentation on Vehicle Image (c) Extracted Vehicle Body Image
In order to solve the problem of light reflection, we use the specular-to-diffuse mechanism [15] to overcome highlight influence before the vehicle body region extraction step. Figure 3-8 is the result of using specular-to-diffuse mechanism. Figure 3-8(a) is original image. Figure 3-8(c) is the image after specular-to-diffuse mechanism. Figure 3-8(b) is the result of image segmentation (c). Figure 3-8(d) is the vehicle body extraction result.
21
that the surface colors are white, gray, or black. After the image color discrimination, we roughly classify vehicle images into three categories: white, black, and colors. Therefore, we only use the specular-to-diffuse mechanism on the vehicle images belonging to color category. Figure 3-9 through Figure 3-11 show some results of the image segmentation and the results after specular-to-diffuse mechanism. Figure 3-9(a), Figure 3-10(a), and Figure 3-11(a) are color car, black car, and white car, respectively. Figure 3-9(b), Figure 3-10(b), and Figure 3-11(b) show the image segmentation results without specular-to-diffuse mechanism. Figure 3-9(c), Figure 3-10(c), and Figure 3-11(c) show the results after specular-to-diffuse mechanism. Figure 3-9(d), Figure 3-10(d), and Figure 3-11(d) show the image segmentation results with specular-to-diffuse mechanism.
Figure 3-8. Improved Vehicle Body Extraction Using Specular-Free Machanism (a) Original Vehicle Image (b) Image Segmentation on Vehicle Image (c) Specular-Free Vehicle Image (d) Extracted Vehicle Body on Specular-Free Image
22
Figure 3-9. The Result of Vehicle Image Segmentation on Red Car (a) Original Vehicle Image (b) Image Segmentation on Vehicle Image (c) Specular-Free Vehicle Image (d) Image Segmentation on Specular-Free Vehicle Image
Figure 3-10. The Result of Vehicle Image Segmentation on Black Car (a) Original Vehicle Image (b) Image Segmentation on Vehicle Image (c) Specular-Free Vehicle Image (d) Image Segmentation on Specular-Free Vehicle Image
23
Figure 3-11. The Result of Vehicle Image Segmentation on White Car (a) Original Vehicle Image (b) Image Segmentation on Vehicle Image (c) Specular-Free Vehicle Image (d) Image Segmentation on Specular-Free Vehicle Image
3.5 Vehicle Body Color Discrimination
After the vehicle body region extraction step, we calculate the dominant color of vehicle body region without the windshield, car lamps, background, and so on. There are many color models that can be used on color classification. In our case, we discriminate the color vehicle images by using the HSI model as the base. Because the color described by HSI color model is more intuitive to human’s eyes. Moreover, after transforming the dominant color from RGB to HSI, we need to compare the hue value with the hue value of all colors, such as red, blue, green, yellow, pink, purple, and orange. We want to find the most similar color to the dominant color of vehicle body region. Therefore, we can decide the color category of vehicle image.
24
3.6 Iterative Process
We propose an iterative process to improve the accuracy of our mechanism. After we acquire the category of the body color discrimination (BCD), we want to check the results of image color discrimination (ICD) step and vehicle body color discrimination (BCD) step, respectively. If the category results are the same, we complete and finish all of the vehicle color classification. For example, a vehicle image is discriminated into color category in image color discrimination (ICD) step, and the dominant color of vehicle body region is red, red, blue, green, yellow, pink, purple, or orange. In that case, we say that the classification is the same and then finish all of process. The other example is that a vehicle image is discriminated into colors category in image color discrimination (ICD) step, and the dominant color of vehicle body region is white or black. Then, we will execute the iterative process. Therefore, we will choose white category and run the entire step once again. In generally, the colors and white categories always have the higher priority than black category. The Figure 3-12 is the flow chart of iterative process. We compare the results of image color discrimination (IDC) and body color discrimination (BCD).
25
Chapter 4. Experimental Results
In this chapter, we present the experiments for the vehicle color classification and show the result of the classification. In the section 4.1, we introduce the datasets that are used in our experiments. In the section 4.2, we show the experimental results of the vehicle color classification on body region.
4.1 Experimental Dataset
The vehicle images used in our experiment are collected from several Internet web sites. In our dataset, there are 9 kinds of colors, such as black, white, red, blue, green, yellow, pink, purple, and orange. For each color, we select 30 images with different vehicle brands and vehicle body orientations. As a result, there are totally 270 different images in our database. Some sample images of the database are shown in Figure 4-1.
26
4.2 Experimental Results
We discriminate the color vehicle images by using the HSI model as the base. Moreover, we determine the root mean square error between the dominant hue value of vehicle body and the ground truth of this vehicle. The ground truth is constructed by handiwork. In each tested vehicle image, we choose five pixel points from the vehicle body region. We determine the average value of them, which becomes ground truth.
There are three experimental results based on our proposed method. One is the accuracy of vehicle color classification of image color discrimination process and body region discrimination process. We classify vehicle images into three categories: color, white, and black. The next one is the root mean square error of image color discrimination process and body region discrimination process. We compare the distance between the dominant color of vehicle and ground truth. The last one is the accuracy of vehicle color classification of image color discrimination process and body region discrimination process. We classify vehicle image into nine categories: black, white, red, blue, green, yellow, pink, purple, and orange.
Figure 4-2 shows the classification accuracy on three types: black, white, and color. The left bar is the accuracy of image color discrimination (ICD) process. The accuracy of black, white, and color are 53.34%, 73.34, and 70.83, respectively. The right bar is the accuracy of body region discrimination (BCD) process. The accuracy of black, white, and color are 90%, 93.34%, and 89.58%, respectively.
Figure 4-3 shows the root mean square (RMS) error of the vehicle color classification that image color discrimination (ICD) process and vehicle body region discrimination (BCD)process. The results show that the average root mean square error of image color discrimination (ICD) part and body region discrimination (BCD)
27
part are 21.81° and 4.9°, respectively. There is an obvious reduction of root mean square error by using the body region discrimination (BCD) process on the root mean square error.
Figure 4-2. The classification accuracy on black, white, color
Figure 4-3. The root mean square error of dominant color
Figure 4-4 shows the accuracy of vehicle color classification that image color discrimination (ICD) and body region discrimination (BCD). The experiment show
avg red orange purple green blue yellow pink
ICD 21.8167 20.1 19.2 22.9 8.5 9.3 32.8 39.9 BCD 4.9 3.3 4 6.8 6.9 4.5 2.9 6.1 0 5 10 15 20 25 30 35 40 45
RMS (°)
28
the 9 kind of colors accuracy on image color discrimination (ICD) process and body region discrimination process (BCD). There is an obvious improvement on accuracy by using body region discrimination process on our vehicle color classification.
Figure 4-4. The accuracy of 9 color types on vehicle color classification
avg black white red orange yellow green blue purple pink ICD 70 53.34 73.34 46.67 66.67 80 76.67 80 76.67 76.67 BCD 90.37 90 93.34 86.67 86.67 93.34 93.34 96.67 86.67 86.67 0 10 20 30 40 50 60 70 80 90 100
accuracy (%)
29
Chapter 5. Conclusion and Future work
In this thesis, we present a novel algorithm of vehicle color classification. We adopt an efficient color image segmentation algorithm that uses seeded region growing method and clustering technique to segment a vehicle image into regions. Moreover, we propose a method to extract vehicle body region from those regions. We also apply a specular-free method to reduce the light reflection influence on extracted vehicle body. Besides, we design an iterative process to check the dominant color of vehicle body. By this process, we can improve the accuracy of vehicle color classification. Based on this system architecture, we implement a vehicle color classification system. The testing images are downloaded from Internet web sites. The experimental results show that the accuracy acquires a great improvement after finding the vehicle body region.
Some interesting issues based on vehicle body extraction are worthy for further investigation. If the vehicle body can be extracted much completely, we can duplicate a car image to many car images in different colors by replacing pixel colors in car body.
30
Bibliography
[1] Jeong-Woo Son, Seong-Bae Park, and Ku-Jin Kim, “A Convolution Kernel Method for Color Recognition,” Sixth International Conference on Advanced Language Processing and Web Information Technology, pp. 242 – 247, 2007
[2] Nakhoon Baek, Sun-Mi Park, Ku-Jin Kim, and Seong-Bae Park, “Vehicle Color Classification Based on the Support Vector Machine Method,” Communications in Computer and Information Science, Vol. 2, Part 2, pp. 1133-1139, 2007
[3] Ku-Jin Kim, Sun-Mi Park, and Yoo-Joo Choi, “Deciding the Number of Color Histogram Bins for Vehicle Color Recognition,” IEEE Asia-Pacific Services Computing Conference, pp. 134-138, 2008
[4] Xiuzhi Li, Guangming Zhang, Jing Fang, Jian Wu, Zhiming Gui, “Vehicle Color Recognition Using Vector Matching of Template,” 2010 Third International Symposium on Electronic Commerce and Security, pp.189-193, 2010
[5] Zhan Xu, Jing Cao*, “Vehicle Color Extraction Based on First Sight Window,” 2009 First International Conference on Information Science and Engineering, pp.1503-1506, 2009
[6] Yi-Ta Wu, Jau-Hong Kao, and Ming-Yu Shih, “A Vehicle Color Classification Method for Video Surveillance System Concerning Model-Based Background Subtraction,” Advances in Multimedia Information Processing - Pacific Rim Conference on Multimedia 2010, PP. 369-380, 2010
[7] Miriam Butzke, Alexandre da G. Silva, Marcelo da S. Hounsell, and Maur´ıcio A. Pillon, “Automatic Recognition of Vehicle Attributes –Color Classification and Logo Segmentation”, HÍFEN, Vol. 32, No. 62, pp. 293-300, 2008
[8] ERIDA DULE, MUHĐTTĐN GÖKMEN, and M. SABUR BERATOĞLU, “A Convenient Feature Vector Construction for Vehicle Color Recognition,” 11th
31
WSEAS international conference on nural networks , pp. 250-255, 2010
[9] R.Aarthi, S.Padmavathi, J.Amudha, “Vehicle Detection in Static Images Using Color and Corner Map,” 2010 International Conference on Recent Trends in Information, Telecommunication and Computing, pp.244-246, 2010
[10] Jui-Chen Wu, Jun-Wei Hsieh, Yung-Sheng Chen, and Cheng-Min Tu, “Vehicle Orientation Detection Using Vehicle Color and Normalized Cut Clustering,” MVA2007 IAPR Conference on Machine Vision Applications, pp. 457-460, 2007 [11] Shin-Yu Chen, Jun-Wei Hsieh, Jui-Chen Wu, and Yung-Sheng Chen, “Vehicle Retrieval Using Eigen Color and Multiple Instance Learning,” 2009 Fifth International Conference on Intelligent Information Hiding and Multimedia Signal Processing, pp.657-660, 2009
[12] T. Ohashi, Z. Aghbari, A.Makinouchi, “Hill-climbing algorithm for efficient color-based image segmentation,” IASTED International Conference on Signal Processing, Pattern Recognition, and Applications, pp. 17-22, 2003
[13] Zaher Al Aghbari , Ruba Al-Haj, “Hill-manipulation: An effective algorithm for color image segmentation,” Image and Vision Computing, Vol 24, Issue 8, pp. 894-903, 2006
[14] S. Shafer, “Using Color to Separate Reflection Components,” Color Research and Applications, pp. 210-218, 1985
[15] Robby T. Tan, and Katsushi Ikeuchi, “Separating Reflection Components of Textured Surfaces Using a Single Image”, IEEE Transactions on Pattern Analysis and Machine Intelligence, Vol 27, No. 2, pp. 178-193, 2005
[16] H.C. Lee, E.J. Breneman, and C.P. Schulte, “Modeling Light Reflection for Computer Color Vision,” IEEE Trans. Pattern Analysis and Machine Intelligence, pp. 402-409, 1990
![Figure 2-5. The Result of Maximum Chromaticity and Intensity Space [14]](https://thumb-ap.123doks.com/thumbv2/9libinfo/8147626.166961/19.892.244.649.113.366/figure-result-maximum-chromaticity-intensity-space.webp)
![Figure 2-6. The Intersection Point of Specular and Diffuse [14]](https://thumb-ap.123doks.com/thumbv2/9libinfo/8147626.166961/20.892.252.645.117.395/figure-intersection-point-specular-diffuse.webp)